. 2022 Apr;162(4):1303-1318.e18.
doi: 10.1053/j.gastro.2021.12.273. Epub 2021 Dec 30.

Loss of Rnf43 Accelerates Kras-Mediated Neoplasia and Remodels the Tumor Immune Microenvironment in Pancreatic Adenocarcinoma

Affiliations

Loss of Rnf43 Accelerates Kras-Mediated Neoplasia and Remodels the Tumor Immune Microenvironment in Pancreatic Adenocarcinoma

Abdel Nasser Hosein et al. Gastroenterology. 2022 Apr.

Abstract

Background & aims: RNF43 is an E3 ubiquitin ligase that is recurrently mutated in pancreatic ductal adenocarcinoma (PDAC) and precursor cystic neoplasms of the pancreas. The impact of RNF43 mutations on PDAC is poorly understood and autochthonous models have not been characterized sufficiently. In this study, we describe a genetically engineered mouse model (GEMM) of PDAC with conditional expression of oncogenic Kras and deletion of the catalytic domain of Rnf43 in exocrine cells.

Methods: We generated Ptf1a-Cre;LSL-KrasG12D;Rnf43flox/flox (KRC) and Ptf1a-Cre; LSL-KrasG12D (KC) mice and animal survival was assessed. KRC mice were sacrificed at 2 months, 4 months, and at moribund status followed by analysis of pancreata by single-cell RNA sequencing. Comparative analyses between moribund KRC and a moribund Kras/Tp53-driven PDAC GEMM (KPC) was performed. Cell lines were isolated from KRC and KC tumors and interrogated by cytokine array analyses, ATAC sequencing, and in vitro drug assays. KRC GEMMs were also treated with an anti-CTLA4 neutralizing antibody with treatment response measured by magnetic response imaging.

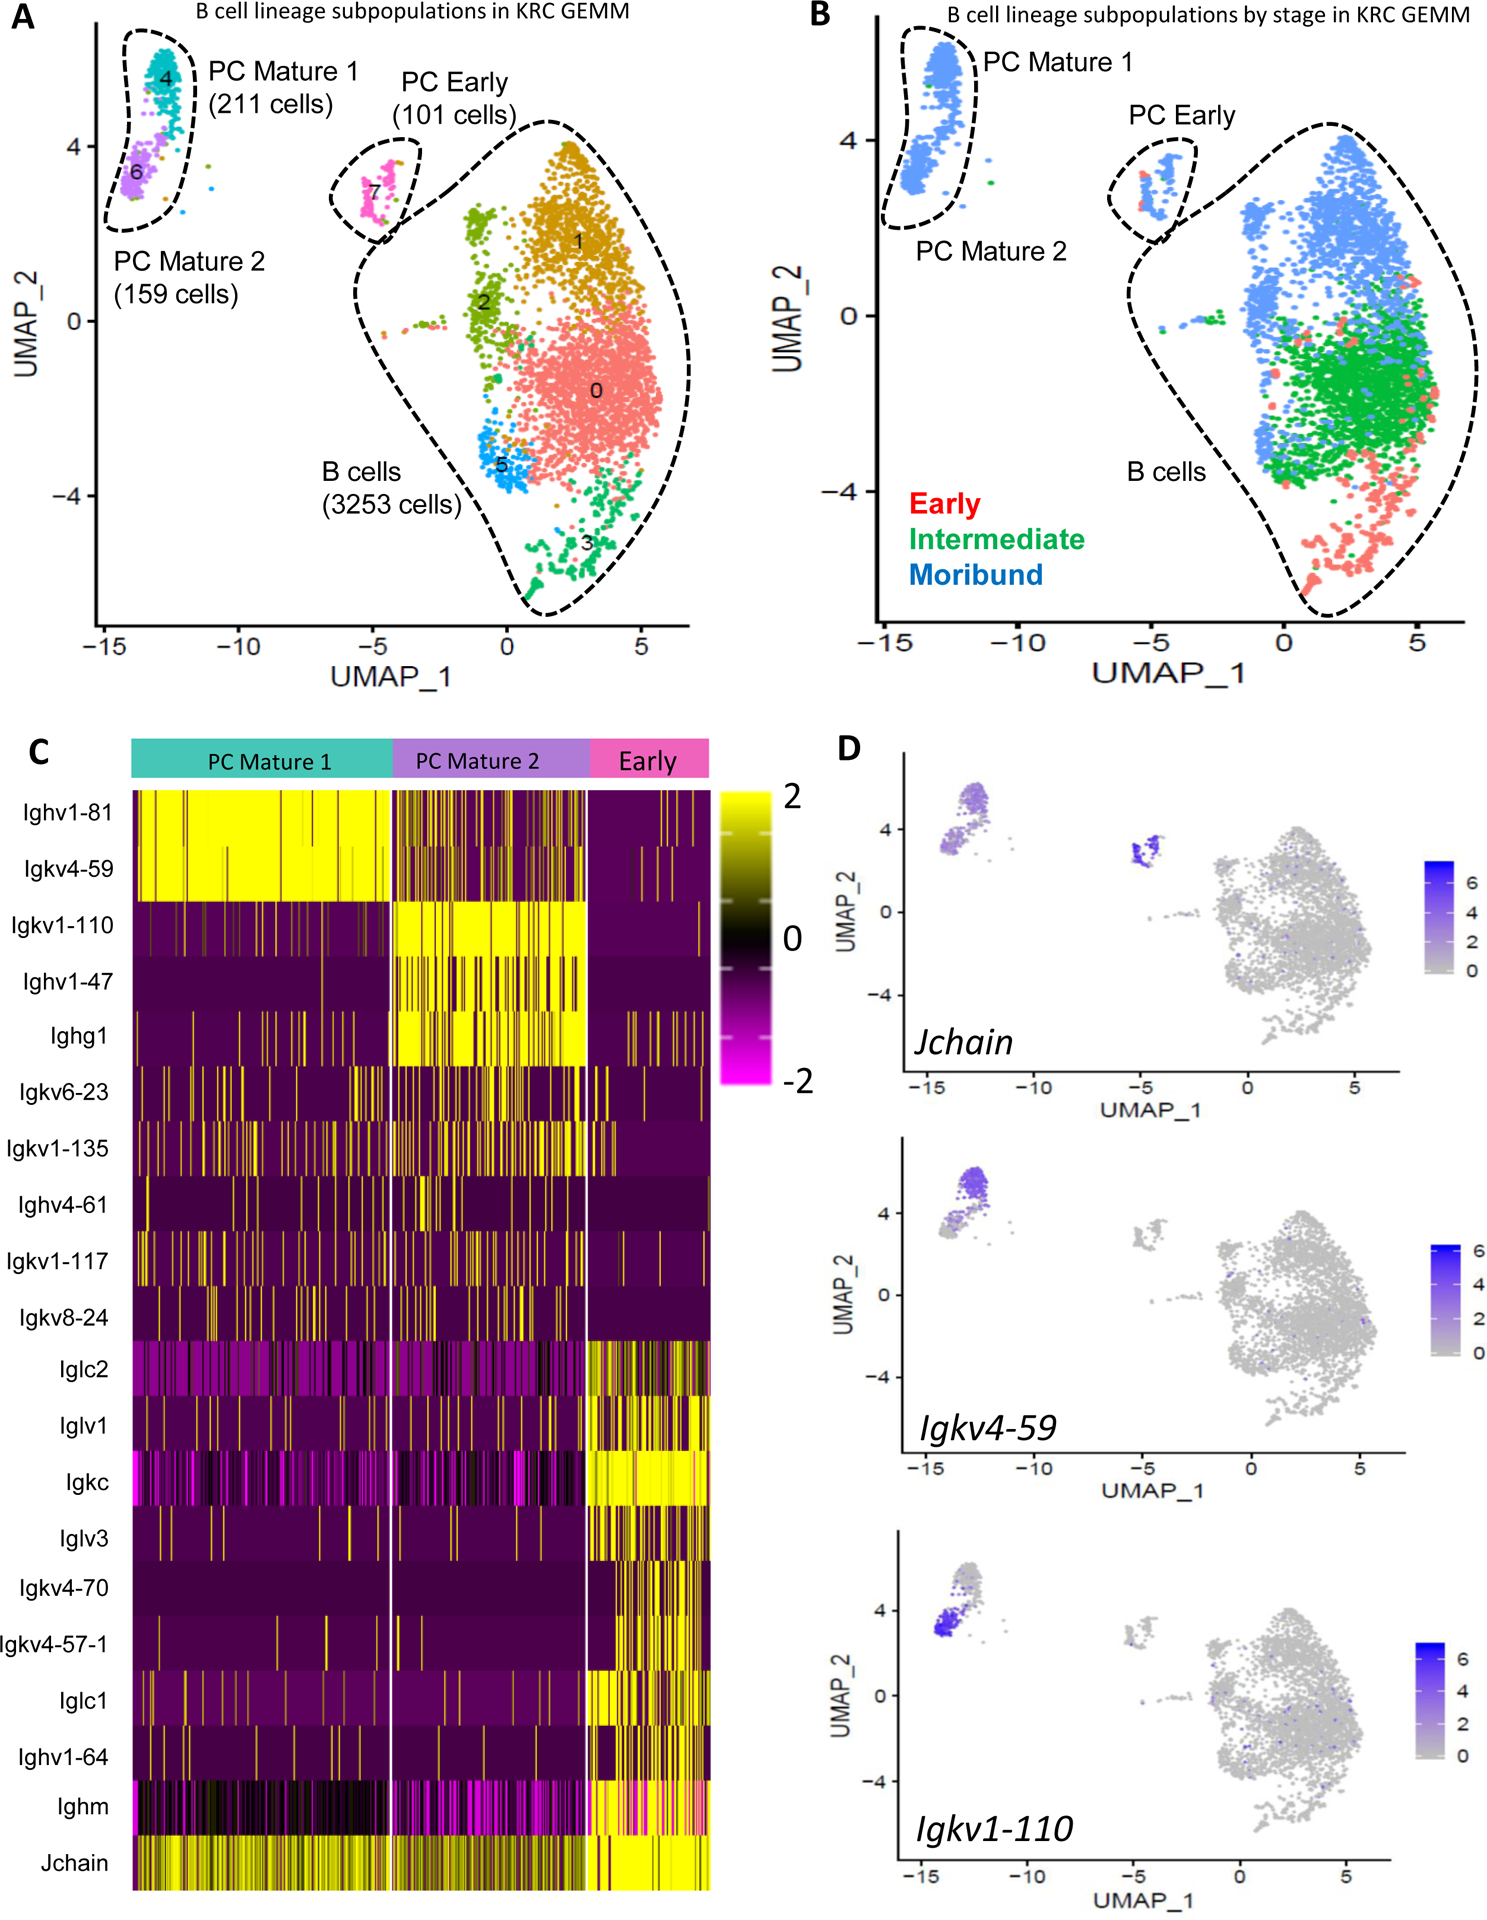
Results: We demonstrate that KRC mice display a marked increase in incidence of high-grade cystic lesions of the pancreas and PDAC compared with KC. Importantly, KRC mice have a significantly decreased survival compared with KC mice. Using single-cell RNA sequencing, we demonstrated that KRC tumor progression is accompanied by a decrease in macrophages, as well as an increase in T and B lymphocytes, with evidence of increased immune checkpoint molecule expression and affinity maturation, respectively. This was in stark contrast to the tumor immune microenvironment observed in the KPC PDAC GEMM. Furthermore, expression of the chemokine CXCL5 was found to be specifically decreased in KRC cancer cells by means of epigenetic regulation and emerged as a putative candidate for mediating the unique KRC immune landscape.

Conclusions: The KRC GEMM establishes RNF43 as a bona fide tumor suppressor gene in PDAC. This GEMM features a markedly different immune microenvironment compared with previously reported PDAC GEMMs and puts forth a rationale for an immunotherapy approach in this subset of PDAC cases.

Keywords: Genetically Engineered Mouse Models; KRAS; Pancreatic Cancer; Single-Cell RNA Sequencing; Tumor Suppressor Gene.


Conflict of interest statement

Disclosures:

A.M. receives royalties for a pancreatic cancer biomarker test from Cosmos Wisdom Biotechnology, and this financial relationship is managed and monitored by the UTMDACC Conflict of Interest Committee. A.M. is also listed as an inventor on a patent that has been licensed by Johns Hopkins University to ThriveEarlier Detection. A.M. serves as a consultant for Freenome and Tezcat Biotechnology.

All other authors are free of conflicts of interest and have nothing to disclose.

Figures

Figure 1:
Figure 1:. Loss of Rnf43 cooperates with oncogenic Kras in the development of cystic lesions and invasive ductal adenocarcinoma of the pancreas with shortened survival.
(A) Bar graph displaying the incidence of cystic lesions in mice below the age of 52 weeks, including mice from both survival and timed-necropsy cohorts. Two-sided Fisher’s exact test was performed to calculate p-value. (B) Representative images of KRC cystic histology showing mucinous papillary projections of ductal epithelium. Black scale bar: 500 μm. (C) Bar graph showing cancer incidences of mice within the age of 52 weeks. Two-sided Fisher’s test performed. **p<0.01. (D) Representative images of H&E and CK19 staining of PDAC from indicated genotypes (Black scale bar: 500 μm.). (E) Overall survival analysis of mice with indicated genotypes. Log-rank test was performed (*p <0.05; ***p<0.001).
Figure 2:
Figure 2:. scRNAseq analysis of KRC GEMM progression.
(A) UMAP plots of all cells in the early (left; 2774 cells), intermediate (center; 5488 cells) and moribund (right; 3249 cells) KRC GEMM stages. Cell lineage is labeled and denoted by color on each UMAP plot. (B) Dot plots corresponding to each of the UMAPs; KRC early (left), KRC intermediate (center), KRC moribund (right). C) Summary bar graph denoting the percentage of each cell type observed in the UMAPs for each of the three stages analyzed. Color legend appears in the graphic. D) UMAP displaying all fibroblasts observed across the three KRC stages with a graph-based population delineation method applied to illustrate fibroblast subpopulations. (E) Fibroblast UMAP with each cell color coded according to KRC stage.
Figure 3:
Figure 3:. Myeloid focused scRNAseq analysis of the KRC GEMM.
(A) UMAP displaying all cells of myeloid lineage observed across the three KRC stages (early, intermediate, moribund) with a graph-based population delineation method applied to illustrate myeloid subpopulations. (B) Myeloid UMAP with each cell color coded according to KRC stage (early = red, intermediate = green, moribund = blue). (C) Summary bar graph denoting the percentage of each myeloid cell type observed in each of the three KRC stages analyzed. (D) Single gene UMAP of all myeloid cells in KPC and KRC GEMMs with Adgre1 expression denoted. The tissue resident macrophage population is outlined. (E) Quantification of CD68, ARG1 and F4/80 immunofluorescence in KRC (n=4 tumors) and KPC (n=3 tumors) tissue sections. The percentage of cells positive for all three markers were averaged and displayed (two-sided t-test, *p<0.05). (F) Three color immunofluorescence analysis of macrophage markers, CD68 (white), ARG1 (gold), F4/80 (red) and DAPI (blue), in KPC (left) and KRC (right) tumors. White scale bar: 200 μm.
Figure 4:
Figure 4:. B cell lineage focused scRNAseq analysis of the KRC GEMM.
(A) UMAP displaying all cells of B cell lineage observed across the three KRC stages (early, intermediate, moribund) with a graph-based population delineation method applied to illustrate B lineage subpopulations. (B) B lineage UMAP with each cell color coded according to KRC stage (early = red, intermediate = green, moribund = blue). (C) Immunoglobulin (Ig) focused heatmap displaying Ig gene expression across the two mature and one early plasma cell subpopulations. Log color scale is noted to top-right of heatmap. (D) Single gene UMAP displaying specific markers for the early plasma cells (top; Jchain), mature plasma cell 1 (middle; Igkv4-59), and mature plasma cell 2 (bottom; Igkv1-110).
Figure 5:
Figure 5:. T-cell lineage focused scRNAseq analysis of the KRC GEMM.
(A) UMAP displaying all cells of T-cell lineage observed across the three KRC stages (early, intermediate, moribund) with a graph-based population delineation method applied to illustrate T lineage subpopulations. (B) T lineage UMAP with each cell color coded according to KRC stage (early = red, intermediate = green, moribund = blue). (C) Focused dot plot analysis displaying expression intensity and frequency of immune checkpoint genes in the regulatory T cell subpopulation. (D) Trial timeline schematic of KRC mice treated with either IgG isotype control antibody (n=6) or anti-CTLA4 antibody (n=6). Timing of antibody administration, MR imaging and planned animal sacrifice are all noted on the timeline. (E) Table displaying the results of the isotype control vs CTLA4 antibody treatment in KRC mice. (F) Representative axial T2 weighted MR images of longitudinally followed KRC mice treated with isotype control antibody (top row) or anti-CTLA4 antibody (bottom row).
Figure 6:
Figure 6:. CXCL5 is downregulated in the KRC cancer epithelium.
(A) Mouse cytokine arrays displaying relative intensities of proteins secreted into the media after 48 hour incubation with KC (top, left) and KPC (top, right) cell lines or KRC cell lines (bottom). The red rectangle outlines the dots corresponding to CXCL5. (B) ELISA confirmation of mouse CXCL5 on 48-hour conditioned media from 3 Rnf43 wild type and 3 KRC mouse PDAC cell lines. ** p<0.001, two-sided t-test comparing KRC vs Rnf43 intact cell lines (C) Quantitative PCR analysis of Cxcl5 in the same 3 Rnf43 wild type and 3 KRC mouse PDAC cell lines. ** p<0.001, two-sided t-test comparing KRC vs Rnf43 intact cell lines (D) Violin plot of Cxcl5 expression scRNAseq datasets for KRC and KPC GEMMs. (E) ATAC-seq analysis of the transcription start site of Cxcl5 in the 3 Rnf43 wild type mouse PDAC cell lines and 3 KRC mouse PDAC cell lines. −3.47 log2 fold change (p= 5.52×10⁻⁷) between the Rnf43 wild type and KRC mouse PDAC cell lines (regions outlined by the hashed boxes). Vertical arrow indicates transcription start site. (F) qPCR analysis of Cxcl5 in 2 KRC mouse PDAC cell lines treated with increasing doses of Panobinostat with all experiments done in triplicate (* p<0.05, ***p<0.001, one way ANOVA with Tukey’s multiple comparison post-hoc test). (G) Pancreas masses at 4 weeks in mice orthotopically injected with a KRC cell line transduced with empty vector (red) or Cxcl5 (blue). 105 cells/mouse were implanted in all experiments. The empty vector group (n = 8) had an average pancreas mass of 0.18g and the Cxcl5 transduced group (n = 8) had an average tumor mass of 0.58g (***p<0.001, two-sided Student’s t-test). (H) Representative T2 weighted MRI (axial view) of mice orthotopically implanted with empty vector transduced KRC cells (left) and Cxcl5 transduced KRC cells (right).

References

    1. Siegel RL, et al., Cancer Statistics, 2021. CA Cancer J Clin, 2021. 71(1): p. 7–33. - PubMed
    1. Rahib L, et al., Projecting cancer incidence and deaths to 2030: the unexpected burden of thyroid, liver, and pancreas cancers in the United States. Cancer Res, 2014. 74(11): p. 2913–21. - PubMed
    1. Cancer Genome Atlas Research Network. Electronic address, a.a.d.h.e. and N. Cancer Genome Atlas Research, Integrated Genomic Characterization of Pancreatic Ductal Adenocarcinoma. Cancer Cell, 2017. 32(2): p. 185–203 e13. - PMC - PubMed
    1. Noe M, et al., Genomic characterization of malignant progression in neoplastic pancreatic cysts. Nat Commun, 2020. 11(1): p. 4085. - PMC - PubMed
    1. Koo BK, et al., Tumour suppressor RNF43 is a stem-cell E3 ligase that induces endocytosis of Wnt receptors. Nature, 2012. 488(7413): p. 665–9. - PubMed

Publication types

Substances

LinkOut - more resources