. 2022 Mar-Apr:46:102252.
doi: 10.1016/j.tmaid.2021.102252. Epub 2021 Dec 30.

Tracking and controlling the spatiotemporal spread of SARS-CoV-2 Omicron variant in South Africa

Affiliations

Tracking and controlling the spatiotemporal spread of SARS-CoV-2 Omicron variant in South Africa

Chengzhuo Tong et al. Travel Med Infect Dis. 2022 Mar-Apr.

Abstract

Background: South Africa is the focus of the current epidemic caused by Omicron. Understanding the spatiotemporal spread of Omicron in South Africa and how to control it is crucial to global countries.

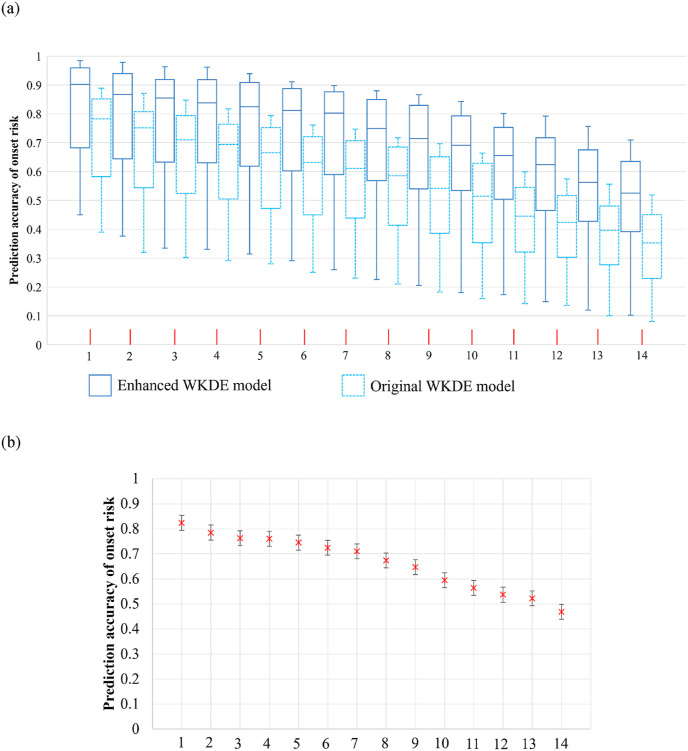
Methods: To explore the spatiotemporal spread of Omicron in 9 provinces in South Africa, a province-level geographic prediction model of COVID-19 symptom onset risk, is proposed.

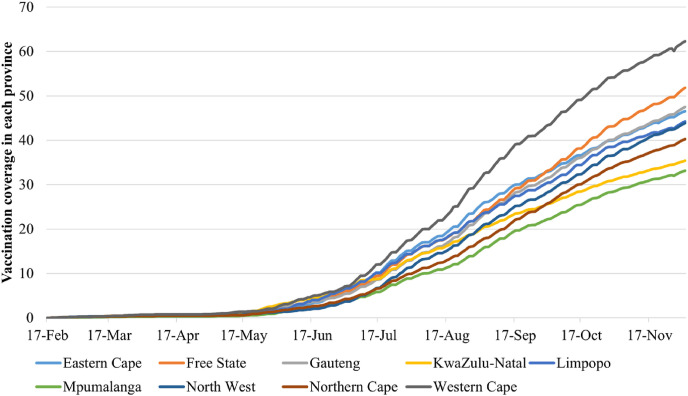
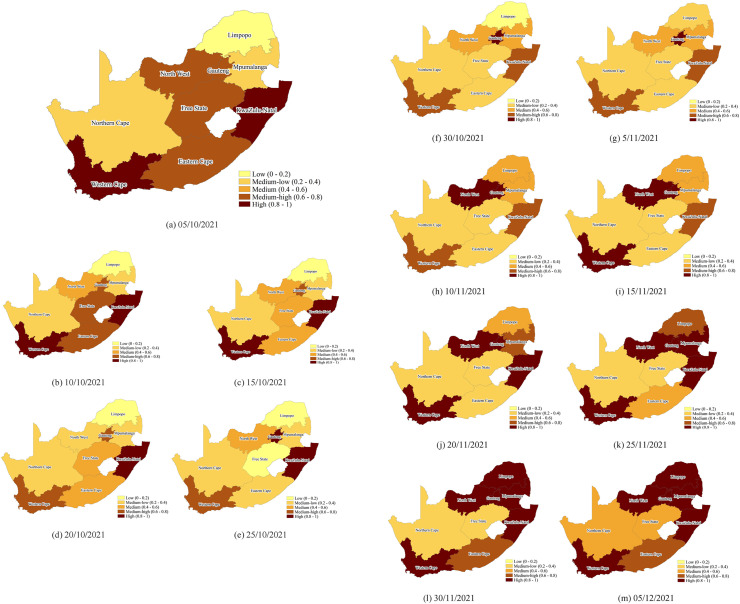
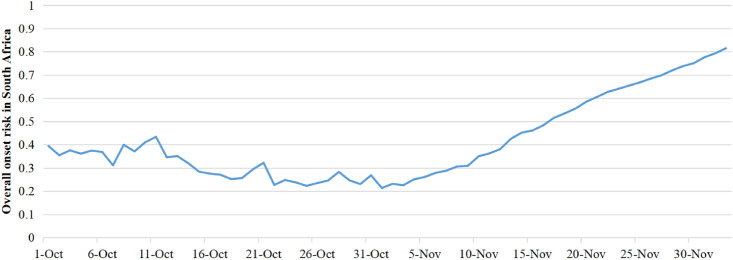
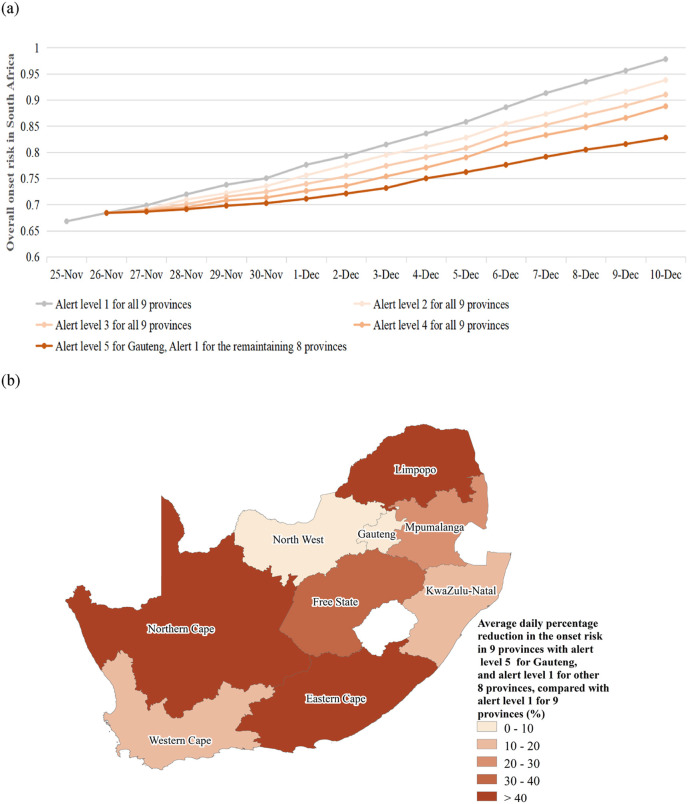
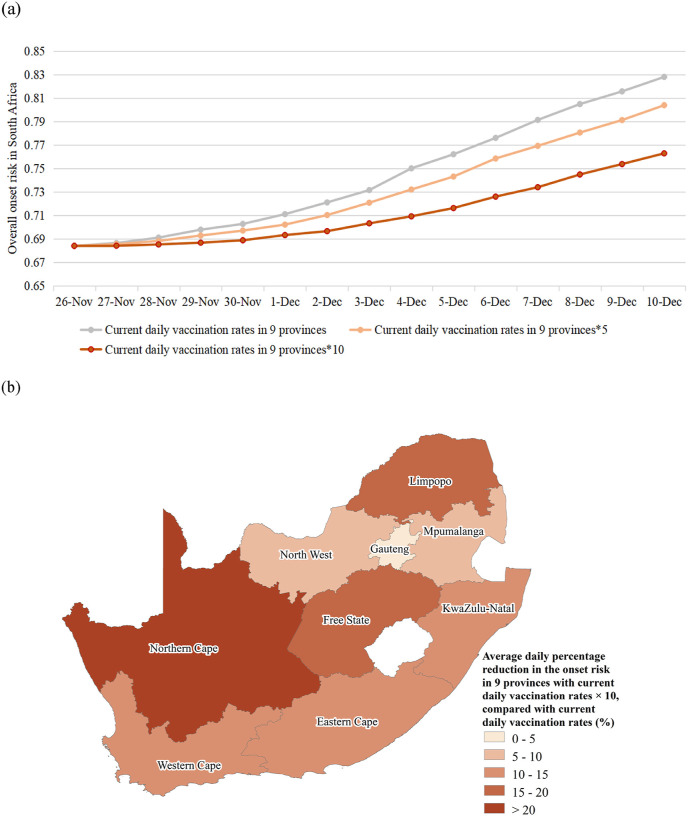
Results: It has been found that i) The spatiotemporal spread was relatively slow during the first stage and following the emergence of Omicron in Gauteng. The spatial spread of Omicron accelerated after it had become the dominant variant, and continued to spread from Gauteng to the neighboring provinces and main transport nodes. ii) Compared with current Alert Levels 1-4 in all provinces, the imposition of lockdown in the high-onset-risk Gauteng together with the Alert Level 1 in other 8 provinces, was found to more effectively control the spread of Omicron in South Africa. Moreover, it can reduce the spread of the Omicron epidemic in the provinces where main international airports are located to other parts of the world. iii) Due to declining vaccine efficiency over time, even when the daily vaccination rates in each province increased by 10 times, the daily overall onset risk was only reduced by 0.34%-7.86%.

Conclusions: Our study has provided a comprehensive investigation concerning the spatiotemporal dynamics of Omicron and hence provided scientific findings to enable a contribution which will assist in controlling the spatiotemporal spread of Omicron by integrating the prevention measures and vaccination.

Keywords: Control; Omicron; Severe acute respiratory syndrome coronavirus 2; South Africa; Spatiotemporal spread.


Figures

Fig. 1
Fig. 1
The daily variation of the human mobility in the 9 provinces of South Africa from September 1st, 2021 to December 5th, 2021.
Fig. 2
Fig. 2
The daily variation rates of the COVID-19 vaccination rates in the 9 provinces of South Africa from February 17th, 2021 to December 5th, 2021.
Fig. 3
Fig. 3
The accuracy of the predicted risk of COVID-19 symptom onset by province-level WKDE models, and 95% confidence interval of the prediction accuracy [18,19]. (a) The accuracy of the predicted risk of COVID-19 symptom onset by the enhanced and original WKDE models. The predicted onset risk is a normalized value between 0 and 1, hence, indicating risk relative to the highest predicted risk among all locations, on the date for which the risk of symptom onset is predicted, hereafter termed “the prediction date”. The prediction accuracy is defined as the percentage of the onset cases in those areas in which the predicted onset risk was higher than 0.8 on the decided prediction date. The time interval denotes the period between the base date and the date of prediction. The horizontal line in the box denotes the median, while the lower and upper edges of the box represent the respective first and third quartiles. The lines emanating from the box a) upwards and b) downwards, represent the respective maximum and minimum values. (b) The 95% confidence interval of the mean accuracy of the predicted risk of COVID-19 symptom onset by province-level WKDE models.
Fig. 4
Fig. 4
Predicted risk of COVID-19 symptom onset across 9 provinces in South Africa (a–i) The predicted onset risk during the study period from October 1st, 2021 to December 5th, 2021. The predicted COVID-19 symptoms onset risk was generated using the province-level WKDE model.
Fig. 5
Fig. 5
Daily overall risk of COVID-19 symptom onset in South Africa from October 1st, 2021 to December 10th, 2021.
Fig. 6
Fig. 6
The risk of COVID-19 symptom onset in the five epidemic alert scenarios (i.e., the current Alert Level 1 in all 9 provinces, Alert Level 2 in all 9 provinces, Alert Level 3 in all 9 provinces, Alert Level 4 in all 9 provinces, and Alert Level 5 in Gauteng together with Alert Level 1 in other 8 provinces) from October 27th, 2021 to December 10th, 2021. (a) The overall onset risk in the five epidemic alert scenarios. The plotted values were computed with the predicted risk of COVID-19 symptom onset in the four epidemic alert scenarios. (b) The average daily percentage reduction in the onset risk in 9 provinces, regarding the scenario of the Alert Level 5 for Gauteng together with Alert Level 1 for the remaining 8 provinces, when compared with the scenario of the current Alert Level 1 for the entire South Africa region.
Fig. 7
Fig. 7
The risk of COVID-19 symptom onset with the current daily vaccination rates, 5 times the vaccination rates, 10 times the vaccination rate at the Alert Level 5 for Gauteng together with Alert Level 1 for the remaining 8 provinces from November 27th, 2021 to December 10th, 2021. (a) The overall onset risk with the current daily vaccination rates, 5 times the vaccination rates, and 10 times the vaccination rates in the scenario of Alert Level 5 for Gauteng, together with Alert Level 1 for the remaining 8 provinces. The plotted values were computed from the predicted risk of COVID-19 symptom onset in 9 provinces of South Africa. (b) The average daily percentage reduction in the onset risk in 9 provinces of South Africa with 10 times the current daily vaccination rates, compared with the current daily vaccination rates in the scenario of Alert Level 5 for Gauteng, together with Alert Level 1 for the remaining 8 provinces.

References

    1. World Health Organization WHO Director-General's opening remarks at the media briefing on COVID-19. 2021. https://www.who.int/director-general/speeches/detail/who-director-genera...
    1. delRio C., Omer S.B., Malani P.N. Winter of omicron—the evolving COVID-19 pandemic. JAMA. 2021:n3104. doi: 10.1001/jama.2021.24315. - DOI - PubMed
    1. Shanmugaraj B., Malla A., Khorattanakulchai N., Phoolcharoen W. SARS‐CoV‐2 omicron variant: could it be another threat? J Med Virol. 2021 doi: 10.1002/jmv.27532. - DOI - PMC - PubMed
    1. Torjesen I. Covid-19: omicron may be more transmissible than other variants and partly resistant to existing vaccines, scientists fear. BMJ. 2021;375:n2943. doi: 10.1136/bmj.n2943. - DOI - PubMed
    1. Kandeel M., Mohamed M.E.M., Abd El-Lateef H.M., Venugopala K.N., El-Beltagi H.S. Omicron variant genome evolution and phylogenetics. J Med Virol. 2021 doi: 10.1002/jmv.27515. - DOI - PMC - PubMed

Supplementary concepts