

Direct capture and smartphone quantification of airborne SARS-CoV-2 on a paper microfluidic chip
- PMID: 34973565
- PMCID: PMC8701770
- DOI: 10.1016/j.bios.2021.113912
Direct capture and smartphone quantification of airborne SARS-CoV-2 on a paper microfluidic chip
Abstract
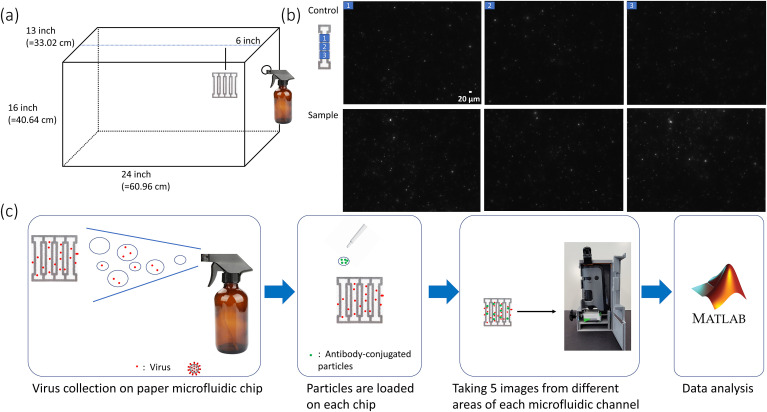
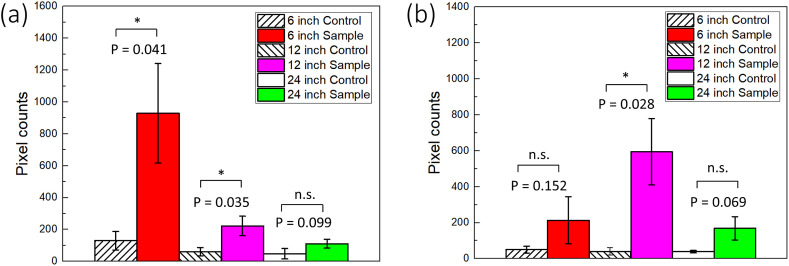
SARS, a new type of respiratory disease caused by SARS-CoV, was identified in 2003 with significant levels of morbidity and mortality. The recent pandemic of COVID-19, caused by SARS-CoV-2, has generated even greater extents of morbidity and mortality across the entire world. Both SARS-CoV and SARS-CoV-2 spreads through the air in the form of droplets and potentially smaller droplets (aerosols) via exhaling, coughing, and sneezing. Direct detection from such airborne droplets would be ideal for protecting general public from potential exposure before they infect individuals. However, the number of viruses in such droplets and aerosols is too low to be detected directly. A separate air sampler and enough collection time (several hours) are necessary to capture a sufficient number of viruses. In this work, we have demonstrated the direct capture of the airborne droplets on the paper microfluidic chip without the need for any other equipment. 10% human saliva samples were spiked with the known concentration of SARS-CoV-2 and sprayed to generate liquid droplets and aerosols into the air. Antibody-conjugated submicron particle suspension is then added to the paper channel, and a smartphone-based fluorescence microscope isolated and counted the immunoagglutinated particles on the paper chip. The total capture-to-assay time was <30 min, compared to several hours with the other methods. In this manner, SARS-CoV-2 could be detected directly from the air in a handheld and low-cost manner, contributing to slowing the spread of SARS-CoV-2. We can presumably adapt this technology to a wide range of other respiratory viruses.
Keywords: Airborne pathogens; Bioaerosol; COVID-19; Paper microfluidics; Respiratory virus; Smartphone microscope.
Copyright © 2021 Elsevier B.V. All rights reserved.
Conflict of interest statement
The authors declare that they have no known competing financial interests or personal relationships that could have appeared to influence the work reported in this paper.
Figures
References
-
- Chen W., Zhang N., Wei J., Yen H.L., Li Y. Build. Environ. 2020;176:106859. doi: 10.1016/j.buildenv.2020.106859. - DOI
-
- Chia P.Y., Coleman K.K., Tan Y.K., Ong S.W.X., Gum M., Lau S.K., Lim X.F., Lim A.S., Sutjipto S., Lee P.H., Son T.T., Young B.E., Milton D.K., Gray G.C., Schuster S., Barkham T., De P.P., Vasoo S., Chan M., Ang B.S.P., Tan B.H., Leo Y.S., Ng O.T., Wong M.S.Y., Marimuthu K. Nat. Commun. 2020;11:2800. doi: 10.1038/s41467-020-16670-2. 2020. - DOI - PMC - PubMed
-
- Fozouni P., Son S., Díaz de León Derby M., Knott G.J., Gray C.N., D'Ambrosio M.V., Zhao C., Switz N.A., Kumar G.R., Stephens S.I., Boehm D., Tsou C.L., Shu J., Bhuiya A., Armstrong M., Harris A.R., Chen P.Y., Osterloh J.M., Meyer-Franke A., Joehnk B., Walcott K., Sil A., Langelier C., Pollard K.S., Crawford E.D., Puschnik A.S., Phelps M., Kistler A., DeRisi J.L., Doudna J.A., Fletcher D.A., Ott M. Cell 184: 1–11. 2020. - DOI
MeSH terms
Substances
Grants and funding
LinkOut - more resources
Full Text Sources
Medical
Miscellaneous
