

Visualizing the Geography of HIV Observational Cohorts With Density-Adjusted Cartograms
- PMID: 34974471
- PMCID: PMC9058192
- DOI: 10.1097/QAI.0000000000002903
Visualizing the Geography of HIV Observational Cohorts With Density-Adjusted Cartograms
Abstract
Background: Maps are potent tools for describing the spatial distribution of population and disease characteristics and, thereby, for appropriately targeting public health interventions. People with HIV (PWH) tend to live in densely populated and spatially compact areas that may be difficult to visualize on maps using unadjusted geographic or political borders.
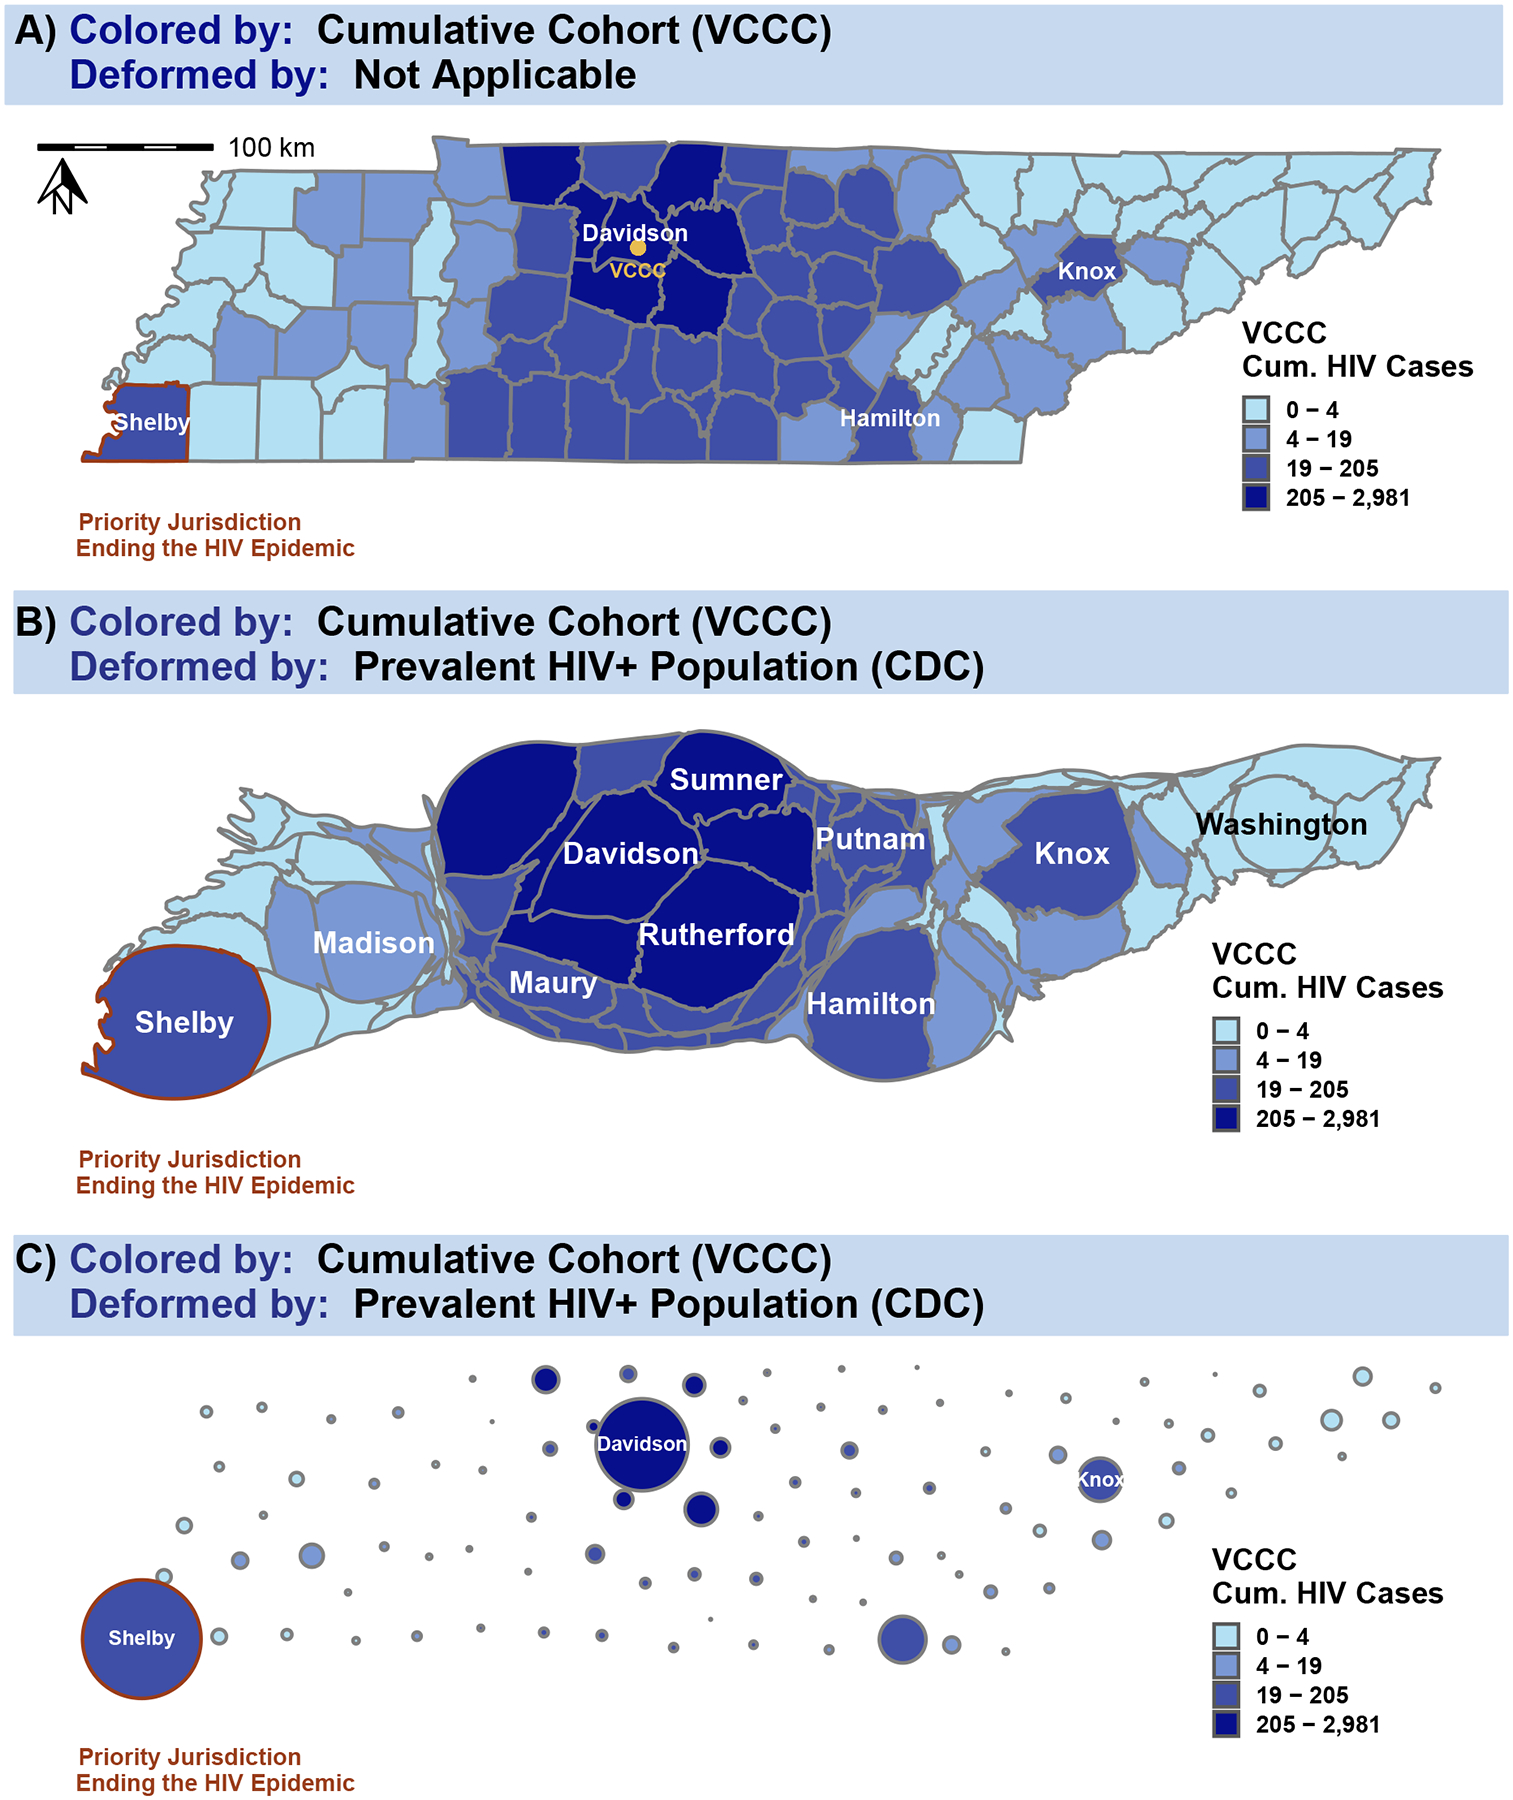
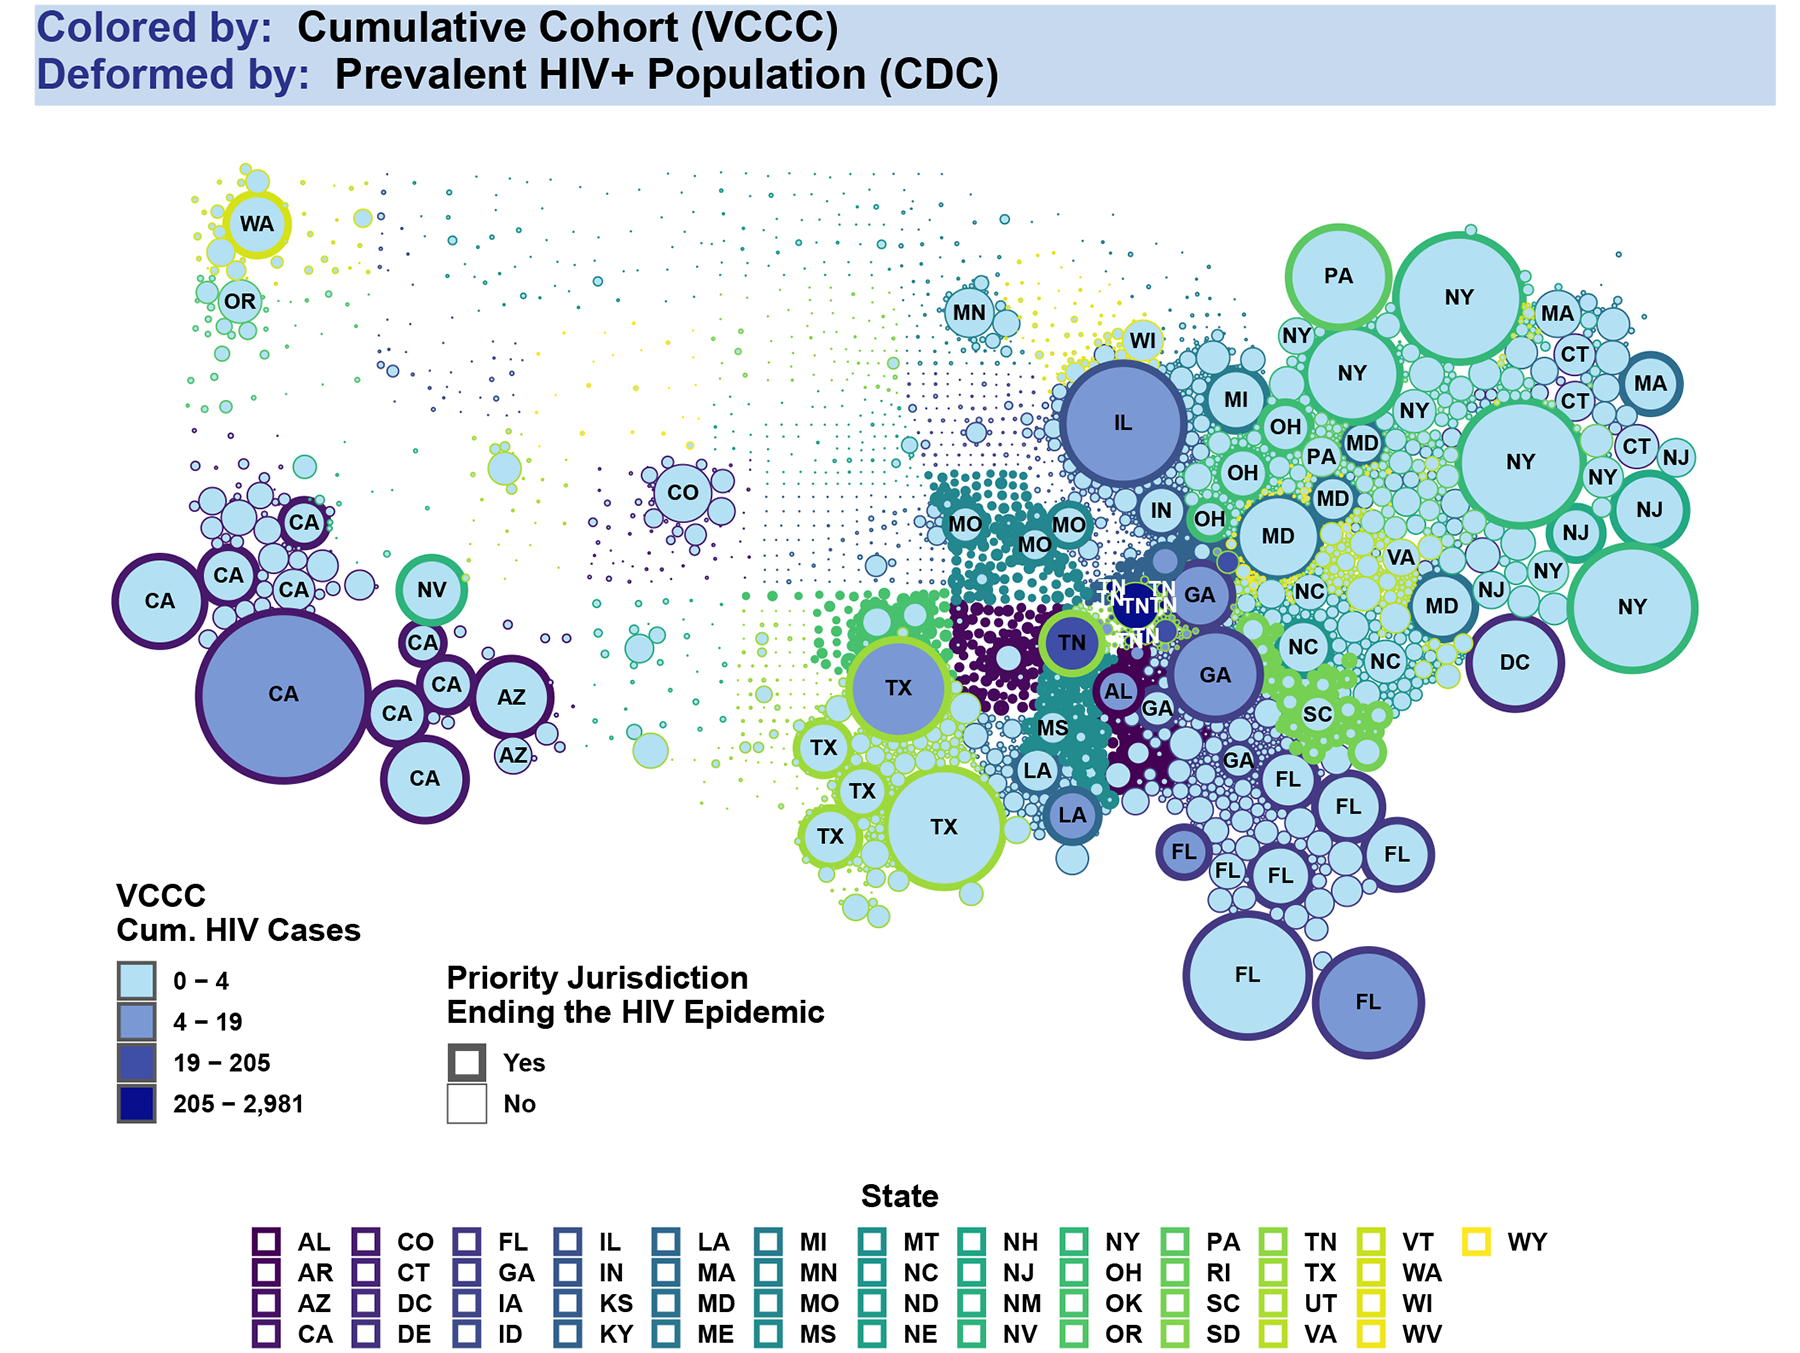
Setting: To illustrate these challenges, we used geographic data from adult PWH at the Vanderbilt Comprehensive Care Clinic (VCCC) in Nashville, Tennessee, and aggregated data from the North American AIDS Cohort Collaboration on Research and Design (NA-ACCORD) from 1998 to 2015.
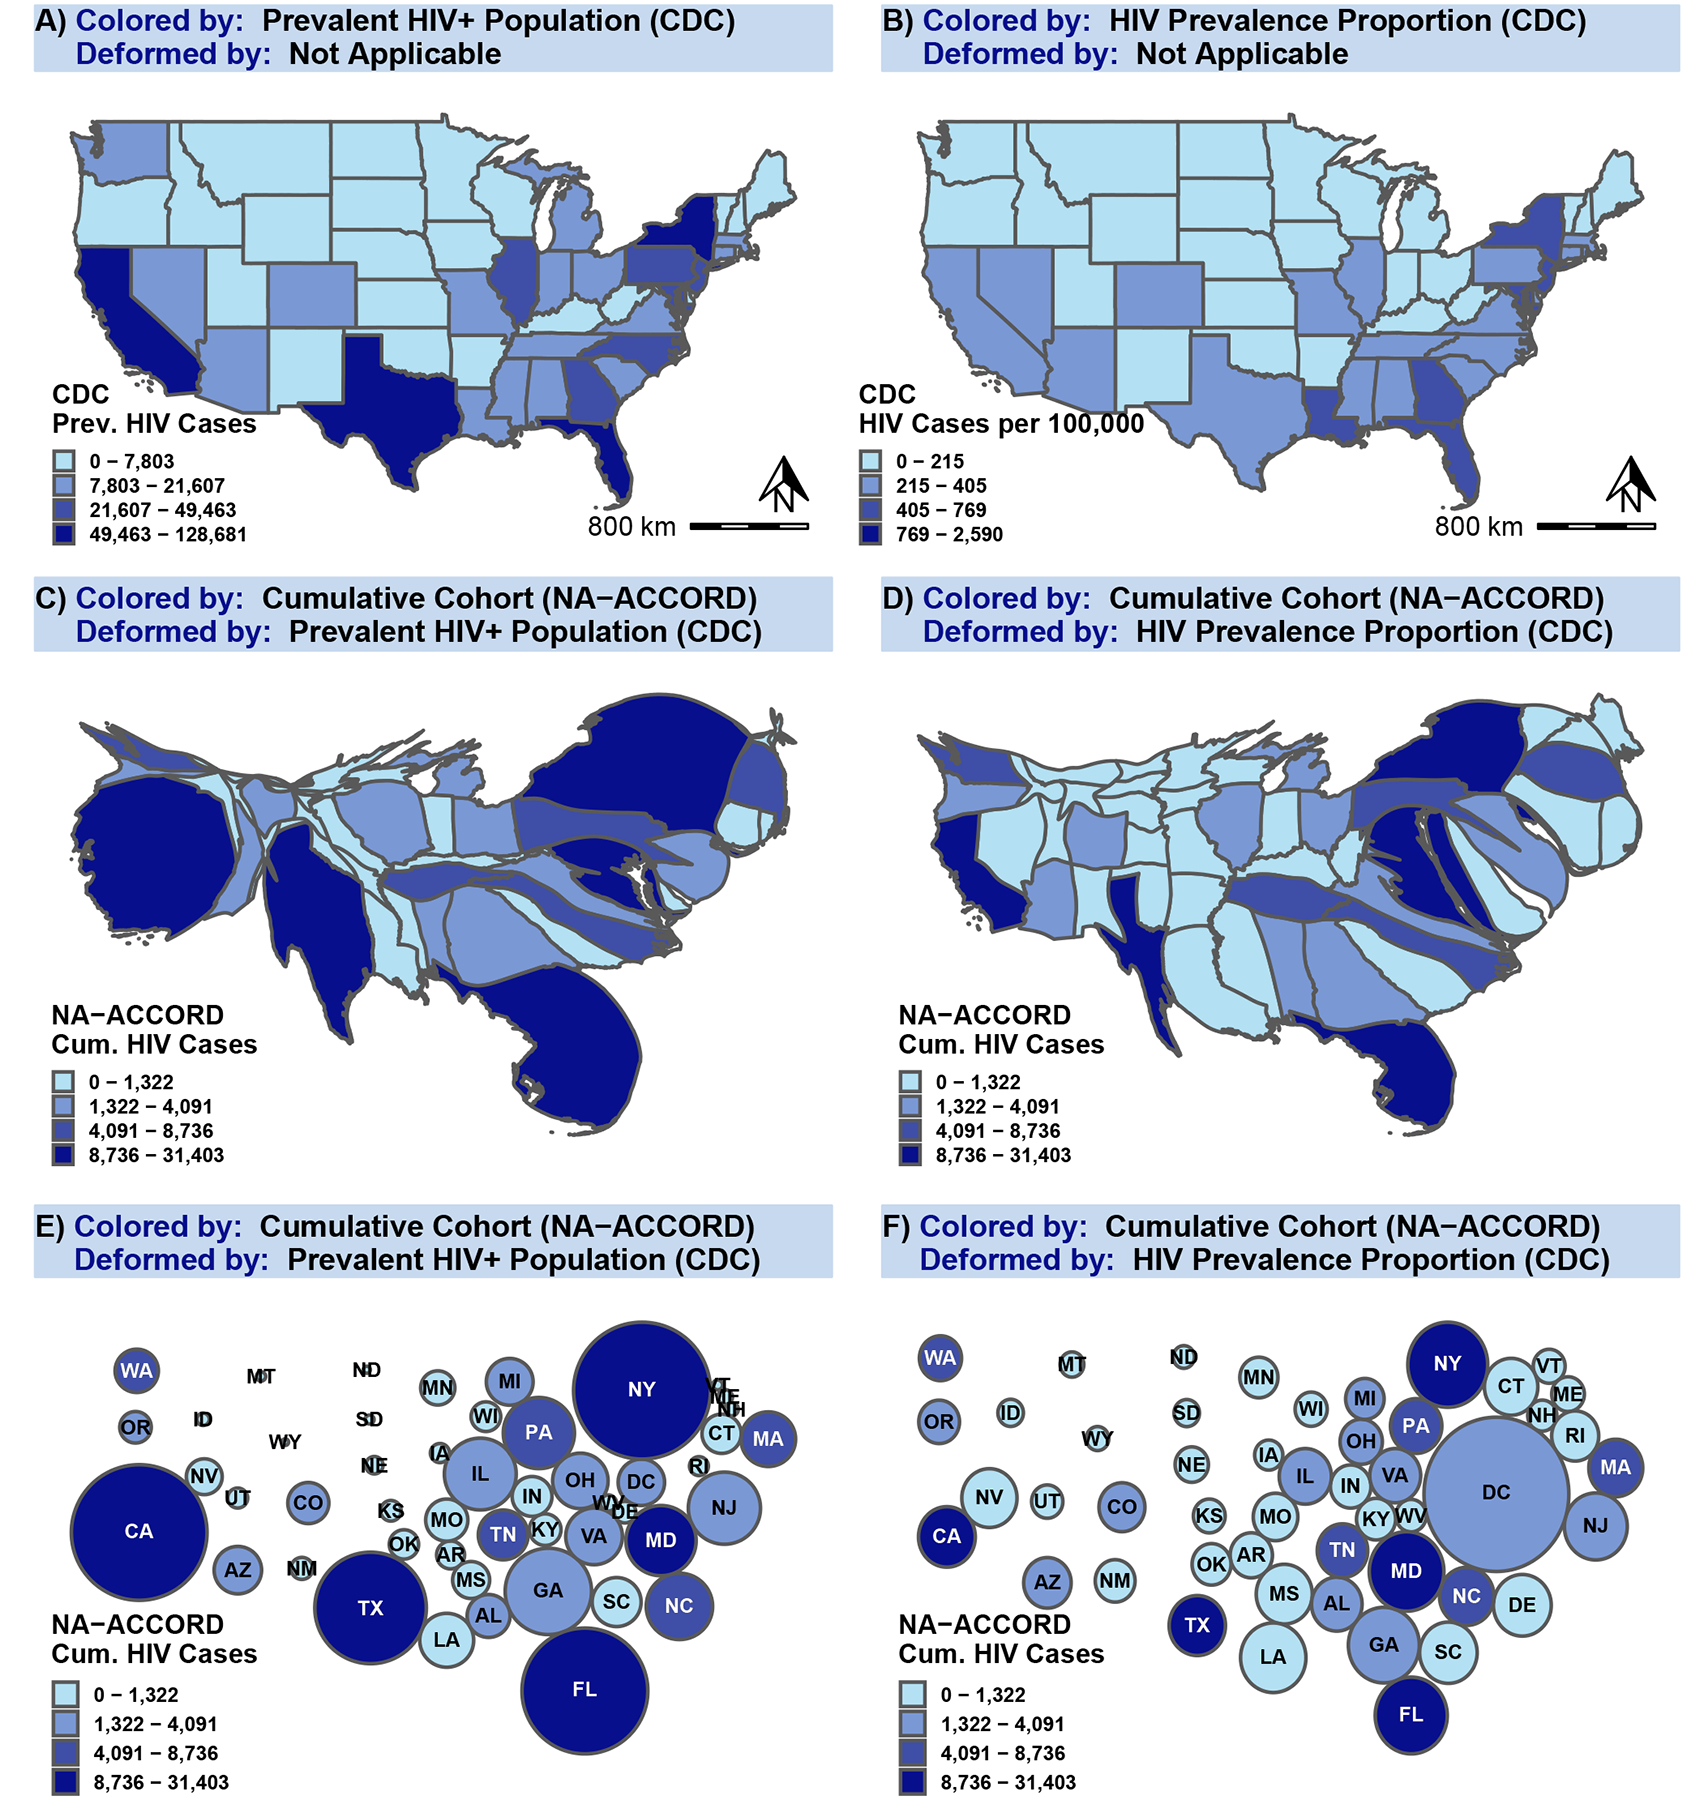
Methods: We compared choropleth maps that use differential shading of political/geographic boundaries with density-adjusted cartograms that allow for shading and deformed boundaries according to a variable of interest, such as PWH.
Results: Cartograms enlarged high-burden areas and shrank low-burden areas of PWH, improving visual interpretation of where to focus HIV prevention and mitigation efforts, when compared with choropleth maps. Cartograms may also demonstrate cohort representativeness of underlying populations (eg, Tennessee for VCCC or the United States for NA-ACCORD), which can guide efforts to assess external validity and improve generalizability.
Conclusion: Choropleth maps and cartograms offer powerful visual evidence of the geographic distribution of HIV disease and cohort representation and should be used to guide targeted public health interventions.
Copyright © 2021 Wolters Kluwer Health, Inc. All rights reserved.
Figures
References
-
- Koch T, Denike K. Medical mapping: The revolution in teachingand usingmaps for the analysis of medical issues. Journal of Geography. 2004;103(2):76–85.
-
- Tran NK, Goldstein ND. JOINTLY REPRESENTING GEOGRAPHIC EXPOSURE AND OUTCOME DATA USING CARTOGRAMS. Am J Epidemiol. 2019. Sep 1;188(9):1751–1752. - PubMed
Publication types
MeSH terms
Grants and funding
- K23 EY013707/EY/NEI NIH HHS/United States
- U54 GM133807/GM/NIGMS NIH HHS/United States
- U01 AI038855/AI/NIAID NIH HHS/United States
- UL1 RR024131/RR/NCRR NIH HHS/United States
- UM1 AI068634/AI/NIAID NIH HHS/United States
- U01 AA020790/AA/NIAAA NIH HHS/United States
- KL2 TR000421/TR/NCATS NIH HHS/United States
- K01 AI131895/AI/NIAID NIH HHS/United States
- F31 DA037788/DA/NIDA NIH HHS/United States
- U01 HL146241/HL/NHLBI NIH HHS/United States
- R01 AA016893/AA/NIAAA NIH HHS/United States
- N01 CP001004/CP/NCI NIH HHS/United States
- P30 AI027767/AI/NIAID NIH HHS/United States
- U01 DA036297/DA/NIDA NIH HHS/United States
- Z01 CP010121/ImNIH/Intramural NIH HHS/United States
- P30 AI050409/AI/NIAID NIH HHS/United States
- U01 HL146333/HL/NHLBI NIH HHS/United States
- F31 AI124794/AI/NIAID NIH HHS/United States
- P30 MH062246/MH/NIMH NIH HHS/United States
- U01 AI069434/AI/NIAID NIH HHS/United States
- P01 AA029545/AA/NIAAA NIH HHS/United States
- R01 DA011602/DA/NIDA NIH HHS/United States
- Z01 CP010176/ImNIH/Intramural NIH HHS/United States
- U54 AG062334/AG/NIA NIH HHS/United States
- P30 AI094189/AI/NIAID NIH HHS/United States
- U01 HL146245/HL/NHLBI NIH HHS/United States
- UM1 AI069432/AI/NIAID NIH HHS/United States
- G12 MD007583/MD/NIMHD NIH HHS/United States
- K24 DA000432/DA/NIDA NIH HHS/United States
- U01 HL146205/HL/NHLBI NIH HHS/United States
- U01 DA036935/DA/NIDA NIH HHS/United States
- U01 HL146208/HL/NHLBI NIH HHS/United States
- U54 MD007587/MD/NIMHD NIH HHS/United States
- R01 MH113438/MH/NIMH NIH HHS/United States
- U01 HL146192/HL/NHLBI NIH HHS/United States
- R24 AI067039/AI/NIAID NIH HHS/United States
- U01 HL146242/HL/NHLBI NIH HHS/United States
- CIHR/Canada
- U01 AI069432/AI/NIAID NIH HHS/United States
- U01 AI038858/AI/NIAID NIH HHS/United States
- U10 EY008057/EY/NEI NIH HHS/United States
- U01 AI068636/AI/NIAID NIH HHS/United States
- U01 HL146201/HL/NHLBI NIH HHS/United States
- R21 AG059505/AG/NIA NIH HHS/United States
- T32 GM007347/GM/NIGMS NIH HHS/United States
- U01 HL146193/HL/NHLBI NIH HHS/United States
- U10 EY008052/EY/NEI NIH HHS/United States
- P30 AI110527/AI/NIAID NIH HHS/United States
- P30 AI027763/AI/NIAID NIH HHS/United States
- K01 AI093197/AI/NIAID NIH HHS/United States
- U01 AI069918/AI/NIAID NIH HHS/United States
- K24 AI118591/AI/NIAID NIH HHS/United States
- K24 AI065298/AI/NIAID NIH HHS/United States
- U01 AA013566/AA/NIAAA NIH HHS/United States
- T32 GM152284/GM/NIGMS NIH HHS/United States
- N02 CP055504/CP/NCI NIH HHS/United States
- UL1 TR000083/TR/NCATS NIH HHS/United States
- P30 AI027757/AI/NIAID NIH HHS/United States
- U01 HL146204/HL/NHLBI NIH HHS/United States
- F30 MH123219/MH/NIMH NIH HHS/United States
- R01 DA012568/DA/NIDA NIH HHS/United States
- U01 HL146202/HL/NHLBI NIH HHS/United States
- UL1 TR000004/TR/NCATS NIH HHS/United States
- U01 HL146240/HL/NHLBI NIH HHS/United States
- R01 AG053100/AG/NIA NIH HHS/United States
- U10 EY008067/EY/NEI NIH HHS/United States
- P30 AI036219/AI/NIAID NIH HHS/United States
- U01 HL146194/HL/NHLBI NIH HHS/United States
- U24 AA020794/AA/NIAAA NIH HHS/United States
- U01 HL146203/HL/NHLBI NIH HHS/United States
- U01 AI068634/AI/NIAID NIH HHS/United States
- P30 AI050410/AI/NIAID NIH HHS/United States
LinkOut - more resources
Full Text Sources
Medical
