. 2022 Feb;29(2):293-305.
doi: 10.1038/s41418-021-00914-9. Epub 2022 Jan 1.

The evolutionary history of the polyQ tract in huntingtin sheds light on its functional pro-neural activities

Affiliations

The evolutionary history of the polyQ tract in huntingtin sheds light on its functional pro-neural activities

Raffaele Iennaco et al. Cell Death Differ. 2022 Feb.

Abstract

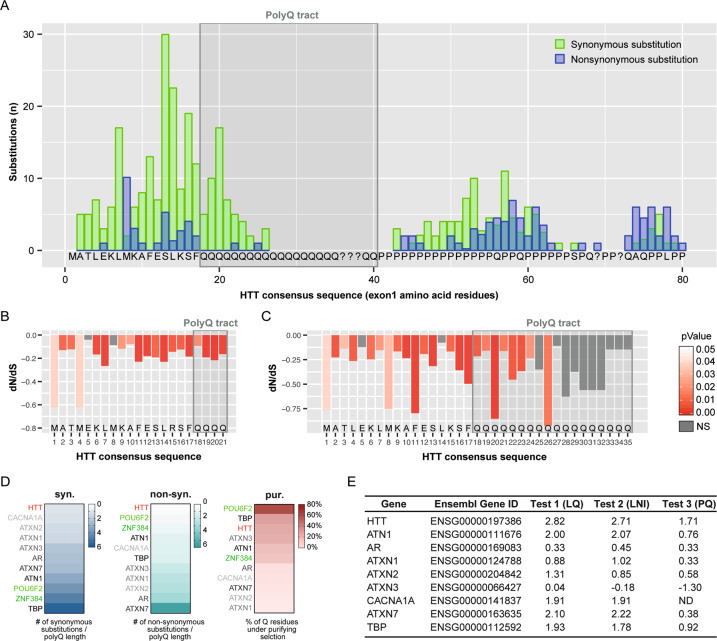
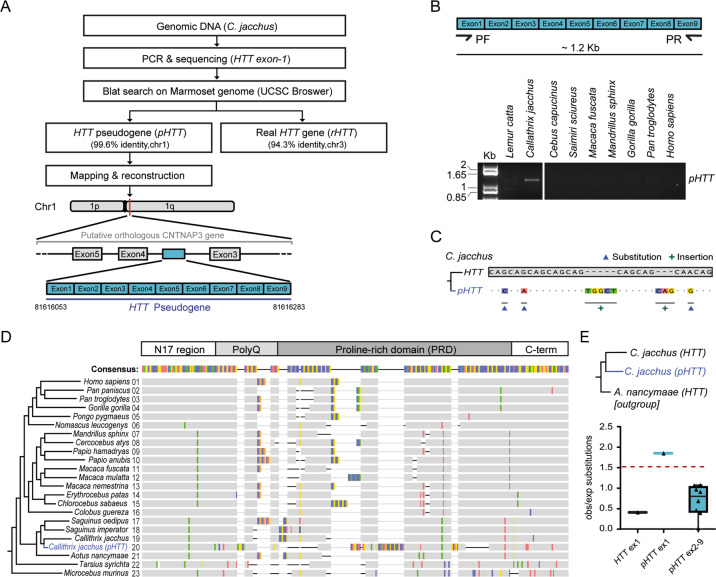
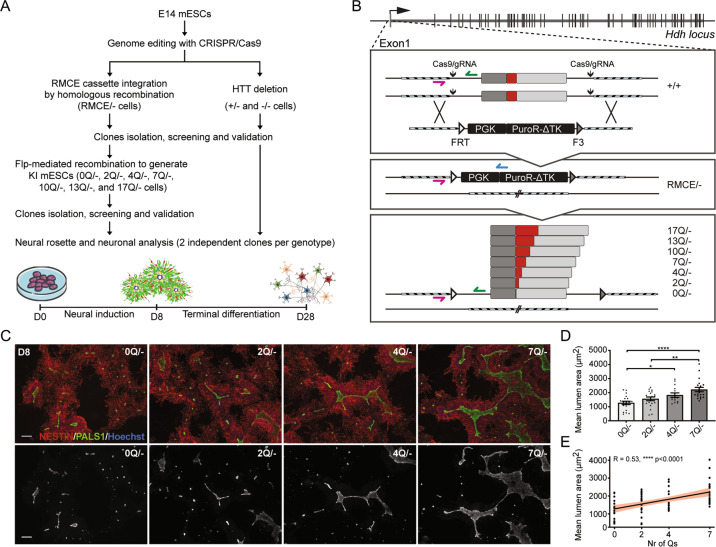
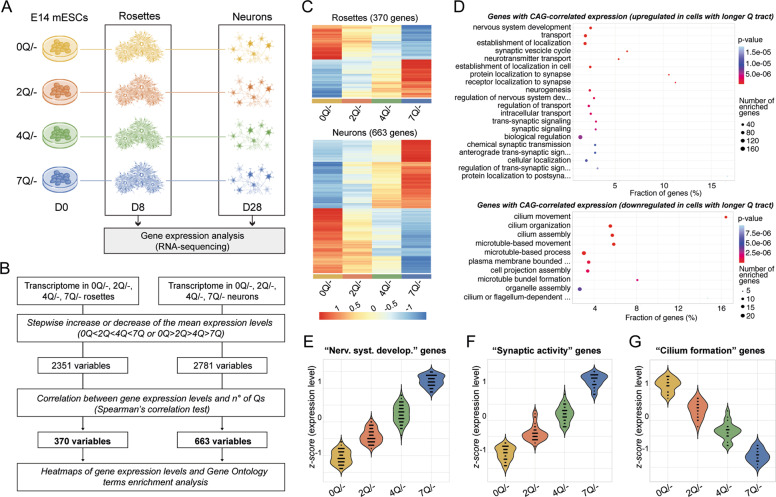
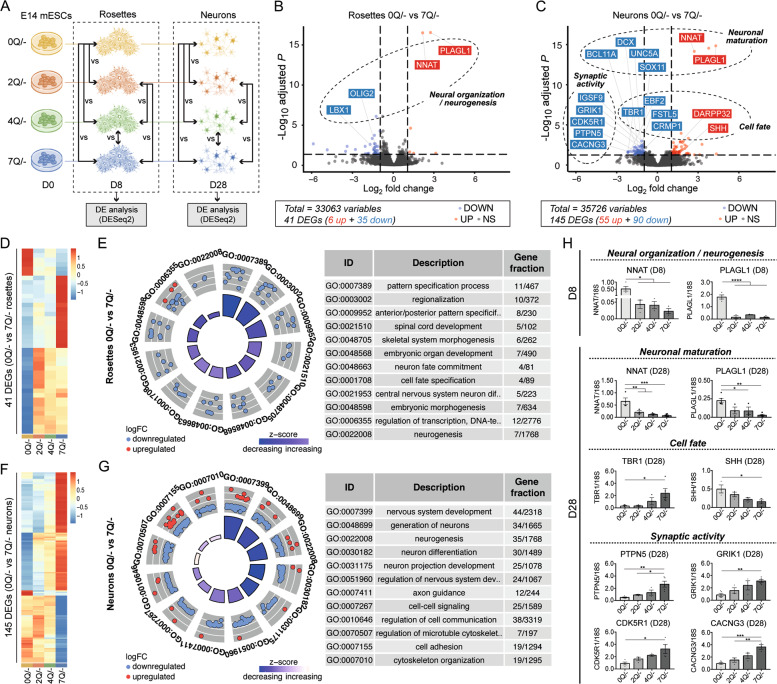
Huntington's disease is caused by a pathologically long (>35) CAG repeat located in the first exon of the Huntingtin gene (HTT). While pathologically expanded CAG repeats are the focus of extensive investigations, non-pathogenic CAG tracts in protein-coding genes are less well characterized. Here, we investigated the function and evolution of the physiological CAG tract in the HTT gene. We show that the poly-glutamine (polyQ) tract encoded by CAGs in the huntingtin protein (HTT) is under purifying selection and subjected to stronger selective pressures than CAG-encoded polyQ tracts in other proteins. For natural selection to operate, the polyQ must perform a function. By combining genome-edited mouse embryonic stem cells and cell assays, we show that small variations in HTT polyQ lengths significantly correlate with cells' neurogenic potential and with changes in the gene transcription network governing neuronal function. We conclude that during evolution natural selection promotes the conservation and purity of the CAG-encoded polyQ tract and that small increases in its physiological length influence neural functions of HTT. We propose that these changes in HTT polyQ length contribute to evolutionary fitness including potentially to the development of a more complex nervous system.


Conflict of interest statement

The authors declare no competing interests.

Figures

Fig. 1
Fig. 1. Effects of natural selection on HTT exon1.
A Synonymous and non-synonymous substitutions counted with the codon-based maximum likelihood method SLAC on the multiple alignment of 163 unique, non-redundant sequences from vertebrates (n = 158), and basal species (n = 5). A time-tree was used as backbone for calculations. Synonymous (green) and non-synonymous (blue) substitution counts are shown for each codon (consensus sequence in the plot); the gray shaded box highlights the polyQ tract. B dN/dS ratios determined by FUBAR method for the multiple sequence alignment (MSA) subset of bony fishes, turtles, crocodiles, and birds (n = 84 species) where four glutamine-encoding codons can be unambiguously aligned. Consensus sequence of HTT exon1 is shown for reference; the gray shaded box highlights the polyQ (4Q) tract. C dN/dS ratios determined by FUBAR method for the MSA of mammals (Q ≥ 4, n = 74 species), where the number of Q encoding codons is variable. HTT N-terminal consensus sequence is shown for reference. The gray shaded box highlights the polyQ (Q ≥ 4) tract. The orientation of peaks in plots B and C indicates the direction of selection (downward = purifying/negative; upward = diversifying/positive); peaks height indicates the strength of selection (dN/dS values) and peak’s color (shades of red) shows the statistical significance level. D Heatmaps showing comparison of the polyQ stretch conservations for nine polyQ disease-associated genes (HTT in red, others in gray scale) and two genes not associated with any type of diseases (POU6F2 and ZNF384, green) across taxa. The heatmaps display the value of synonymous substitutions over Q length ratio (syn.), the value of non-synonymous substitutions over Q length ratio (non-syn.) and the fraction of Q residues under significative purifying selection (pur.). E Table showing the comparative analysis of the disease-associated polyQ proteins. Z-score values for the longest Q stretch (LQ), for the longest non-interrupted CAG interval (LNI) and for the CAG/CAA proportion (PQ) of the nine human disease-associated genes, extracted from the results of the three analyses (test 1, 2, and 3) described in Fig. S6B–D.
Fig. 2
Fig. 2. HTT gene and pseudogene comparison in Callithrix jacchus.
A Schematic pipeline of pHTT identification. B PCR analysis of pHTT in primates. See Supplementary dataset S24 for raw gel image. C Variations observed in the CAG/CAA tract of pHTT analysed as compared to the CAG/CAA tract of the Callithrix jacchus HTT gene: G → C, G → A, A → G substitutions (▲); TGGCT and CAG insertions (+). D Graphical representation of the differences (substitutions and indels; highlighted with colors) between the HTT orthologous exons1 in primates (1–19 and 21–23; corresponding to black branches in the tree) and the pHTT of Callithrix jacchus (20; blue branch) as compared to the consensus sequence. E Comparison of HTT exon1 and pHTT exons1–9 instability of Callithrix jacchus measured as the ratio of number of substitutions observed and expected (relative to number on amino acids per exon) with respect to the outgroup HTT sequence (Aotus nancymaae). Dots (triangles) represent the ratio of observed on expected (obs/exp) substitutions per exon.
Fig. 3
Fig. 3. PolyQ tract impacts the formation of neural structures.
A Pipeline for the generation and characterization of HTT knock-in and knock-out E14 mESCs. B Genome editing strategy used to produce knock-in mESCs. CRISPR/Cas9 with two gRNAs, was used to insert the RMCE cassette replacing the exon1 on one allele and to delete HTT exon1 on the other allele, thus generating the RMCE/− cell line. The RMCE cassette contains the positive/negative selectable marker PuroR-ΔTK, under PGK promoter, flanked by FRT and F3 recombination sites, which were used to direct the integration of modified exons 1 with 0, 2, 4, 7, 10, 13, and 17 Q repeats by Flp recombinase. gRNAs and oligos sequences are reported in Supplementary dataset S23. C Representative images of rosette/lumen phenotype in 0Q/−, 2Q/−, 4Q/−, and 7Q/− cells stained for PALS1 and NESTIN at day 8 of neural induction. D Mean lumen area (μm2) of 0Q/−, 2Q/−, 4Q/−, and 7Q/− cell cultures. *P < 0.05, **P < 0.01, ****P < 0.0001, one-way ANOVA test followed by Tukey. E Linear regression analysis and confidence interval between Q length and lumen size in 0Q/−, 2Q/−, 4Q/−, and 7Q/− cell cultures. Pearson correlation coefficients (R) and P-values are reported on the plots. Data in D and E are expressed as mean ± SEM from n ≥ 4 independent experiments. Each dot represents the mean lumen area per well testing a pool of two clones for each edited cell line (see Supplementary dataset S25 for raw data). The scale bars correspond to 50 μm.
Fig. 4
Fig. 4. PolyQ length-sensitive influence in transcriptional programs governing in vitro neuronal differentiation.
A Experimental scheme of gene expression analysis by RNA-seq at rosette and neuron stage among 0, 2, 4, and 7Q cell lines. B Schematic pipeline of whole transcriptomics-based analysis designed to identify genes whose expression increase or decrease stepwise (0Q > 2Q > 4Q > 7Q or 0Q < 2Q < 4Q < 7Q) and linearly (Spearman’s correlation) with CAG-length in 0, 2, 4, and 7Q transcriptomes. C Heatmaps of the expression levels for genes identified applying the pipeline depicted in B. The data was normalized and scaled. D GO dot plots of the top significant GO terms (ranked on their p-value from a classic Fisher test) of the genes, identified in B, which are upregulated (upper panel) or downregulated (bottom panel) in neurons with increasing number of Qs. For the full lists of DEGs see Supplementary dataset S21. EG Violin plots of genes from B showing significant Q length-correlated expression selected for nervous system development (GO:0007399 term) (E), synaptic activity (GO:0099537, GO:0050808, GO:0035418 terms) (F) or cilium formation processes (GO:0060271 and GO:0044782 terms) (G) in 0Q, 2Q, 4Q, and 7Q neurons. Each dot represents the z-score value for each gene (z-score values were calculated by subtracting the population mean of expression levels from the sample mean of the raw expression levels and, then, dividing by the population standard deviation).
Fig. 5
Fig. 5. RNA-seq analyses reveal the HTT polyQ-related molecular pathways underlying different signatures in the early-to-late generation of neurons among 0, 2, 4 and 7Q cell lines.
A Experimental scheme of gene expression analysis by RNAseq in which pairwise comparisons at rosette and neuron stage among 0, 2, 4, and 7Q (E14) cell lines were performed. B, C Volcano plots of DEGs between 0Q vs. 7Q at rosettes (B) and neuron (C) stage. Significant DEGs (adjusted P-value < 0.05) are labeled in red (for up-regulation with logFC > 1) or blue (for down-regulation with logFC < −1). The classes of genes subsequently validated by qPCR analysis are reported on the plot. D Heatmap of gene expression levels for significant DEGs between 0Q vs. 7Q rosettes (41 genes). The data was normalized and scaled. E Gene-ontology (GO) circle plot displaying the top significant (ranked on their P-value) non-redundant GO terms of the DEGs between rosettes 0Q vs. 7Q. Within each selected GO term the outer chart shows the distribution of the logFC of the individual assigned genes from higher (outer layer) to lower (inner layer). Genes are represented as red (upregulated) and blue (downregulated) circles. The height of the inner bars represents the P-value of the GO term whereas its color indicates the z-score (see “Methods” section). F Heatmap of gene expression levels for significant DEGs between 0Q vs. 7Q neurons (145 genes). The data was normalized and scaled. G GO circle plot displaying the top significant (ranked on their P-value) non-redundant GO terms of the DEGs between neurons 0Q vs. 7Q. For the details of the plot see E. H qPCR validation analyses of significant DEGs between 0Q vs. 7Q cell lines at rosette (D8) and neuron (D28) stage. Bar plots display the mean values ± SEM from n ≥ 3 biological replicates; *P < 0.05, **P < 0.01, ***P < 0.001, ****P < 0.0001, one-way ANOVA test followed by Tukey. Values of the logFCs are scaled. For the full lists of DEGs see Supplementary dataset S21.

Comment in

Similar articles

Cited by

References

    1. Reiner A, Albin RL, Anderson KD, D’Amato CJ, Penney JB, Young AB. Differential loss of striatal projection neurons in Huntington disease. Proc Natl Acad Sci USA. 1988;85:5733–7. - PMC - PubMed
    1. O'Donovan, MC. A novel gene containing a trinucleotide repeat that is expanded and unstable on Huntington’s disease chromosomes. The Huntington’s Disease Collaborative Research Group. Cell. 1993;72:971–83. - PubMed
    1. Rosas HD, Salat DH, Lee SY, Zaleta AK, Pappu V, Fischl B, et al. Cerebral cortex and the clinical expression of Huntington’s disease: complexity and heterogeneity. Brain. 2008;131:1057–68. - PMC - PubMed
    1. Davies SW, Turmaine M, Cozens BA, DiFiglia M, Sharp AH, Ross CA, et al. Formation of neuronal intranuclear inclusions underlies the neurological dysfunction in mice transgenic for the HD mutation. Cell. 1997;90:537–48. - PubMed
    1. Bañez-Coronel M, Porta S, Kagerbauer B, Mateu-Huertas E, Pantano L, Ferrer I, et al. A pathogenic mechanism in Huntington’s disease involves small CAG-repeated RNAs with neurotoxic activity. PLoS Genet. 2012;8:e1002481. - PMC - PubMed

Publication types