. 2022 Apr;29(4):861-873.
doi: 10.1038/s41418-021-00901-0. Epub 2022 Jan 1.

O-GlcNAcylation of MORC2 at threonine 556 by OGT couples TGF-β signaling to breast cancer progression

Affiliations

O-GlcNAcylation of MORC2 at threonine 556 by OGT couples TGF-β signaling to breast cancer progression

Ying-Ying Liu et al. Cell Death Differ. 2022 Apr.

Abstract

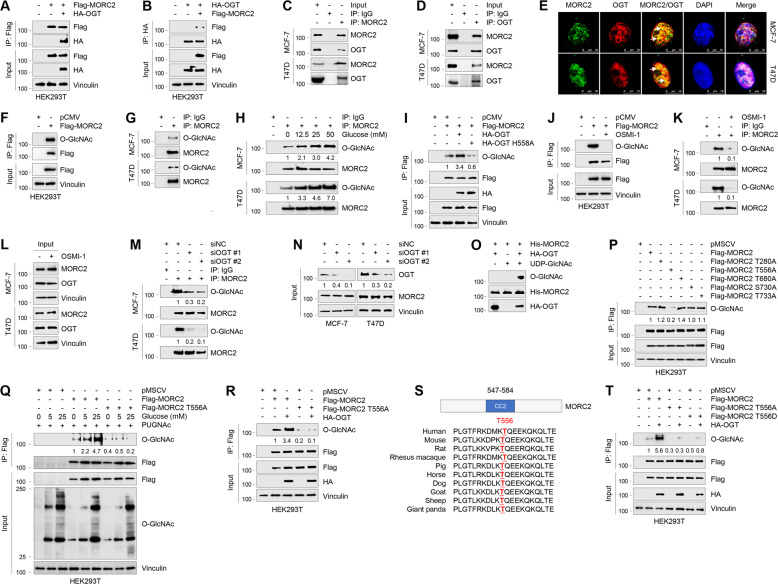
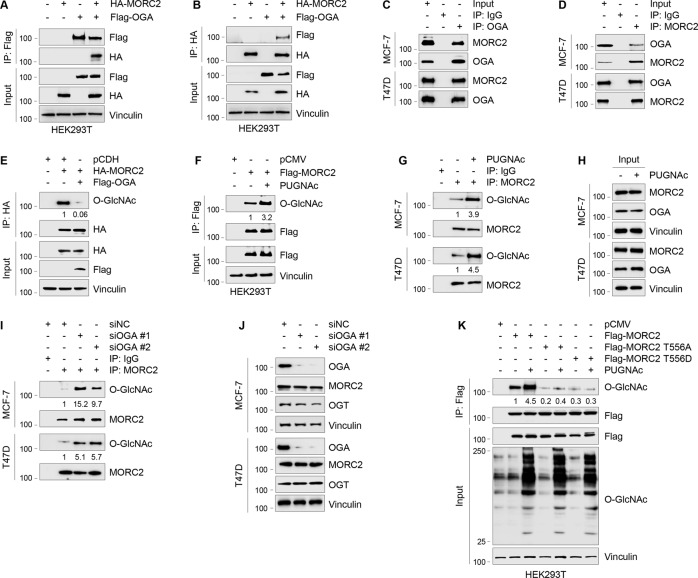
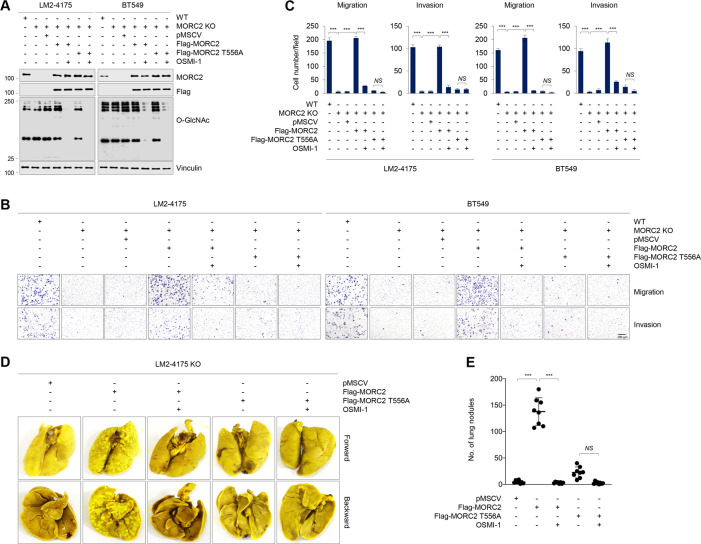
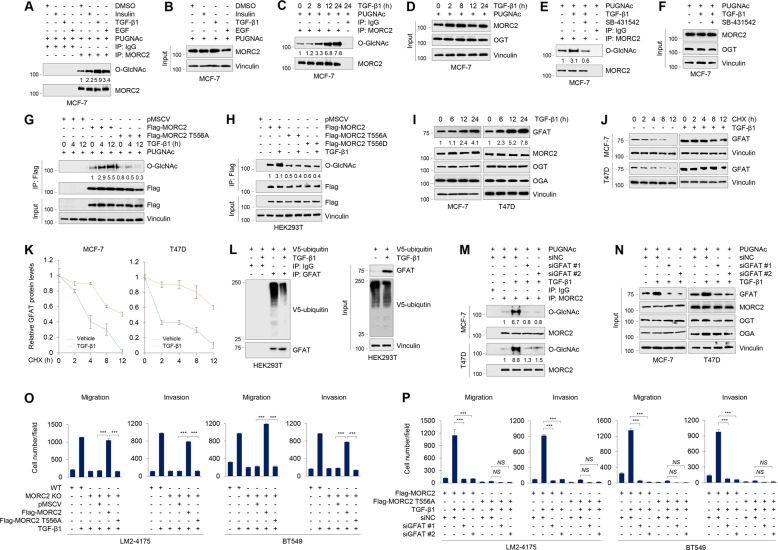
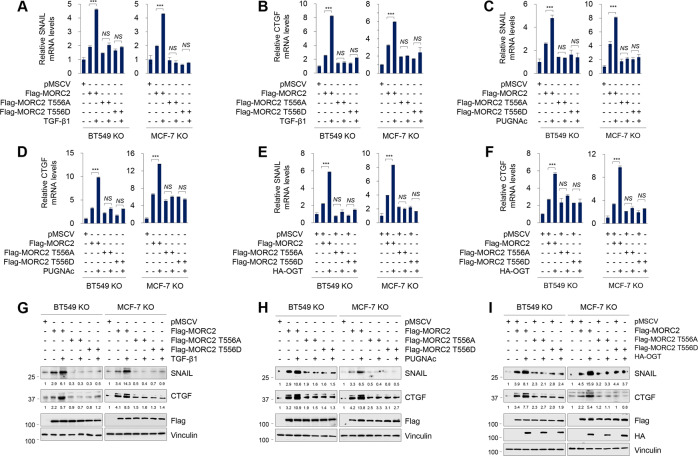
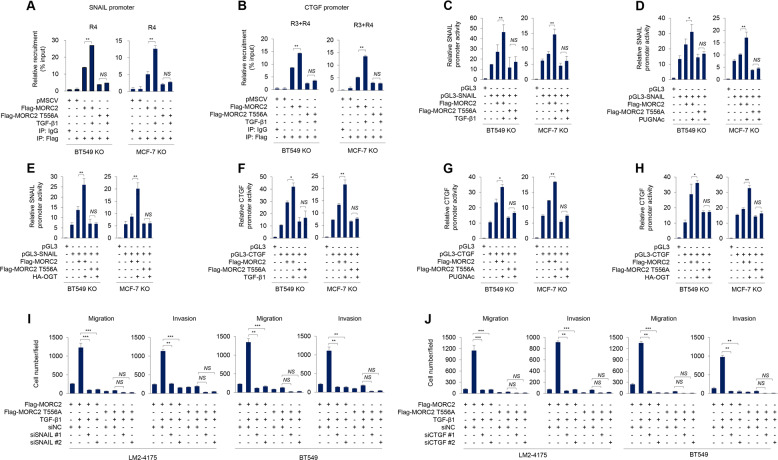
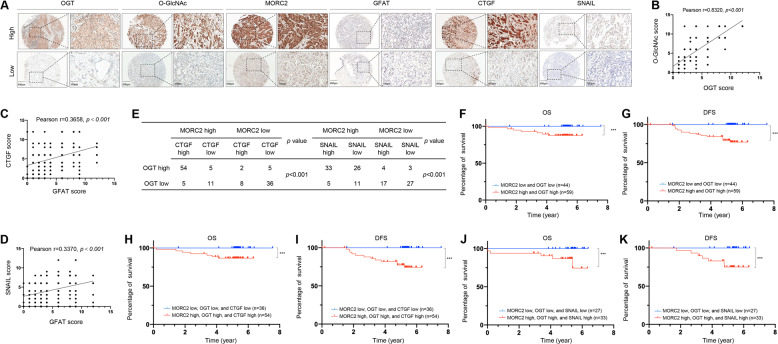
MORC family CW-type zinc finger 2 (MORC2) is a newly identified chromatin-remodeling enzyme involved in DNA damage response and gene transcription, and its dysregulation has been linked with Charcot-Marie-Tooth disease, neurodevelopmental disorder, and cancer. Despite its functional importance, how MORC2 is regulated remains enigmatic. Here, we report that MORC2 is O-GlcNAcylated by O-GlcNAc transferase (OGT) at threonine 556. Mutation of this site or pharmacological inhibition of OGT impairs MORC2-mediated breast cancer cell migration and invasion in vitro and lung colonization in vivo. Moreover, transforming growth factor-β1 (TGF-β1) induces MORC2 O-GlcNAcylation through enhancing the stability of glutamine-fructose-6-phosphate aminotransferase (GFAT), the rate-limiting enzyme for producing the sugar donor for OGT. O-GlcNAcylated MORC2 is required for transcriptional activation of TGF-β1 target genes connective tissue growth factor (CTGF) and snail family transcriptional repressor 1 (SNAIL). In support of these observations, knockdown of GFAT, SNAIL or CTGF compromises TGF-β1-induced, MORC2 O-GlcNAcylation-mediated breast cancer cell migration and invasion. Clinically, high expression of OGT, MORC2, SNAIL, and CTGF in breast tumors is associated with poor patient prognosis. Collectively, these findings uncover a previously unrecognized mechanistic role for MORC2 O-GlcNAcylation in breast cancer progression and provide evidence for targeting MORC2-dependent breast cancer through blocking its O-GlcNAcylation.


Conflict of interest statement

The authors declare no competing interests.

Figures

Fig. 1
Fig. 1. OGT interacts with MORC2 and O-GlcNAcylates MORC2 at T556.
A, B HEK293T cells were transfected with Flag-MORC2 and HA-OGT alone or in combination. IP and immunoblotting analyses were performed with the indicated antibodies after 48 h of transfection. C, D Lysates from MCF-7 and T47D cells were subjected to IP and immunoblotting analysis with the indicated antibodies. E Immunofluorescence staining of MORC2 and OGT in MCF-7 and T47D cells. Cell nucleus was counterstained with DAPI. F HEK293T cells were transfected with pCMV or Flag-MORC2. IP and immunoblotting analyses were performed with the indicated antibodies after 48 h of transfection. G Lysates from MCF-7 and T47D cells were subjected to IP and immunoblotting analysis with the indicated antibodies. H MCF-7 and T47D cells were cultured in glucose- and serum-free medium for 24 h, and treated with increasing doses of glucose for 24 h. IP and immunoblotting analyses were performed with the indicated antibodies. O-GlcNAc levels were normalized to levels of immunoprecipitated MORC2. The input concerning this experiment is shown in Supplementary Fig. S1F. I HEK293T cells were transfected with Flag-MORC2, HA-OGT or HA-OGT H558A alone or in combination. After 48 h of transfection, cells were subjected to IP and immunoblotting analysis. O-GlcNAc levels were normalized to levels of immunoprecipitated Flag-MORC2. J HEK293T cells transfected with pCMV or Flag-MORC2 were treated with or without 50 μM OSMI-1 for 24 h, and then subjected to IP and immunoblotting analyses with the indicated antibodies. K, L MCF-7 and T47D cells were treated with or without 50 μM OSMI-1 for 24 h and subjected to IP and immunoblotting analyses with the indicated antibodies. In K, O-GlcNAc levels were normalized to levels of immunoprecipitated MORC2. M, N MCF-7 and T47D cells were transfected with negative control siRNA (siNC) or two independent siRNAs targeting OGT (siOGT). After 48 h of transfection, cells were subjected to IP and immunoblotting analysis with the indicated antibodies. O-GlcNAc levels were normalized to levels of immunoprecipitated MORC2 (M), and OGT levels were normalized to those of Vinculin (N). O HA-OGT was purified from HEK293T transfected with HA-OGT. Purified His-MORC2 were incubated with HA-OGT in reaction buffer in a final volume of 25 μl per sample. The samples were incubated at 37 °C for 24 h. MORC2 O-GlcNAc was detected by immunoblotting with an anti-O-GlcNAc antibody (RL2). P HEK293T cells were transfected with the indicated expression vectors. After 48 h of transfection, cells were subjected to IP and immunoblotting analysis with the indicated antibodies. O-GlcNAc levels were normalized to levels of immunoprecipitated Flag-MORC2. Q HEK293T cells were transfected with the indicated expression vectors. After 24 h of transfection, cells were cultured in glucose- and serum-free medium for 24 h and then treated with increasing doses of glucose for 24 h. IP and immunoblotting analyses were performed with the indicated antibodies. O-GlcNAc levels were normalized to levels of immunoprecipitated Flag-MORC2. R HEK293T cells were transfected with Flag-MORC2 or Flag-MORC2 T556A alone or in combination with HA-OGT. After 48 h of transfection, cells were subjected to IP and immunoblotting analysis. O-GlcNAc levels were normalized to levels of immunoprecipitated Flag-MORC2. S Alignment of OGT protein sequence among different species. T HEK293T cells were transfected with Flag-MORC2 (WT, T556A, or T556D) alone or in combination with HA-OGT. After 48 h of transfection, cells were subjected to IP and immunoblotting analysis. O-GlcNAc levels were normalized to levels of immunoprecipitated Flag-MORC2.
Fig. 2
Fig. 2. OGA interacts with MORC2 and de-O-GlcNAcylates MORC2 at T556.
A, B HEK293T cells were transfected with HA-MORC2 and Flag-OGA alone or in combination. IP and immunoblotting analysis were performed with the indicated antibodies after 48 h of transfection. C, D Lysates from MCF-7 and T47D cells were subjected to IP and immunoblotting analysis with the indicated antibodies. E HEK293T cells were transfected with Flag-OGA and HA-MORC2 alone or in combination. IP and immunoblotting analysis were performed with the indicated antibodies after 48 h of transfection. O-GlcNAc levels were normalized to levels of immunoprecipitated HA-MORC2. F HEK293T cells transfected with pCMV or Flag-MORC2 were treated with or without 20 μM PUGNAc for 24 h and subjected to IP and immunoblotting analyses with the indicated antibodies. O-GlcNAc levels were normalized to levels of immunoprecipitated Flag-MORC2. G, H MCF-7 and T47D cells were treated with or without 20 μM PUGNAc for 24 h and subjected to IP and immunoblotting analyses with the indicated antibodies. O-GlcNAc levels were normalized to levels of immunoprecipitated MORC2. I, J MCF-7 and T47D cells were transfected with siNC or two different siRNAs targeting OGA (siOGA). After 48 h of transfection, cells were subjected to IP and immunoblotting analysis with the indicated antibodies. In I, O-GlcNAc levels were normalized to levels of immunoprecipitated MORC2. K HEK293T cells were transfected with the indicated expression vectors. After 24 h of transfection, cells were treated with or without 20 μM PUGNAc for 24 h and subjected to IP and immunoblotting analysis. O-GlcNAc levels were normalized to levels of immunoprecipitated Flag-MORC2.
Fig. 3
Fig. 3. O-GlcNAcylated MORC2 contributes to breast cancer progression.
AC WT and MORC2-KO LM2–4175 and BT549 cells stably expressing pMSCV, Flag-MORC2 or Flag-MORC2 T556A were treated with or without 50 μM OSMI-1 for 24 h, and then subjected to immunoblotting analysis with the indicated antibodies (A) or Transwell migration and invasion assays as described in Materials and Methods. Representative images of migrated and invaded cells (B) and corresponding quantitative results (C) are shown. ***, p < 0.001; NS, no significance. D, E WT and MORC2-KO LM2–4175 and BT549 cells stably expressing pMSCV, Flag-MORC2 or Flag-MORC2 T556A were injected into 6-week-old female BALB/c nude mice (n = 8) through the tail vein. OSMI-1 treatment was started 1 week after injection. OSMI-1 was given at a dose of 10 mg/kg/day for four weeks, five days a week and two days off at weekends. After 5 weeks of injections, the lungs were harvested. Representative images of lung metastasis (D), and quantitative results of lung nodules (E) are shown. ***, p < 0.001; NS, no significance.
Fig. 4
Fig. 4. TGF-β1 induces MORC2 O-GlcNAcylation at T556 through enhancing GFAT stability.
A, B MCF-7 cells were serum-starved for 24 h and then treated with or without 10 μg/ml insulin, 5 ng/ml TGF-β1, or 20 ng/ml EGF for another 24 h. Cells were harvested for IP and immunoblotting analysis with the indicated antibodies. In A, O-GlcNAc levels were normalized to levels of immunoprecipitated MORC2 levels. C, D MCF-7 cells were serum-starved for 24 h, and then treated with or without 5 ng/ml TGF-β1 for the indicated times. Cell lysates were subjected to IP and immunoblotting analysis with the indicated antibodies. In C, O-GlcNAc levels were normalized to levels of immunoprecipitated MORC2. E, F MCF-7 cells were serum-starved for 24 h, and then treated with 5 ng/ml TGF-β1 (24 h) alone or in combination with 5 μM TGF-β inhibitor SB431542 (12 h). Cells were harvested for IP and immunoblotting analysis with the indicated antibodies. In E, O-GlcNAc levels were normalized to levels of immunoprecipitated MORC2. G, H HEK293T cells were transfected with the indicated expression vectors. After 24 h of transfection, cells were serum-starved for 24 h, followed by treatment with 5 ng/ml TGF-β1 for the indicated times. IP and immunoblotting analysis were performed with the indicated antibodies. In G, O-GlcNAc levels were normalized to levels of immunoprecipitated Flag-MORC2. I MCF-7 and T47D cells were serum-starved for 24 h and then treated with or without 5 ng/ml TGF-β1 for the indicated times. Immunoblotting analyses were performed with the indicated antibodies. GFAT levels were normalized to Vinculin levels. J, K MCF-7 and T47D cells were serum-starved for 24 h and then treated with or without 5 ng/ml TGF-β1 for 24 h. Cells were treated with 100 μg/ml of cycloheximide (CHX) for the indicated times and then analyzed by immunoblotting (J). Relative expression levels of GFAT to Vinculin are shown in (K). L HEK293T cells were transfected with V5-ubiquitin. After 24 h of transfection, cells were serum-starved for 24 h and then treated with or without 5 ng/ml TGF-β1 for another 24 h. IP and immunoblotting analyses were performed with the indicated antibodies. M, N MCF-7 and T47D cells were transfected with siNC or two different siRNAs targeting GFAT (siGFAT). After 24 h of transfection, cells were serum-starved for 24 h and then treated with or without 5 ng/ml TGF-β1 for another 24 h. IP and immunoblotting analyses were performed with the indicated antibodies. In M, O-GlcNAc levels were normalized to levels of immunoprecipitated MORC2. O WT and MORC2-KO LM2–4175 and BT549 cells stably expressing pMSCV, Flag-MORC2 or Flag-MORC2 T556A were serum-starved for 24 h, treated with or without 5 ng/ml TGF-β1 for 24 h, and then subjected to Transwell migration and invasion assays. Corresponding quantitative results are shown in O. ***, p < 0.001. Representative images of migrated and invaded cells are shown in Supplementary Fig. S7D. P MORC2-KO LM2–4175 and BT549 cells stably expressing Flag-MORC2 or Flag-MORC2 T556A were transfected with siNC or two siRNAs targeting GFAT (siGFAT). After 24 h of transfection, cells were serum-starved for 24 h, followed by treatment with or without 5 ng/ml TGF-β1 for 24 h. Transwell migration and invasion assays were performed as described in Materials and Methods. Corresponding quantitative results are shown in P. **p < 0.01. ***, p < 0.001; NS, no significance. Representative images of migrated and invaded cells are  shown in Supplementary Fig. S7F.
Fig. 5
Fig. 5. O-GlcNAcylated MORC2 transcriptionally regulates CTGF and SNAIL expression.
A, B MORC2-KO MCF-7 and BT549 cells stably expressing pMSCV or Flag-MORC2 (WT, T556A, or T556D) were serum-starved for 24 h, treated with or without 5 ng/ml TGF-β1 for another 24 h, and then subjected to qPCR analysis of SNAIL (A) or CTGF (B) mRNA levels. ***, p < 0.001; NS, no significance. C, D MORC2-KO MCF-7 and BT549 cells stably expressing pMSCV or Flag-MORC2 (WT, T556A, or T556D) were treated with or without 20 μM PUGNAc for 24 h and then subjected to qPCR analysis of SNAIL (C) or CTGF (D) mRNA levels. ***, p < 0.001; NS, no significance. E, F MORC2-KO MCF-7 and BT549 cells stably expressing pMSCV or Flag-MORC2 (WT, T556A, or T556D) were transfected with or without HA-OGT. After 48 h of transfection, cells were subjected to qPCR analysis of SNAIL (E) or CTGF (F) mRNA levels. ***, p < 0.001. NS, no significance. G, H MORC2-KO MCF-7 and BT549 cells stably expressing pMSCV or Flag-MORC2 (WT, T556A or T556D) were treated with or without 5 ng/ml TGF-β1 for 24 h (G) or 20 μM PUGNAc for 24 h (H), then and subjected to immunoblotting analysis. CTGF and SNAIL levels were normalized to Vinculin levels. In G, cells were serum-starved for 24 h prior to TGF-β1 treatment. I MORC2-KO MCF-7 and BT549 cells stably expressing pMSCV or Flag-MORC2 (WT, T556A or T556D) were transfected with or without HA-OGT. After 48 h of transfection, cells were subjected to immunoblotting analysis. CTGF and SNAIL levels were normalized to Vinculin levels.
Fig. 6
Fig. 6. O-GlcNAcylated MORC2 is recruited to SNAIL and CTGF promoters and enhances promoter activities of SNAIL and CTGF.
A, B MORC2-KO BT549 and MCF-7 cells stably expressing pMSCV or Flag-MORC2 (WT or T556A) were serum-starved for 24 h, and then treated with or without 5 ng/ml TGF-β1 for 24 h. ChIP assays were performed with an anti-Flag antibody or IgG, followed by qPCR analysis. Recruitment of Flag-MORC2 to the SNAIL (A) or CTGF (B) promoter was normalized to Input. **p < 0.01; NS, no significance. C, D, F, G MORC2-KO MCF-7 and BT549 cells stably expressing pMSCV or Flag-MORC2 (WT or T556A) were transfected with a luciferase reporter construct encoding pGL3, pGL3-CTGF (−901 to −2000) or pGL3-SNAIL ( + 100 to −500). After 24 h of transfection, cells were treated with or without 5 ng/ml TGF-β1 for 24 h (C and F) or 20 μM PUGNAc for 24 h (D and G). In D and G, cells were serum-starved for 24 h prior to TGF-β1 treatment. Luciferase assays were performed as described in Materials and Methods. Transfection efficiency was normalized to co-transfected Renilla (Ren) luciferase. Results represent three independent experiments. Error bars represent SEM. **p < 0.01; NS, no significance. E, H MORC2-KO MCF-7 and BT549 cells stably expressing pMSCV or Flag-MORC2 (WT or T556A) were co-transfected with or without a luciferase reporter construct encoding pGL3, pGL3-SNAIL ( + 100 to −500) (E) or pGL3-CTGF (−901 to −2000) (H) and HA-OGT. After 48 h of transfection, luciferase assays were performed as described above. The results are representative of three independent transfection experiments. Error bars represent SEM. **p < 0.01; NS, no significance. I, J MORC2-KO LM2–4175 and BT549 cells stably expressing Flag-MORC2 or Flag-MORC2 T556A were transfected with siNC or two siRNAs targeting SNAIL (siSNAIL) (Supplementary Fig. S10A) or CTGF (siCTGF) (Supplementary Fig. S10B). After 24 h of transfection, cells were serum-starved for 24 h, followed by treatment with or without 5 ng/ml TGF-β1 for 24 h. Transwell migration and invasion assays were performed as described in Materials and Methods. Corresponding quantitative results are shown in I-J. **p < 0.01. ***, p < 0.001; NS, no significance. Representative images of migrated and invaded cells are shown in Supplementary Fig. S10C and Fig. S10D.
Fig. 7
Fig. 7. High expression of MORC2, OGT, and SNAIL/CTGF in breast tumors is associated with poor patient prognosis.
A IHC staining was carried out on a tissue microarray containing 126 breast tumor samples with clinical fellow-up information. Representative IHC images of MORC2, OGT, GFAT, SNAIL, CTGF, and O-GlcNAc expression are shown. Scale bars, 400 μm (left without magnification) and 100 μm (right with magnification). BD Correction analysis of OGT and O-GlcNAc (B), GFAT and CTGF (C), GFAT, and SNAIL (D) expression levels in 126 breast tumor tissues. Pearson correlation test was used. E Correction analysis of MORC2/OGT/CTGF and MORC2/OGT/SNAIL expression levels in 126 breast tumor tissues. Pearson correlation test was used. F, G Kaplan–Meier curves of OS (F) and DFS (G) of 126 breast cancer patients with high or low expression of both MORC2 and OGT proteins are shown. ***, p < 0.001. H, I Kaplan-Meier curves of OS (H) and DFS (I) of 126 breast cancer patients with high or low expression of all of three proteins (MORC2, OGT, and CTGF). J, K Kaplan–Meier curves of OS (J) and DFS (K) of 126 breast cancer patients with high or low expression of all three proteins (MORC2, OGT, and SNAIL) are shown. ***, p < 0.001.

References

    1. Wang T, Yu Q, Li J, Hu B, Zhao Q, Ma C, et al. O-GlcNAcylation of fumarase maintains tumour growth under glucose deficiency. Nat Cell Biol. 2017;19:833–43. - PubMed
    1. Gloster TM, Vocadlo DJ. Mechanism, structure, and inhibition of O-GlcNAc processing enzymes. Curr Signal Transduct Ther. 2010;5:74–91. - PMC - PubMed
    1. Yang X, Qian K. Protein O-GlcNAcylation: emerging mechanisms and functions. Nat Rev Mol Cell Biol. 2017;18:452–65. - PMC - PubMed
    1. Chatham JC, Zhang J, Wende AR. Role of O-linked N-acetylglucosamine protein modification in cellular (patho)physiology. Physiol Rev. 2021;101:427–93. - PMC - PubMed
    1. Zhang N, Zhu T, Yu K, Shi M, Wang X, Wang L, et al. Elevation of O-GlcNAc and GFAT expression by nicotine exposure promotes epithelial-mesenchymal transition and invasion in breast cancer cells. Cell Death Dis. 2019;10:343. - PMC - PubMed

Publication types

MeSH terms