. 2022 Jan;13(1):995-1012.
doi: 10.1080/21655979.2021.2016086.

Prostate-specific membrane antigen modulates the progression of prostate cancer by regulating the synthesis of arginine and proline and the expression of androgen receptors and Fos proto-oncogenes

Affiliations

Prostate-specific membrane antigen modulates the progression of prostate cancer by regulating the synthesis of arginine and proline and the expression of androgen receptors and Fos proto-oncogenes

Xi Hong et al. Bioengineered. 2022 Jan.

Abstract

The expression of prostate-specific membrane antigen (PSMA) is strikingly upregulated during oncogenesis and prostate cancer (PCa) progression, but the functions of this antigen in PCa remain unclear. Here, we constructed PSMA-knockdown LNCaP and 22rv1 cell lines and performed metabonomic and transcriptomic analyses to determine the effects of PSMA on PCa metabolism and transcription. The metabolism of arginine and proline was detected using specific kits. The mRNA and protein expression levels of the identified differentially expressed genes were quantified by RT-qPCR and Western blotting. The proliferation of each cell line was evaluated through CCK-8, EdU and colony formation assays. The migration and invasion abilities of each cell line were detected using wound healing and transwell assays, respectively. PSMA knockdown led to metabolic disorder and abnormal transcription in PCa and resulted in inhibition of the proliferation and metastasis of PCa cells in vitro and in vivo. The depletion of PSMA also promoted the biosynthesis of arginine and proline, inhibited the expression of AR and PSA, and induced the expression of c-Fos and FosB. PSMA plays an important role in the metabolism, proliferation and metastasis of human PCa and may be a promising therapeutic target.

Keywords: PSMA; androgen receptor; arginine; c-Fos; prostate cancer.


Conflict of interest statement

No potential conflict of interest was reported by the author(s).

Figures
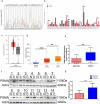
Figure 1.
Figure 1.
PSMA is overexpressed in PCa tissues. A and B. The online analysis platform GEPIA2 was used to analyze the expression of PSMA across multiple cancers based on data from the GTEx and TCGA databases. C. GEPIA2 was used to compare the expression of PSMA between PCa and normal prostate tissues. D The online analysis platform UALCAN was used to analyze the relationship between PSMA expression and nodal metastasis. E. The expression of PSMA in PCa tissues was analyzed by RT-qPCR. F. The expression of PSMA in PCa tissues was detected by Western blotting. G. The Western blotting results were measured by grayscale analysis. (*P < 0.05, **P < 0.01, ***P < 0.001).
Figure 2.
Figure 2.
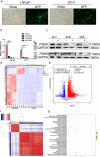
PSMA knockdown affected PCa metabolism. A. The efficiency of virus infection was detected by green fluorescence. B. The efficiency of PSMA knockdown was assessed by RT-qPCR. C. The efficiency of PSMA knockdown was detected by Western blotting. D. Heatmap of differentially altered metabolites. E. Volcano map showing the altered metabolites after PSMA knockdown in LNCaP cells. F. Heatmap showing the correlation of differentially altered metabolites in LNCaP cells. Each row and column represented a metabolite. The red color indicates a positive correlation, the blue color indicates a negative correlation, and the color shade indicates the magnitude of the correlation. G. Bubble diagram of the enrichment of KEGG pathways related to the differentially altered metabolites in LNCaP cells. (*P < 0.05, **P < 0.01, ***P < 0.001).
Figure 3.
Figure 3.
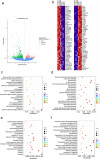
PSMA knockdown affected PCa transcription. A. Volcano map showing the number of genes showing altered transcription after PSMA knockdown in LNCaP cells. B. Heatmap of the top 50 upregulated genes and the top 50 downregulated genes. C. Bubble diagram of the results from the KEGG enrichment analysis of the differentially expressed genes. D. Bubble diagram of the results from the DO enrichment analysis of the differentially expressed genes. E. Bubble diagram of the results from the DisGeNET enrichment analysis of the differentially expressed genes. F. Bubble diagram of the results from the Reactome enrichment analysis of the differentially expressed genes.
Figure 4.
Figure 4.
Combined metabolomic and transcriptomic analyses. A. Correlation analysis of the transcriptome and metabolome. The abscissa represents the metabolite, and the ordinate shows the gene. The red indicates a positive correlation, the blue indicates a negative correlation, and the color shade indicates the magnitude of the correlation. B. Integrated KEGG analysis of differentially expressed genes and differentially expressed metabolites C. Comparison of the enriched metabolic pathways related to the differential transcriptome and metabolome based on KEGG pathway analysis.
Figure 5.
Figure 5.
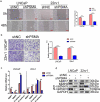
PSMA knockdown inhibited the metastasis of LNCaP and 22rv1 cells. A. Wound healing assays were performed to detect the influence of PSMA knockdown on cell migration. B. Transwell assays were performed to assess the influence of PSMA knockdown on cell invasion. C. The expression of MMP7, MMP9, E-cadherin and N-cadherin was detected by RT-qPCR. D. The expression of MMP7, MMP9, E-cadherin and N-cadherin was detected by Western blotting. (*P < 0.05, **P < 0.01, ***P < 0.001).
Figure 6.
Figure 6.
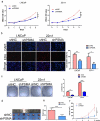
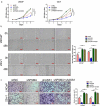
PSMA knockdown inhibited the proliferation of LNCaP and 22rv1 cells. A. CCK-8 assays were performed to detect the influence of PSMA knockdown on the proliferation of LNCaP and 22rv1 cells. B. EdU assays were performed to assess the influence of PSMA knockdown on the proliferation of LNCaP and 22rv1 cells. C. Colony formation assays were performed to assess the influence of PSMA knockdown on the proliferation of LNCaP and 22rv1 cells. D. 22RV1 cells with stable PSMA silencing were injected subcutaneously into nude mice. After 28 days, the mice were sacrificed, and their tumors were photographed. E. The mice were sacrificed after 28 days, and the tumors were excised and weighed. F. The xenograft tumors were measured every week. Vt = 0.5× Length×Width [2]. (*P < 0.05, **P < 0.01, ***P < 0.001).
Figure 7.
Figure 7.
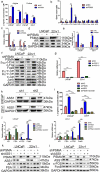
PSMA knockdown promoted the biosynthesis of arginine and proline, inhibited the AR signaling pathway and activated the FOS signaling pathway. A. An L-arginine assay kit and L-proline assay kit purchased from Abcam were used to measure the concentrations of arginine and proline. B. Gene count of differentially expressed genes related to the AR signaling pathway and FOS signaling pathway in the transcriptome. C. The expression of AR and PSA was detected by RT-qPCR. D. The expression of AR and PSA was detected by Western blotting. E. The expression of c-Fos, FosB, p-c-Fos, c-Jun, p-c-Jun Junb and Jund was detected by Western blotting. F. The expression of c-FOS and c-Jun was detected by Western blotting. G. The efficiency of ASS1 knockdown was assessed by RT-qPCR. H. The efficiency of ASS1 knockdown was assessed by Western blotting. I. After the knockdown of both PSMA and ASS1, kits were used to detect the concentrations of arginine and proline. J. The expression of AR, PSA, c-Fos and FosB after the knockdown of both PSMA and ASS1 was measured by RT-qPCR. K. The expression of AR and PSA after the knockdown of both PSMA and ASS1 was detected by Western blotting. L. The change in the expression of c-Fos and FosB after the knockdown of both PSMA and ASS1 was measured by Western blotting. (*P < 0.05, **P < 0.01, ***P < 0.001).
Figure 8.
Figure 8.
ASS1 knockdown restored the functional change induced by PSMA knockdown. A. CCK-8 assays were performed to detect the effect of ASS1 knockdown on the proliferation of PCa cells. B. Wound healing assays were performed to assess the influence of ASS1 knockdown on the migration of PCa cells. C. The effect of ASS1 knockdown on the invasion of PCa cells was assessed by Transwell assays. (*P < 0.05, **P < 0.01, ***P < 0.001).

Similar articles

Cited by

References

    1. Siegel RL, Miller KD, Jemal A.. Cancer statistics, 2020. CA Cancer J Clin. 2020;70(1):7–30. - PubMed
    1. Santos AF, Huang H, Tindall DJ. The androgen receptor: a potential target for therapy of prostate cancer. Steroids. 2004;69(2):79–85. - PubMed
    1. sDel Re M, Conteduca V, Crucitta S, et al. Androgen receptor gain in circulating free DNA and splicing variant 7 in exosomes predict clinical outcome in CRPC patients treated with Abiraterone and enzalutamide. Prostate Cancer Prostatic Dis. 2021;24(2):524–531. - PMC - PubMed
    1. Tian S, Lei Z, Gong Z, et al. Clinical implication of prognostic and predictive biomarkers for castration-resistant prostate cancer: a systematic review. Cancer Cell Int. 2020;20(1):409. - PMC - PubMed
    1. Carlsson SV, Tafe LJ, Chade DC, et al. Pathological features of lymph node metastasis for predicting biochemical recurrence after radical prostatectomy for prostate cancer. J Urol. 2013;189(4):1314–1318. - PMC - PubMed

Publication types

MeSH terms