

Expression profiling of lncRNAs and mRNAs in placental site trophoblastic tumor (PSTT) by microarray
- PMID: 34975294
- PMCID: PMC8692111
- DOI: 10.7150/ijms.65002
Expression profiling of lncRNAs and mRNAs in placental site trophoblastic tumor (PSTT) by microarray
Abstract
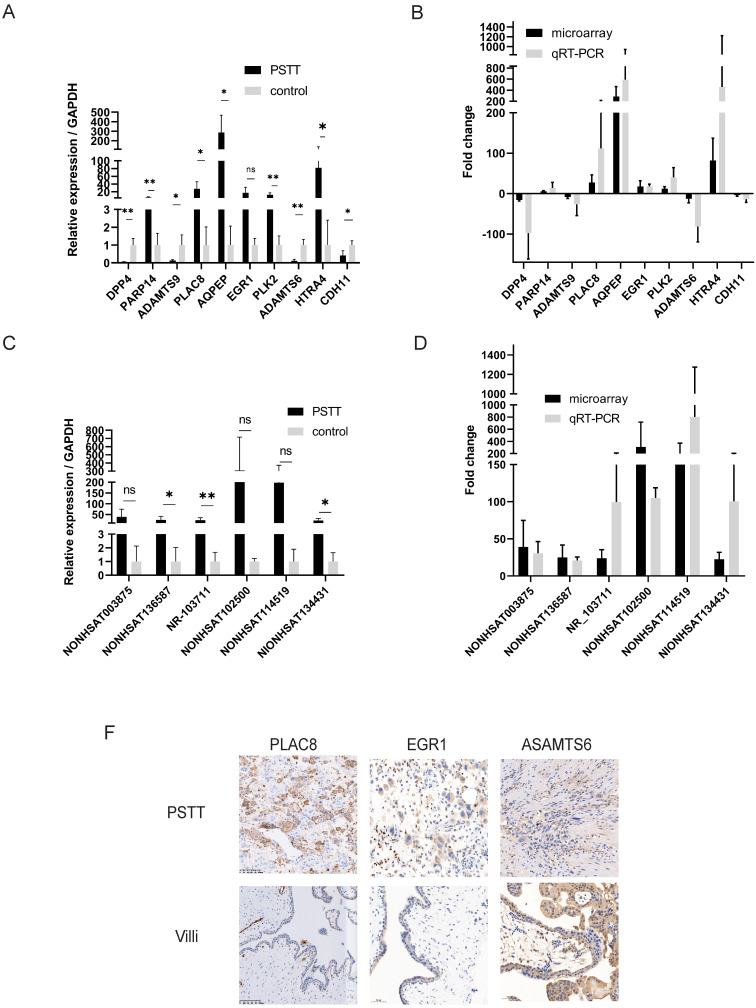
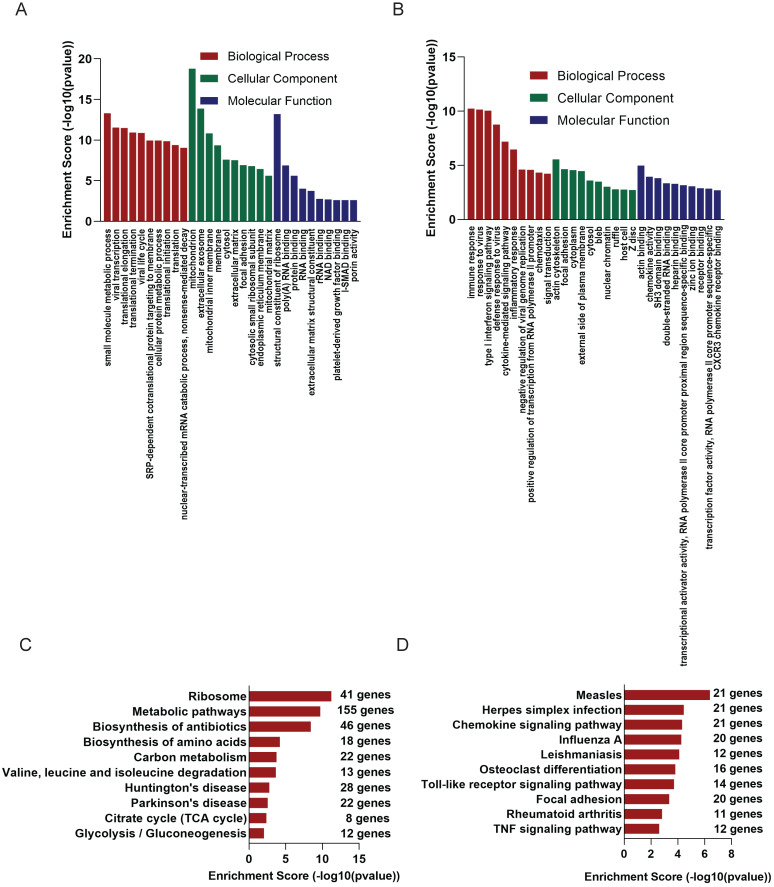
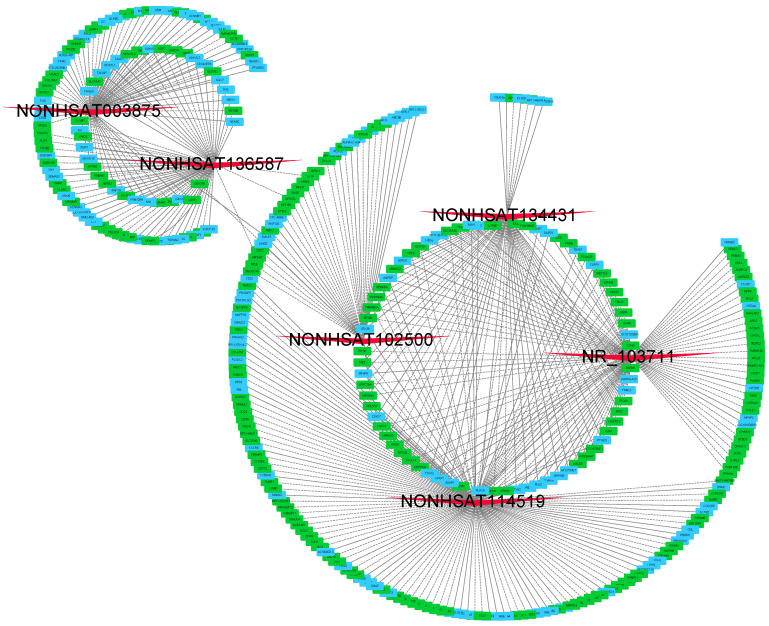
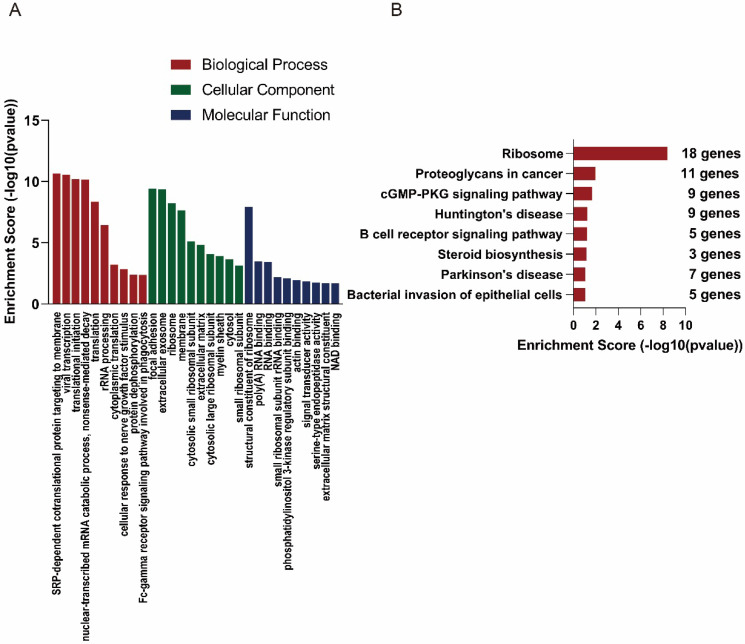
As a rare type of gestational trophoblastic disease, placental site trophoblastic tumor (PSTT) is originated from intermediate trophoblast cells. Long noncoding RNAs (lncRNAs) regulate numerous biological process. However, the role of lncRNAs in PSTT remains poorly understood. In the present study, expression levels of lncRNAs and mRNAs in four human PSTT tissues and four normal placental villi were investigated. The results of microarray were validated by the reverse transcription and quantitative real-time polymerase reaction (RT-qPCR) and immunohistochemistry analyses. Furthermore, GO and KEGG pathway analyses were performed to identify the underlying biological processes and signaling pathways of aberrantly expressed lncRNAs and mRNAs. We also conducted the coding-non-coding gene co-expression (CNC) network to explore the interaction of altered lncRNAs and mRNAs. In total, we identified 1247 up-regulated lncRNAs and 1013 down-regulated lncRNAs as well as 828 up-regulated mRNAs and 1393 down-regulated mRNAs in PSTT tissues compared to normal villi (fold change ≥ 2.0, p < 0.05). GO analysis showed that mitochondrion was the most significantly down-regulated GO term, and immune response was the most significantly up-regulated term. A CNC network profile based on six confirmed lncRNAs (NONHSAT114519, NR_103711, NONHSAT003875, NONHSAT136587, NONHSAT134431, NONHSAT102500) as well as 354 mRNAs was composed of 497 edges. GO and KEGG analyses indicated that interacted mRNAs were enriched in the signal-recognition particle (SRP)-dependent cotranslational protein targeting to membrane and Ribosome pathway. It contributes to expand the understanding of the aberrant lncRNAs and mRNAs profiles of PSTT, which may be helpful for the exploration of new diagnosis and treatment of PSTT.
Keywords: lncRNA; microarray analysis; placental site trophoblastic tumor (PSTT).
© The author(s).
Conflict of interest statement
Competing Interests: The authors have declared that no competing interest exists.
Figures

References
-
- Kurman RJ, Scully RE, Norris HJ. Trophoblastic pseudotumor of the uterus: an exaggerated form of "syncytial endometritis" simulating a malignant tumor. Cancer. 1976;38:1214–26. - PubMed
-
- Seckl MJ, Sebire NJ, Fisher RA, Golfier F, Massuger L, Sessa C. Gestational trophoblastic disease: ESMO Clinical Practice Guidelines for diagnosis, treatment and follow-up. Annals of oncology: official journal of the European Society for Medical Oncology. 2013;24(Suppl 6):vi39–50. - PubMed
-
- Schmid P, Nagai Y, Agarwal R, Hancock B, Savage PM, Sebire NJ, Lindsay I, Wells M, Fisher RA, Short D, Newlands ES, Wischnewsky MB, Seckl MJ. Prognostic markers and long-term outcome of placental-site trophoblastic tumours: a retrospective observational study. Lancet (London, England) 2009;374:48–55. - PubMed
MeSH terms
Substances
LinkOut - more resources
Full Text Sources
Medical
