. 2021 Dec 16:15:801008.
doi: 10.3389/fnins.2021.801008. eCollection 2021.

3D U-Net Improves Automatic Brain Extraction for Isotropic Rat Brain Magnetic Resonance Imaging Data

Affiliations

3D U-Net Improves Automatic Brain Extraction for Isotropic Rat Brain Magnetic Resonance Imaging Data

Li-Ming Hsu et al. Front Neurosci. .

Abstract

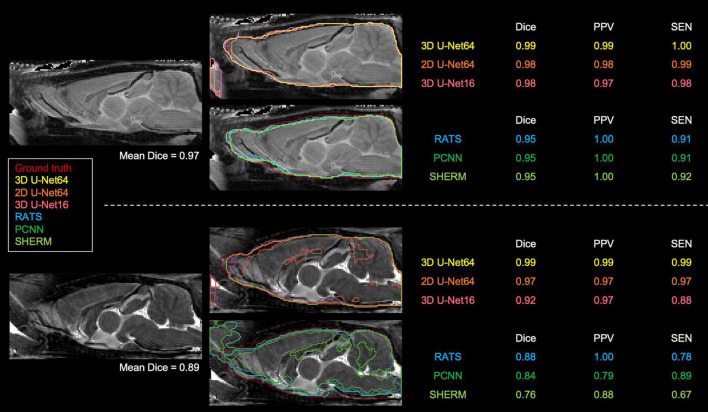
Brain extraction is a critical pre-processing step in brain magnetic resonance imaging (MRI) analytical pipelines. In rodents, this is often achieved by manually editing brain masks slice-by-slice, a time-consuming task where workloads increase with higher spatial resolution datasets. We recently demonstrated successful automatic brain extraction via a deep-learning-based framework, U-Net, using 2D convolutions. However, such an approach cannot make use of the rich 3D spatial-context information from volumetric MRI data. In this study, we advanced our previously proposed U-Net architecture by replacing all 2D operations with their 3D counterparts and created a 3D U-Net framework. We trained and validated our model using a recently released CAMRI rat brain database acquired at isotropic spatial resolution, including T2-weighted turbo-spin-echo structural MRI and T2*-weighted echo-planar-imaging functional MRI. The performance of our 3D U-Net model was compared with existing rodent brain extraction tools, including Rapid Automatic Tissue Segmentation, Pulse-Coupled Neural Network, SHape descriptor selected External Regions after Morphologically filtering, and our previously proposed 2D U-Net model. 3D U-Net demonstrated superior performance in Dice, Jaccard, center-of-mass distance, Hausdorff distance, and sensitivity. Additionally, we demonstrated the reliability of 3D U-Net under various noise levels, evaluated the optimal training sample sizes, and disseminated all source codes publicly, with a hope that this approach will benefit rodent MRI research community. Significant Methodological Contribution: We proposed a deep-learning-based framework to automatically identify the rodent brain boundaries in MRI. With a fully 3D convolutional network model, 3D U-Net, our proposed method demonstrated improved performance compared to current automatic brain extraction methods, as shown in several qualitative metrics (Dice, Jaccard, PPV, SEN, and Hausdorff). We trust that this tool will avoid human bias and streamline pre-processing steps during 3D high resolution rodent brain MRI data analysis. The software developed herein has been disseminated freely to the community.

Keywords: 3D U-Net; MRI; brain extraction; brain mask; rat brain; segmentation.


Conflict of interest statement

The authors declare that the research was conducted in the absence of any commercial or financial relationships that could be construed as a potential conflict of interest.

Figures

FIGURE 1
FIGURE 1
3D U-Net architecture. Boxes represent cross-sections of square feature maps. Individual map dimensions are indicated on lower left, and number of channels are indicated below the dimensions. The leftmost map is a 64 × 64 × 64 normalized MRI image patched from the original MRI map, and the rightmost represents binary ring mask prediction. Red arrows represent operations specified by the colored box, while black arrows represent copying skip connections. Conv, convolution; BN, batch normalization; ReLU, rectified linear unit.
FIGURE 2
FIGURE 2
Brain segmentation performance metrics for 3D U-Net64, 2D U-Net64, 3D U-Net16, RATS, PCNN, and SHERM on the CAMRI T2w RARE (upper row) and T2*w EPI (lower row) data. Average value is shown above each bar. Two-tailed paired t-tests were used for statistical comparison between 3D U-Net64 with other methods (*p < 0.05, **p < 0.01, and *** p < 0.001).
FIGURE 3
FIGURE 3
Best (upper panel) and worst (lower panel) segmentation comparisons for T2w RARE images. Selection was based on the highest and lowest mean Dice score (listed below the brain map) averaged over the six methods (3D U-Net64, 2D U-Net64, 3D U-Net16, RATS, PCNN, and SHERM). Anterior and inferior slices are more susceptible to error in RATS, PCNN, and SHERM, whereas all U-Net algorithms yield high similarly to the ground truth (all Dice > 0.90).
FIGURE 4
FIGURE 4
3D rendering of identified brain masks on the best and worst-case subjects for the T2w RARE rat dataset. Selection was based on the highest and lowest mean Dice score. Specifically, in the worst-case subject, 2D U-Net64, 3D U-Net16, and RATS missed the olfactory bulb, whereas PCNN and SHERM overestimated the olfactory bulb and incorporated surrounding frontal regions. Additionally, RATS, PCNN, and SHERM are missing significant portions of the cerebellum and brainstem (gray arrows). 3D U-Net64 and 3D U-Net32 produces excellent brain segmentation on both best and worst-case subjects.
FIGURE 5
FIGURE 5
Best and worst segmentation comparisons for T2*w EPI images. Selection was based on the highest and lowest mean Dice score (listed above the brain map) averaged over the six methods (3D U-Net64, 2D U-Net64, 3D U-Net16, RATS, PCNN, and SHERM). Posterior and inferior slices are more susceptible to error in RATS, PCNN, and SHERM, whereas all U-Net algorithms are more similar to the ground truth (all Dice > 0.90).
FIGURE 6
FIGURE 6
Segmentation performance of 3D U-Net64 with different image SNR. For each T2w (left) and T2*w image (right), we added noise with random Gaussian distribution in the normalized testing images with variance from 5 × 10– 5 to 5 × 10– 4 and increments of 5 × 10– 5 to investigate the segmentation performance of 3D U-Net64. Black dots indicate the averaged SNR and Dice from the original images without adding noise. The horizontal dot line in left panel indicates a Dice of 0.95. Error bar represents the standard error of Dice and SNR.
FIGURE 7
FIGURE 7
Segmentation performance of 3D U-Net64 across different model-training and model-validating sample sizes. The 3D U-Net64 was trained from randomly selected subgroups. In the training process, we randomly selected 5–55 training subjects in increments of 5 subjects from the total 55 training dataset, and 2, 8, and 14 validation subjects from the total 14 validation dataset. The random selection was repeated 5 times to avoid bias. Statistical analyses compared Dice values under various conditions against the Dice values obtained from 55 training rats and 14 validation rats (one tailed paired t-test, *p < 0.05, +0.05 < p < 0.1). No significant differences were found between various model-validation sample selections within each model-training data selection for both T2w RARE and T2*w EPI data (repeated measurement ANOVA).

References

    1. Alom M. Z., Hasan M., Yakopcic C., Taha T. M., Asari V. K. (2018). Recurrent Residual Convolutional Neural Network based on U-Net (R2U-Net) for Medical Image Segmentation. arXiv [preprint]. 10.1109/NAECON.2018.8556686 - DOI
    1. Avants B. B., Tustison N., Song G. (2009). Advanced normalization tools (ANTS). Insight J. 2 1–35.
    1. Babalola K. O., Patenaude B., Aljabar P., Schnabel J., Kennedy D., Crum W., et al. (2009). An evaluation of four automatic methods of segmenting the subcortical structures in the brain. Neuroimage 47 1435–1447. 10.1016/j.neuroimage.2009.05.029 - DOI - PubMed
    1. Chiao J.-Y., Chen K.-Y., Liao K. Y.-K., Hsieh P.-H., Zhang G., Huang T.-C. (2019). Detection and classification the breast tumors using mask R-CNN on sonograms. Medicine 98:e15200. 10.1097/MD.0000000000015200 - DOI - PMC - PubMed
    1. Chollet F. (2015). Keras Documentation [WWW Document]. San Francisco: GitHub

LinkOut - more resources