. 2021 Dec 15:12:797261.
doi: 10.3389/fimmu.2021.797261. eCollection 2021.

Immunosuppressive Traits of the Hybrid Epithelial/Mesenchymal Phenotype

Affiliations

Immunosuppressive Traits of the Hybrid Epithelial/Mesenchymal Phenotype

Sarthak Sahoo et al. Front Immunol. .

Abstract

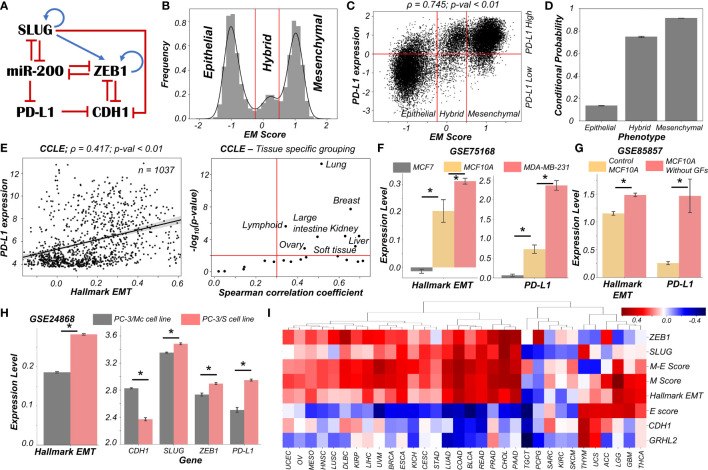
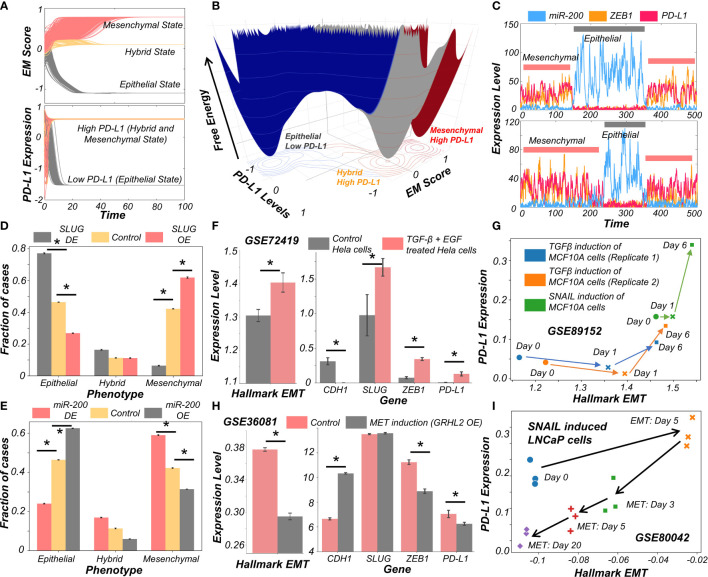
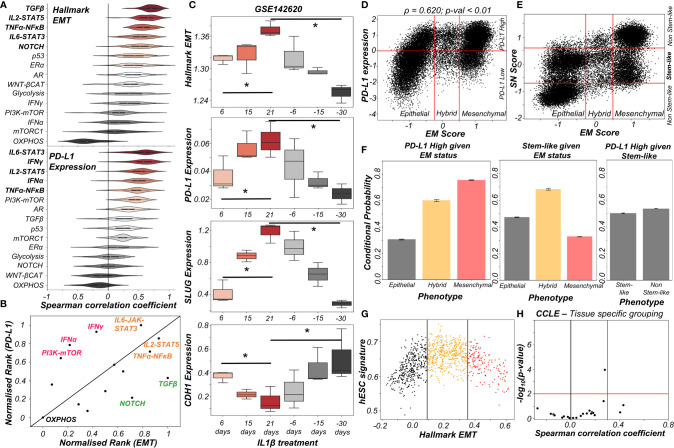
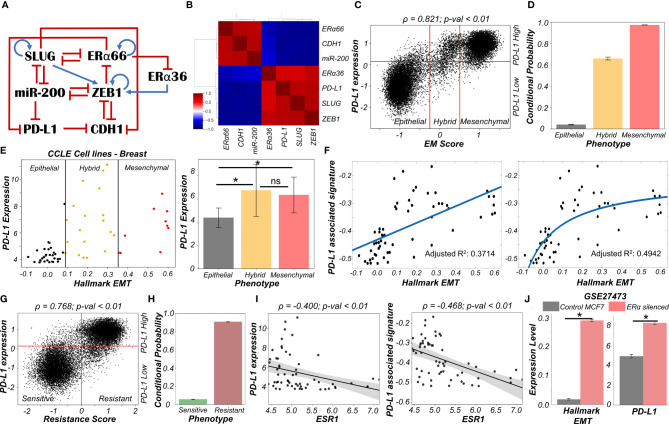
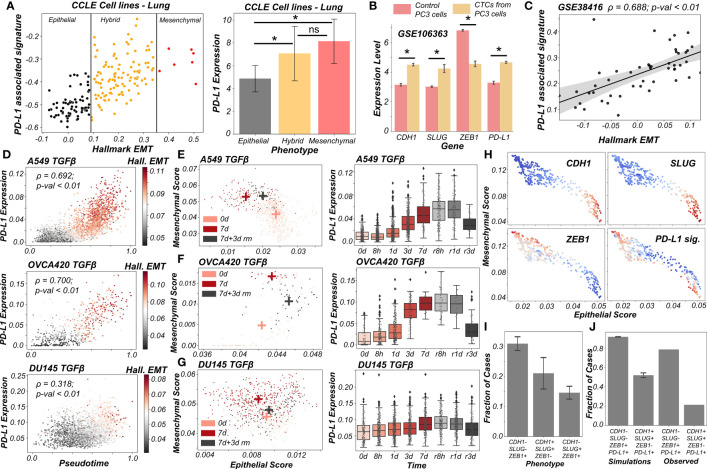
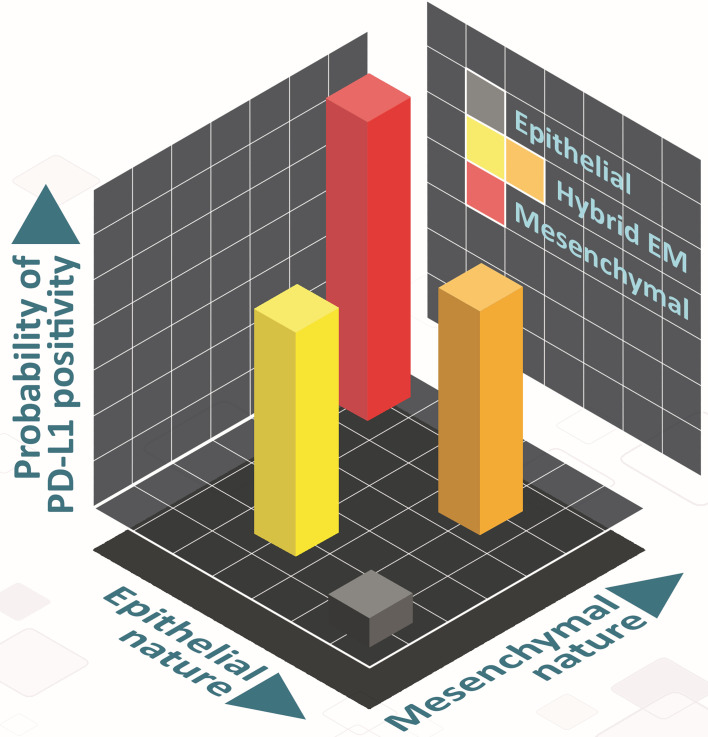
Recent preclinical and clinical data suggests enhanced metastatic fitness of hybrid epithelial/mesenchymal (E/M) phenotypes, but mechanistic details regarding their survival strategies during metastasis remain unclear. Here, we investigate immune-evasive strategies of hybrid E/M states. We construct and simulate the dynamics of a minimalistic regulatory network encompassing the known associations among regulators of EMT (epithelial-mesenchymal transition) and PD-L1, an established immune-suppressor. Our simulations for the network consisting of SLUG, ZEB1, miR-200, CDH1 and PD-L1, integrated with single-cell and bulk RNA-seq data analysis, elucidate that hybrid E/M cells can have high levels of PD-L1, similar to those seen in cells with a full EMT phenotype, thus obviating the need for cancer cells to undergo a full EMT to be immune-evasive. Specifically, in breast cancer, we show the co-existence of hybrid E/M phenotypes, enhanced resistance to anti-estrogen therapy and increased PD-L1 levels. Our results underscore how the emergent dynamics of interconnected regulatory networks can coordinate different axes of cellular fitness during metastasis.

Keywords: PD-L1; epithelial- mesenchymal transition (EMT); hybrid epithelial/mesenchymal; immune evasion; multistability.


Conflict of interest statement

The authors declare that the research was conducted in the absence of any commercial or financial relationships that could be construed as a potential conflict of interest.

Figures

Figure 1
Figure 1
Dynamics of regulatory network coupling EMT with PD-L1. (A) Regulatory network (GRN) capturing the interplay of EMT regulators coupled with PD-L1. Blue arrows stand for activation links, red hammers for inhibitory links. (B) Density histogram of EM Score fitted with kernel density estimate showing a trimodal distribution. Red lines show the partition between phenotypes: Epithelial, Hybrid, and Mesenchymal. (C) Scatter plot of PD-L1 expression and EM score. Horizontal red line shows the partition between PDL1 expression level being high vs. low. Vertical red lines show the partition between phenotypes: Epithelial, Hybrid, and Mesenchymal based on EM score. Spearman’s correlation coefficient (ρ) and corresponding p-value (p-val) have been reported. (D) Bar plot representing the conditional probability of a phenotype being PD-L1 high given that it belongs to a given EMT phenotype. Error bars denote standard deviation calculated on three independent simulations. (E) Scatter plot showing correlation between PD-L1 levels and the Hallmark EMT signature in cell lines from CCLE. Spearman’s correlation coefficient (ρ) and corresponding p-value (p-val) are reported (left panel). Splitting CCLE cell lines reveals tissues that show a strong significant correlation (ρ > 0.3 and p-val < 0.01) (right panel). (F) Activity levels of Hallmark EMT and PD-L1 expression levels in 3 breast cancer cell lines (GSE75168). (G) Activity/Expression levels of Hallmark EMT and PD-L1 levels in MCF10A breast cancer cells treated with or without growth factors (GSE85857). (H) Activity/Expression levels of Hallmark EMT and PD-L1 levels in two prostate cancer sub-lines of PC3 with different EMT status (GSE24868). (I) Heatmap showing the Spearman’s correlation coefficients between the different EM metrics and EMT associated genes and PD-L1 levels across 32 different cancer types in TCGA. * denotes a statistically significant difference (p-val < 0.05) between the represented groups assessed by a two-tailed Students t-test assuming unequal variances.
Figure 2
Figure 2
Evidence for causal links between EMT associated genes and PD-L1 levels. (A) Dynamics of EM score and PD-L1 showing presence of epithelial, hybrid, and mesenchymal phenotypes and their corresponding PD-L1 levels, when simulated from multiple initial conditions. (B) Probability landscape on the PD-L1 and EM score plane, with the valleys representing the stable states possible in the system. Three distinct states – Epithelial/PD-L1 low, Hybrid E-M/PD-L1 high, and Mesenchymal/PD-L1 high – are observed. (C) Stochastic simulations of gene regulatory network via sRACIPE showing spontaneous switching between different states. (D) Simulation results showing the fraction of cases of epithelial, hybrid, and mesenchymal phenotypes under control (yellow), SLUG DE (grey) and SLUG OE (orange) conditions. (E) Same as D but for miR-200 OE (grey) and miR-200 OE (orange) conditions. (F) Activity/Expression levels of Hallmark EMT and PD-L1 levels in Hela cells induced to undergo EMT (GSE72419). (G) Two-dimensional Hallmark EMT and PD-L1 plot showing trajectory of MCF10A cells induced with TGFβ or SNAIL (GSE89152). (H) Activity/Expression levels of Hallmark EMT and PD-L1 levels in HMLE cells where MET has been induced via overexpression of GRHL2 (GSE36081). (I) Two-dimensional Hallmark EMT and PD-L1 plot showing trajectory of LNCaP prostate cancer cells that have been induced with SNAIL to undergo EMT followed by removal of signal to induce MET (GSE80042). * denotes p-val < 0.05 as assessed by a two-tailed Students t-test assuming unequal variances.
Figure 3
Figure 3
Signalling pathways and biological processes that can affect PD-L1 and/or EMT. (A) Violin plots of Spearman’s correlation values of different signalling pathways with Hallmark EMT programme (top) or with PD-L1 levels (bottom) ordered by corresponding median values across 27 cancer types in TCGA. (B) Scattered plot between normalized ranks of signalling pathways with the EMT programme and with PD-L1 expression levels. Signalling pathways hypothesized to be specific to EMT programme are labelled in green, those specific for PD-L1 highlighted in pink and those with both in orange. (C) Activity/expression levels of Hallmark EMT, PD-L1, SLUG, and CDH1 levels in lung cancer cells treated with IL-1β and subsequent removal of signal (GSE142620). (D) Scatter plot of PD-L1 expression and EM score. Horizontal red line shows the partition between PD-L1 expression level being high vs low for the circuit in Figure S4C . Vertical red lines show the partition between phenotypes: Epithelial, Hybrid, and Mesenchymal based on EM score. Spearman’s correlation coefficient (ρ) and corresponding p-value (p-val) are reported. (E) Scatter plot of SN score and EM score showing the presence of clusters having predominantly stem-like hybrid and the presence of both stem like and non-stem like epithelial and mesenchymal cells scattered in the plane. Horizontal red lines show the partition between stem-like and non-stem-like based on SN score and EM phenotypes. (F) Bar plot representing conditional probability of PD-L1 being high given EM status, stem-like phenotype given EM status, and PD-L1 high given stemness status respectively. (G) Scatter plot showing the non-monotonic association between the hESC signature and the Hallmark EMT signature in CCLE dataset. The boundaries are determined by trisection of the entire range of Hallmark EMT signature values. (H) No tissue in CCLE shows a strong significant Spearman’s correlation (ρ > 0.3 and p-val < 0.01) between hESC signature and PD-L1 levels. * denotes a statistically significant difference (p-val < 0.05) between the represented groups assessed by a two-tailed Students t-test assuming unequal variances.
Figure 4
Figure 4
Association of high PD-L1 levels with acquisition of a reversible drug resistant phenotype in ER+ Breast cancer. (A) Regulatory network interplay of EMT regulators, estrogen receptor isoforms (ERα66, ERα36) coupled with PD-L1. Blue arrows stand for activation links, red hammers for inhibitory links. (B) Pairwise correlation matrix using Spearman correlations showing the existence of 2 “teams” of players – SLUG, ZEB1, ERα36, PD-L1 and CDH1, miR-200 and ERα66 – with mutually antagonistic associations. (C) Scatter plot of PD-L1 levels and EM score. Spearman’s correlation coefficient (ρ) and corresponding p-value (p-val) are reported. (D) Bar plot representing conditional probability of a phenotype being PD-L1 high given that it belongs to a given EMT phenotype. (E) Scatter plot showing correlation between PD-L1 levels and the Hallmark EMT signature in breast cancer specific cell lines from CCLE. The boundaries between epithelial, hybrid and mesenchymal phenotypes are based on trisection of the entire range of Hallmark EMT scores of all cell lines in CCLE (left). Quantification of PD-L1 levels of breast cancer cell lines belonging to different EM status (right). * denotes p-val < 0.05 as assessed by a two-tailed Students t-test assuming unequal variances. (F) Scatter plot showing linear vs Michaelis-Menten curve fit to a scatter plot of PD-L1 associated and Hallmark EMT signatures. (G) Scatter plot of PD-L1 levels and Resistance score classified as high (>0) vs low (<0). Spearman’s correlation coefficient (ρ) and corresponding p-value (p-val) are reported. (H) Bar plot representing conditional probability of a phenotype being PD-L1 high given that it is sensitive vs. resistant state. (I) Scatter plot showing a significant negative correlation between PD-L1 levels and PD-L1 associated signature and ESR1 expression levels in breast cancer cell lines from CCLE. (J) Activity/Expression levels of Hallmark EMT and PD-L1 levels in MCF7 ER+ breast cancer cells with control and ERα silenced cases (GSE27473). * denotes a statistically significant difference (p-val < 0.05) between the represented groups assessed by a two-tailed Students t-test assuming unequal variances. ns represents results that are not statistically significant (p-val > = 0.05).
Figure 5
Figure 5
PD-L1 levels depend on the extent and direction of transition of hybrid E/M cells on 2D EM plane (A) Scatter plot showing PD-L1 associated and Hallmark EMT signature in lung cancer specific cell lines from CCLE. Boundaries (vertical lines) drawn are based on trisection of the entire range of Hallmark EMT scores of all cell lines in CCLE (left). Quantification of PD-L1 levels of breast cancer cell lines belonging to different EMT status (right). (B) Expression levels of ZEB1, SLUG, CDH1 and PD-L1 in control PC3 cell line and PC3 derived CTCs (GSE106363). For (A, B); * denotes a statistically significant difference (p-val < 0.05) between the represented groups assessed by a two-tailed Students t-test assuming unequal variances. (C) Scatter plot of PD-L1 associated and Hallmark EMT signature showing a significant positive correlation in single and pooled prostate cancer cells and single DTC from metastatic prostate cancer patients (GSE38416). (D) Scatter plot of imputed PD-L1 expression with pseudotime colored by Hallmark EMT scores calculated on imputed gene expression data in TGFβ induced EMT in A549, OVCA420 and DU145 cell lines (GSE147405). (E–G) 2D EM plots (left panels) showing cells of 3 different time points (day 0, day 7 and day 3 after TGFβ removal) for 3 different cell lines. + sign indicates the average epithelial and mesenchymal scores of cells belonging to the corresponding time point. Imputed PD-L1 levels over all time points plotted as boxplots (right panels). (E) A549 (F) OVCA420 (G) DU145. (H) 2D EM plots of cells from skin squamous cell carcinoma after imputation coloured by CDH1, SLUG, ZEB1 and PD-L1 associated signature. Red represents high expression while blue represents low expression (GSE110357). (I) Abundance of top phenotypes in hybrid EM compartment shown in (simulation results). (J) Bar plots showing the fraction of different hybrid phenotypes as measured from simulations and seen in experimental data. ns represents results that are not statistically significant (p-val > = 0.05).
Figure 6
Figure 6
Schematic showing the PD-L1 of hybrid E/M cells on 2D EM plane. Cells can take various paths in this 2D place as they transition from epithelial (grey) to mesenchymal (red), involving different hybrid E/M phenotypes (yellow, orange) – path from grey to yellow to red, and that from grey to orange to red). In hybrid E/M phenotypes, PD-L1 levels are likely to be comparatively higher as compared to that in epithelial ones, and comparable to what is seen for mesenchymal phenotypes.

References

    1. Binnewies M, Roberts EW, Kersten K, Chan V, Fearon DF, Merad M, et al. . Understanding the Tumor Immune Microenvironment (TIME) for Effective Therapy. Nat Med (2018) 24:541–50. doi: 10.1038/s41591-018-0014-x - DOI - PMC - PubMed
    1. Sun C, Mezzadra R, Schumacher TN. Regulation and Function of the PD-L1 Checkpoint. Immunity (2018) 48:434–52. doi: 10.1016/j.immuni.2018.03.014 - DOI - PMC - PubMed
    1. Hashimoto M, Kamphorst AO, Im SJ, Kissick HT, Pillai RN, Ramalingam SS, et al. . CD8 T Cell Exhaustion in Chronic Infection and Cancer: Opportunities for Interventions. Annu Rev Med (2018) 69:301–18. doi: 10.1146/annurev-med-012017-043208 - DOI - PubMed
    1. Chen L, Gibbons DL, Goswami S, Cortez MA, Ahn Y, Byers L A, et al. . Metastasis Is Regulated via microRNA-200/ZEB1 Axis Control of Tumour Cell PD-L1 Expression and Intratumoral Immunosuppression. Nat Commun (2014) 5:5241. doi: 10.1038/ncomms6241 - DOI - PMC - PubMed
    1. Dongre A, Rashidian M, Reinhardt F, Bagnato A, Keckesova Z, Ploegh HL, et al. . Epithelial-To-Mesenchymal Transition Contributes to Immunosuppression in Breast Carcinomas. Cancer Res (2017) 77:3982–9. doi: 10.1158/0008-5472.CAN-16-3292 - DOI - PMC - PubMed

Publication types

MeSH terms