. 2021 Dec 15:12:761862.
doi: 10.3389/fpls.2021.761862. eCollection 2021.

Comparative Transcriptome Analysis Identifies Key Regulatory Genes Involved in Anthocyanin Metabolism During Flower Development in Lycoris radiata

Affiliations

Comparative Transcriptome Analysis Identifies Key Regulatory Genes Involved in Anthocyanin Metabolism During Flower Development in Lycoris radiata

Ning Wang et al. Front Plant Sci. .

Abstract

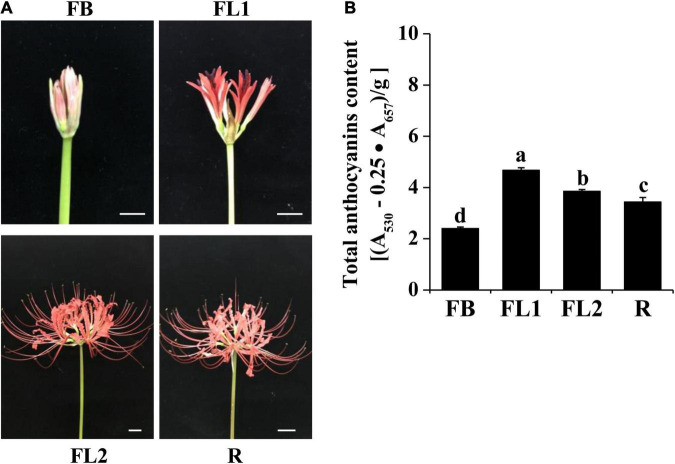
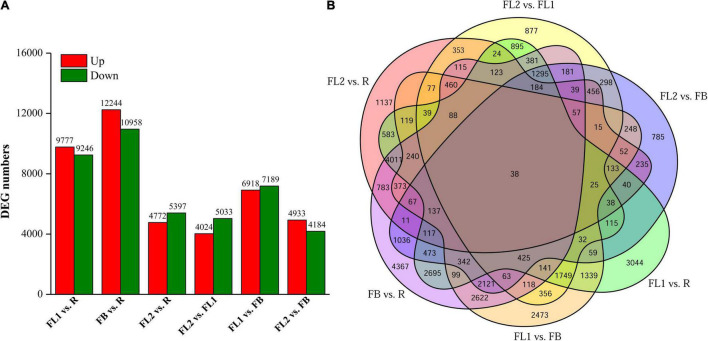
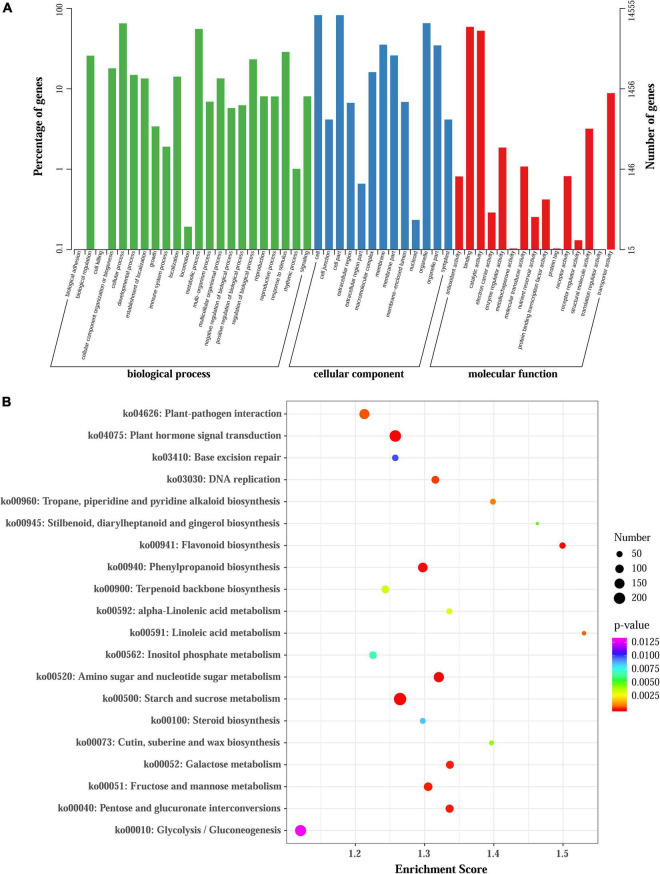
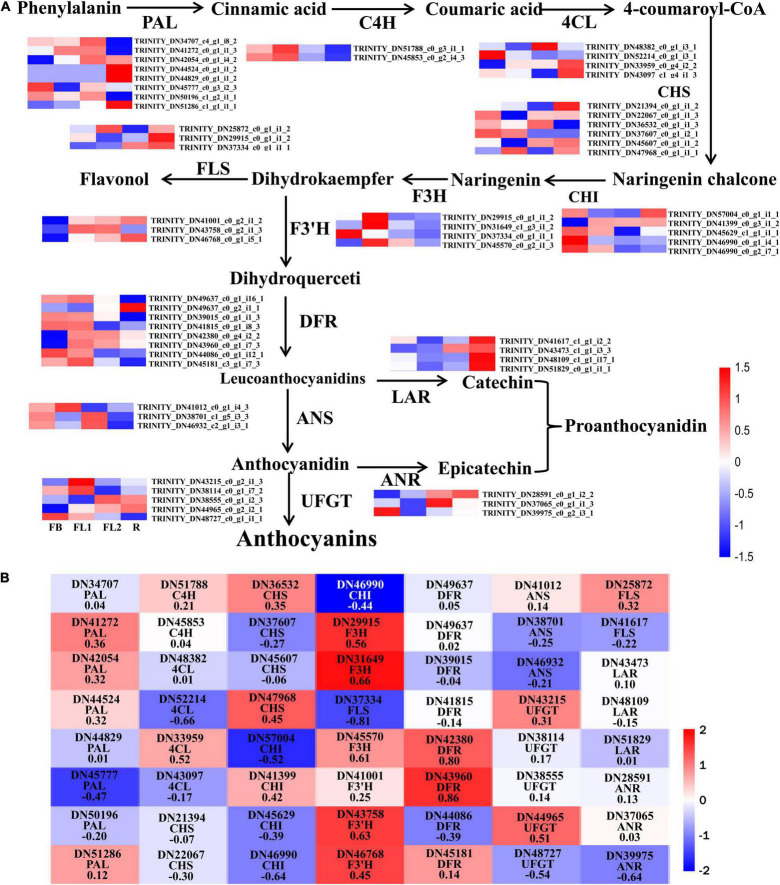
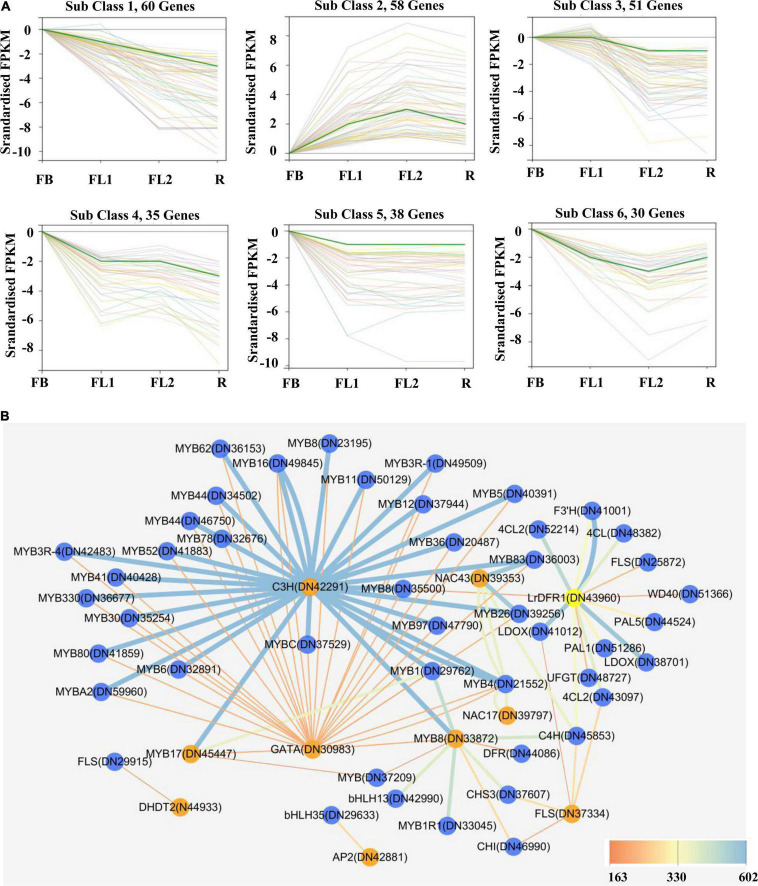
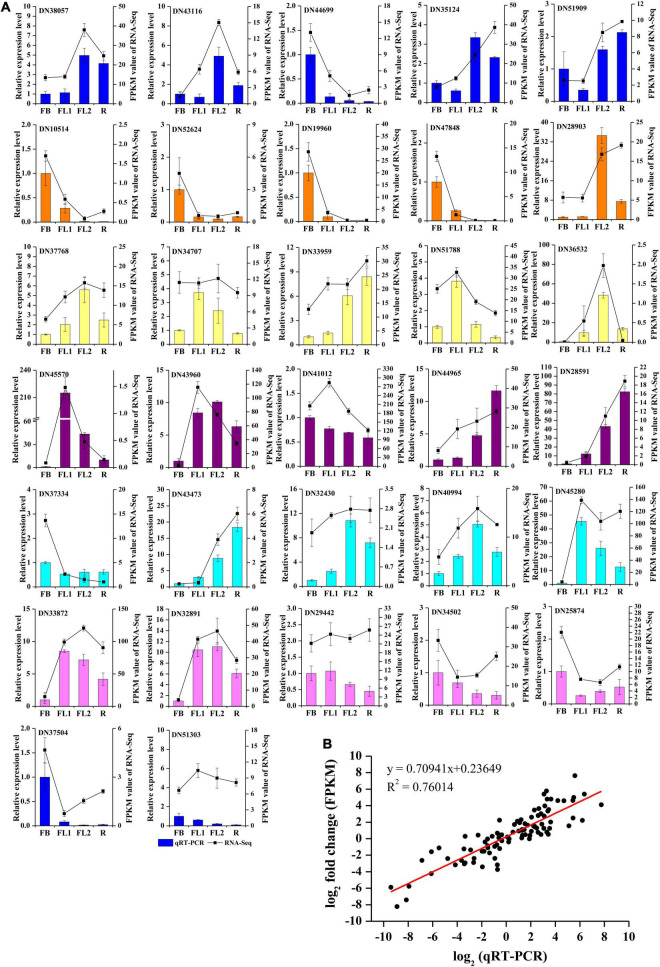
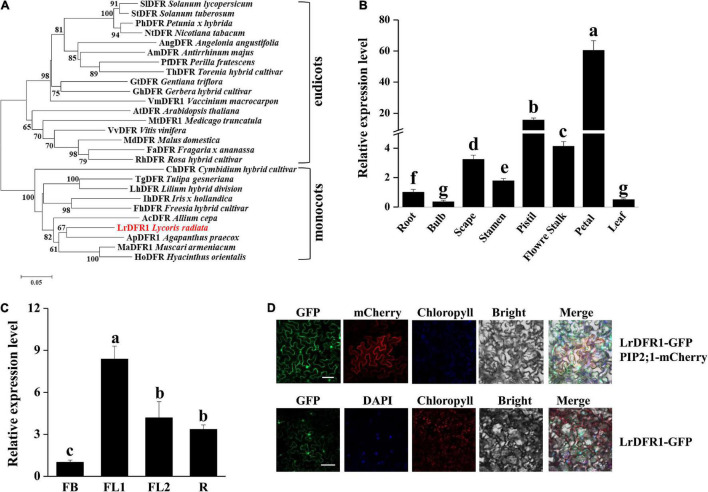
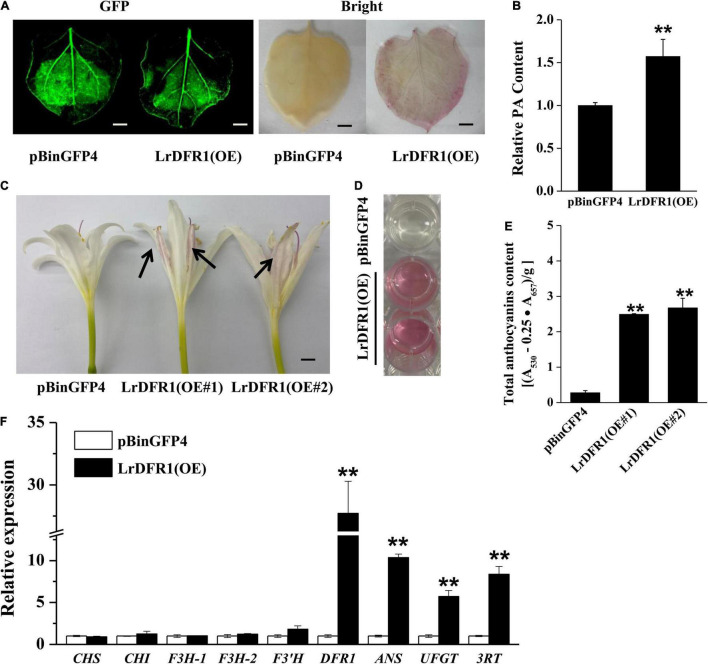
Lycoris is used as a garden flower due to the colorful and its special flowers. Floral coloration of Lycoris is a vital trait that is mainly regulated via the anthocyanin biosynthetic pathway. In this study, we performed a comparative transcriptome analysis of Lycoris radiata petals at four different flower development stages. A total of 38,798 differentially expressed genes (DEGs) were identified by RNA sequencing, and the correlation between the expression level of the DEGs and the anthocyanin content was explored. The identified DEGs are significantly categorized into 'flavonoid biosynthesis,' 'phenylpropanoid biosynthesis,' 'Tropane, piperidine and pyridine alkaloid biosynthesis,' 'terpenoid backbone biosynthesis' and 'plant hormone signal transduction' by Kyoto Encyclopedia of Genes and Genomes (KEGG) enrichment analysis. The candidate genes involved in anthocyanin accumulation in L. radiata petals during flower development stages were also identified, which included 56 structural genes (especially LrDFR1 and LrFLS) as well as 27 key transcription factor DEGs (such as C3H, GATA, MYB, and NAC). In addition, a key structural gene namely LrDFR1 of anthocyanin biosynthesis pathway was identified as a hub gene in anthocyanin metabolism network. During flower development stages, the expression level of LrDFR1 was positively correlated with the anthocyanin content. Subcellular localization revealed that LrDFR1 is majorly localized in the nucleus, cytoplasm and cell membrane. Overexpression of LrDFR1 increased the anthocyanin accumulation in tobacco leaves and Lycoris petals, suggesting that LrDFR1 acts as a positively regulator of anthocyanin biosynthesis. Our results provide new insights for elucidating the function of anthocyanins in L. radiata petal coloring during flower development.

Keywords: Lycoris radiata; anthocyanin; dihydroflavonol 4-reductase; phytohormone; structural genes; transcription factors; transcriptome.


Conflict of interest statement

The authors declare that the research was conducted in the absence of any commercial or financial relationships that could be construed as a potential conflict of interest.

Figures

FIGURE 1
FIGURE 1
Phenotypes and anthocyanins content in petals of L. radiata at different development stages. (A) Petals of L. radiata at four flower development stages. FB, floral bud stage; FL1, partially opening flower stage; FL2, fully opened flower stage, and R, senescent flower stage. Bars: 1 cm. (B) Anthocyanin levels in L. radiata petals at four flower development stages. Bars with different letters are significantly different at p < 0.05 according to Duncan’s multiple range test.
FIGURE 2
FIGURE 2
Statistics of differentially expressed genes (DEGs) between two different samples at flower development stages. (A) Numbers of DEGs in various pair-wise comparisons. (B) Venn diagram for the numbers of DEGs as shown by pair-wise comparisons. FB, floral bud stage; FL1, partially opening flower stage; FL2, fully opened flower stage, and R, senescent flower stage.
FIGURE 3
FIGURE 3
GO and KEGG enrichment analysis of all DEGs. (A) GO enrichment results of all DEGs. (B) Enrichment of the top 20 KEGG pathways of all DEGs according to the p-value.
FIGURE 4
FIGURE 4
Analysis of DEGs involved in anthocyanin biosynthesis pathway in L. radiata. (A) Anthocyanin biosynthesis pathway and the log2 transformed FPKM values of DEGs associated with structural enzyme genes were used to draw the heatmap. The enzymes include 4-coumarateCoA ligase (4CL), phenylalanine ammonia lyase (PAL), chalcone synthase (CHS), flavone 3-hydroxylase (F3H), chalcone isomerase (CHI), flavonoid 3′-hydroxylase (F3′H), dihydroflavonol reductase (DFR), flavonol synthase (FLS), UDP-flavonoid glucosyl transferase (UFGT), anthocyanidin reductase (ANR), and leucoanthocyanidin reductase (LAR). FB, floral bud stage; FL1, partially opening flower stage; FL2, fully opened flower stage, and R, senescent flower stage. Color gradients comprise red, white, and blue, representing genes that were upregulated, not regulated, as well as downregulated, respectively. (B) The heatmap analysis of all DEGs in anthocyanin biosynthesis pathway according to the FPKM value.
FIGURE 5
FIGURE 5
Gene expression profiles of identified transcription factor and protein-protein interaction network of key structural enzymes and TFs involved in anthocyanin biosynthesis in L. radiata flowers. (A) K-means clusters of DEGs based on standardized (log2 transformed) FPKM of L. radiata petals at flower development stage (FB, FL1, FL2, and R). Number of genes that were clustered in every subclass are shown above each Figure. (B) Protein–protein interaction network constituted by protein sequences of differentially expressed transcription factors and structural genes involved in anthocyanin synthesis of L. radiata petals. Genes that have the higher weight are depicted in ‘yellow and orange,’ the ‘blue edges’ correspond to co-expressed strong links and the ‘yellow edges’ correspond to co-expressed weak links.
FIGURE 6
FIGURE 6
qRT-PCR validation of gene expression level in the transcriptome. (A) qRT-PCR validation of gene expression level in the transcriptome. Thirty two unigenes were selected for qRT-PCR validation. (B) Correlation analysis of the results between qRT-PCR and RNA-Seq.
FIGURE 7
FIGURE 7
Phylogenetic tree analysis, transcription expression profiles, and subcellular localization of LrDFR1. (A) Phylogenetic assessment of LrDFR1 with other DFR proteins from different plants. Phylogenetic tree generation was achieved using the maximum likelihood method in MEGA 7.0 software. Numbers at every interior branch show bootstrap values of 1000 replicates. The bar shows a 0.05 genetic distance. Plant species as well as GenBank accession numbers of DFR proteins used in phylogenetic analyses are: Solanum tuberosum StDFR (AF449422), Solanum lycopersicum SlDFR (CAA79154.1), Petunia hybrida PhDFR (AF233639), Angelonia angustifolia AngDFR (KJ817183), Nicotiana tabacum NtDFR (NP_001312559.1), Antirrhinum majus AmDFR (X15536), Perilla frutescens PfDFR (AB002817), Gentiana triflora GtDFR (D85185), Torenia hybrid ThDFR (AB012924), Gerbera hybrid GhDFR (Z17221), Vaccinium macrocarpon VmDFR1 (AF483835), Arabidopsis thaliana AtDFR (AB033294), Medicago truncatula MtDFR1 (AY389346), Vitis vinifera VvDFR (Y11749), Malus domestica MdDFR (AAO39816), Rosa hybrid RhDFR (D85102), Cymbidium hybrid ChDFR (AF017451), Fragaria ananassa FaDFR (AF029685), Tulipa gesneriana TgDFR (BAH98155.1), Lilium hybrid LhDFR (AB058641), Iris hollandica IhDFR (BAF93856.1), Allium cepa AcDFR (AY221250.2), Agapanthus praecox ApDFR (AB099529.1), Muscari aucheri MaDFR (MH636605), Freesia hybrid FhDFR (KU132389), and Hyacinthus orientalis HoDFR (AFP58815.1). (B) Expression profiles of LrDFR1 in various tissues of L. radiata. Expressions of LrDFR1 were assessed by qRT-PCR, and normalized to LrTIP41. Expressions of LrDFR1 in root tissues were defined as 1.0. Data are shown as mean ± SD. Bars with different letters are significantly different at p < 0.05 according to Duncan’s multiple range test. (C) Expression profiles of LrDFR1 during the FB stage, FL1 stage, FL2 stage and R stage of L. radiata. Expression levels of LrDFR1 were assessed by qRT-PCR, and normalized to LrTIP41. Expression levels of LrDFR1 in FB stage were defined as 1.0. Data are shown as mean ± SD. Bars with different letters are significantly different at p < 0.05 according to Duncan’s multiple range test. (D) Subcellular localization of LrDFR1 in N. benthamiana epidermal cells. Scale bars = 20 μm. The nuclei are indicated by DAPI staining.
FIGURE 8
FIGURE 8
Overexpression of LrDFR1 promotes anthocyanin and proanthocyanidin biosynthesis. (A) Proanthocyanidin staining and (B) relative proanthocyanidin (PA) levels in transiently transformed tobacco leaves (pBinGFP4: empty vector controls; LrDFR1-OE: LrDFR1-overexpressing leaves). Tobacco leaves were kept in a phytotron at 24°C under constant lighting for 5 days. DMACA was used to stain proanthocyanidin. Every experiment was performed using 8–10 leaves for each genotype. Experiments were conducted in triplicates, and a representative image is shown. Proanthocyanidin levels of empty vector controls were set as the reference to 1. Asterisks represent significant differences between control and LrDFR1-overexpressing leaves (**p < 0.01). Bars = 1 cm. (C) Phenotypes of anthocyanin accumulation. Arrow indicates the transfected petals. (D,E) Relative anthocyanin levels in transiently transformed Lycoris petals (pBinGFP4: empty vector controls; LrDFR1-OE: LrDFR1-overexpressing petals). Lycoris petals were kept in a phytotron at 24°C with a constant light for 5 days. Every experiment was performed using 8–10 petals per genotype. Data are shown as mean ± SD. **p < 0.01. Bar = 0.5 cm. (F) Relative expression levels of endogenous anthocyanin biosynthetic genes in pBinGFP4 (empty vector controls) as well as LrDFR1-overexpressing petals. Expression patterns of early biosynthetic genes (CHS, F3H, CHI, and F3′H) as well as late biosynthetic genes (DFR, UFGT, ANS, and 3RT) in petals were investigated. Asterisks represent significant differences between control and LrDFR1-overexpressing petals (**p < 0.01).

References

    1. An J. P., Liu Y. J., Zhang X. W., Bi S. Q., Wang X. F., You C. X., et al. (2020a). Dynamic regulation of anthocyanin biosynthesis at different light intensities by the BT2-TCP46-MYB1 module in apple. J. Exp. Bot. 71 3094–3109. 10.1093/jxb/eraa056 - DOI - PMC - PubMed
    1. An J. P., Zhang X. W., Bi S. Q., You C. X., Wang X. F., Hao Y. J. (2020b). The ERF transcription factor MdERF38 promotes drought stress-induced anthocyanin biosynthesis in apple. Plant J. 101 573–589. 10.1111/tpj.14555 - DOI - PubMed
    1. An J. P., Qu F. J., Yao J. F., Wang X. N., You C. X., Wang X. F., et al. (2017). The bZIP transcription factor MdHY5 regulates anthocyanin accumulation and nitrate assimilation in apple. Hortic. Res. 4:17023. 10.1038/hortres.2017.56 - DOI - PMC - PubMed
    1. An J. P., Wang X. F., Li Y. Y., Song L. Q., Zhao L. L., You C. X., et al. (2018). EIN3-LIKE1, MYB1, and ethylene response factor 3 act in a regulatory loop that synergistically modulates ethylene biosynthesis and anthocyanin accumulation. Plant Physiol. 178 808–823. - PMC - PubMed
    1. An J. P., Wang X. F., Zhang X. W., Bi S. Q., You C. X., Hao Y. J. (2019). MdBBX22 regulates UV-B-induced anthocyanin biosynthesis through regulating the function of MdHY5 and is targeted by MdBT2 for 26S proteasome-mediated degradation. Plant Biotechnol. J. 17 2231–2233. 10.1104/pp.18.00068 - DOI - PMC - PubMed

LinkOut - more resources