. 2022 Jan 1;12(2):474-492.
doi: 10.7150/thno.63744. eCollection 2022.

A transcriptional biosensor to monitor single cancer cell therapeutic responses by bioluminescence microscopy

Affiliations

A transcriptional biosensor to monitor single cancer cell therapeutic responses by bioluminescence microscopy

Audrey Champagne et al. Theranostics. .

Abstract

When several life-prolonging drugs are indicated for cancer treatment, predictive drug-response tumor biomarkers are essential to guide management. Most conventional biomarkers are based on bulk tissue analysis, which cannot address the complexity of single-cell heterogeneity responsible for drug resistance. Therefore, there is a need to develop alternative drug response predictive biomarker approaches that could directly interrogate single-cell and whole population cancer cell drug sensitivity. In this study, we report a novel method exploiting bioluminescence microscopy to detect single prostate cancer (PCa) cell response to androgen receptor (AR)-axis-targeted therapies (ARAT) and predict cell population sensitivity. Methods: We have generated a new adenovirus-delivered biosensor, PCA3-Cre-PSEBC-ITSTA, which combines an integrated two-step transcriptional amplification system (ITSTA) and the activities of the prostate cancer antigen 3 (PCA3) and modified prostate-specific antigen (PSEBC) gene promoters as a single output driving the firefly luciferase reporter gene. This system was tested on PCa cell lines and on primary PCa cells. Single cells, exposed or not to ARAT, were dynamically imaged by bioluminescence microscopy. A linear discriminant analysis (LDA)-based method was used to determine cell population sensitivities to ARAT. Results: We show that the PCA3-Cre-PSEBC-ITSTA biosensor is PCa-specific and can dynamically monitor single-cell AR transcriptional activity before and after ARAT by bioluminescence microscopy. After biosensor transduction and bioluminescence microscopy single-cell luminescence dynamic quantification, LDA analysis could discriminate the cell populations overall ARAT sensitivity despite heterogeneous single-cell responses. Indeed, the biosensor could detect a significant decrease in AR activity following exposure to conventional ARAT in hormone-naive primary PCa cells, while in castration-resistant PCa patients, treatment response correlated with the observed clinical ARAT resistance. Conclusion: The exploitation of bioluminescence microscopy and multi-promoter transcriptionally-regulated biosensors can aptly define the overall treatment response of patients by monitoring live single cell drug response from primary cancer tissue. This approach can be used to develop predictive biomarkers for drug response in order to help clinicians select the best drug combinations or sequences for each patient.

Keywords: bioluminescence microscopy, single-cell dynamic imaging, androgen receptor-axis-targeted therapy resistance.; biosensor; prostate cancer.


Conflict of interest statement

Competing Interests: The authors have declared that no competing interest exists.

Figures
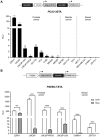
Figure 1
Figure 1
The PCA3 promoter is prostate cancer-specific while PSEBC promoter is androgen responsive. (A) The PCA3 promoter is highly prostate cancer (PCa)-specific. (B) The PSEBC promoter is active in androgen responsive cell lines. Luciferase assay of prostate cancer cells, bladder cancer cells and breast cancer cells infected with PCA3-3STA or PSEBC-TSTA for 72 h. In case of PSEBC-TSTA, 24 h post-infection, media was replaced with media containing DHT or Bica. The luciferase activity was first normalized by protein content in each well and then normalized according to the average of luciferase activity driven by SV40 promoter (SV40-Luc) in each cell line (RLU = (luciferase activity/μg protein) ÷ (SV40 luciferase activity/μg protein)). Data represents mean of triplicates ± standard deviation (SD). Data were compared by one sample t-test (A) and unpaired Student's t-test (B). AR: androgen receptor; Bica: bicalutamide; DHT: dihydrotestosterone; RLU: relative light unit.
Figure 2
Figure 2
A new biosensor system designed to combine the specificity of two promoters for driving the expression of a single reporter gene after TSTA transcriptional amplification. (A) Activation scheme for multi-promoter integrated TSTA (MP-ITSTA) system driven by the PCA3 and PSEBC promoters (PCA3-Cre-PSEBC-ITSTA). (B) BGH poly-A stop cassette efficiently inhibited the expression of luciferase and gave better reactivation in the presence of Cre compared to SV40 poly-A stop. (C) Insertion of the chimeric human intron within Cre recombinase without affecting the expression of firefly luciferase. Luciferase assay of LAPC4 cells co-transfected with plasmids as described above along with pGL3-renilla-null for 72 h. Firefly luciferase activity was normalized over renilla activity (RLU = firefly luciferase activity/renilla luciferase activity). Data represents mean of triplicates ± standard deviation (SD). Data were compared by two-way analysis of variance (ANOVA) followed by Bonferroni's multiple comparisons tests (B) and unpaired Student's t-test (C). BGH-Ig: human β-globin and immunoglobulin; BGH poly-A: Bovine growth hormone poly-A; Prm2: mice protamine; Prm2-AG: Mice protamine with AG splice site; RLU: relative light unit.
Figure 3
Figure 3
Characterization of the best MP-ITSTA conformations for prostate cancer-specific expression and validation of the loxP site excision by Cre. (A) Scheme of non-replicative reporter adenoviruses. (B) Amplification provided by orientation A was highest and had the least leaky expression in non-PCa cells. Androgen-sensitive prostate cancer cells (22Rv1, LAPC4), androgen receptor-deficient prostate cancer cells (DU-145), breast cancer cells (CAMA-1) and bladder cancer cells (SW780) were infected with non-replicative adenovirus with the above-mentioned orientations at 2 MOI. Seventy-two hours after infection, the cells were lysed, and luciferase assay was performed. Relative luciferase activity was normalized over total protein and then normalized over luciferase activity driven by SV40 promoter (SV40-Luc) in each cell line (RLU = (luciferase activity/μg protein) ÷ (SV40 luciferase activity/μg protein)). (C) PCA3-dependent Cre expression led to efficient deletion of DNA between the loxP sites. The 22Rv1 cells were infected with replication-deficient adenovirus expressing the firefly luciferase gene under control of PCA3-Cre-PSEBC-ITSTA (with Cre) or PCA3-GFP-PSEBC-ITSTA (no Cre) at 2 MOI. Cells were harvested at the indicated time points and viral DNA was isolated. Quantitative real-time PCR was done for the isolated DNA using two sets of primers: Primer set 1 amplifying luciferase as internal control and Primer set 2 amplifying a region within the stop cassette. Relative copy number (RCN) = ((copy number of stop cassette/copy number of luciferase)/RCN at 6 h × 100). Each data represents mean of triplicates ± standard deviation (SD) of a representative experiment. Data were compared by unpaired Student's t-test. DHT: dihydrotestosterone; PCa: prostate cancer; RCN: Relative copy number; RLU: Relative light unit.
Figure 4
Figure 4
PCA3-Cre-PSEBC-ITSTA shows activity specifically in androgen receptor responsive prostate cancer cells giving an induction comparable to PSEBC-TSTA. (A) PCA3-Cre-PSEBC-ITSTA is active only in AR sensitive prostate cancer cells. (B) Levels of induction seen with AR agonist DHT with PCA3-Cre-PSEBC-ITSTA is similar to PSEBC-TSTA. Luciferase assay of AR responsive prostate cancer cells (22Rv1, LAPC4, LNCaP) and AR responsive breast cancer (ZR-75-1 and CAMA-1) cells infected with PSEBC-TSTA or PCA3-Cre-PSEBC-lTSTA and treated with DHT or Bica for 48 h. The luciferase activity was first normalized by protein content in each well and then normalized according to the average of luciferase activity driven by SV40 promoter (SV40-Luc) in each cell line (RLU = (luciferase activity/μg protein) ÷ (SV40 luciferase activity/μg protein)) and represented as relative activity over 22Rv1 in the case of (A) or relative activity over bicalutamide in the case of (B). The data represents mean of triplicates ± S.D. Data were compared by unpaired Student's t-test. AR: androgen receptor; Bica: bicalutamide; DHT: dihydrotestosterone; RLU: relative light unit.
Figure 5
Figure 5
Dynamic bioluminescence imaging of single cells expressing PCA3-Cre-PSEBC-ITSTA allows characterization of heterogeneous androgenic response in single prostate cancer cell line population. (A) Bioluminescence imaging of LAPC4 cells expressing PCA3-Cre-PSEBC-ITSTA treated with DHT for 48 h. Right panel shows examples of bioluminescence signal intensity of 16 single cells over time. Scale bar represents 200 μm. (B) Plot of dynamic monitoring of luminescence activity for LAPC4 cells expressing PCA3-Cre-PSEBC-ITSTA treated with DHT for 48 h. (C) Change in the luminescence activity of the cell highlighted in red. Change in luminescence activity is calculated from the slope between the two-time data. (D) Change in luminescence activity over time calculated from each individual cell is plotted with respect to luminescence activity after treatment of each cell. Cell number 4 highlighted in (A) is denoted with red color. Number of cells; n = 55. DHT: dihydrotestosterone.
Figure 6
Figure 6
PCA3-Cre-PSEBC-ITSTA assess single-cell population response to antiandrogen treatment of prostate cancer cells. Plot of change in luminescence activity versus luminescence activity per cell after 48 h of treatment with DHT, DHT + Bica or DHT + Enza in LNCaP (A), LAPC4 (B) or 22Rv1 (C) cells expressing PCA3-Cre-PSEBC-ITSTA. Dotted and full lines represent LDA decision boundaries of DHT vs DHT + Bica or DHT vs DHT + Enza groups, respectively. (D) Charts representing the observations of each cell factor scores after dimensionality reduction by LDA. Upper and bottom chart sections of each cell line compare DHT with DHT + Bica and DHT with DHT + Enza groups, respectively. Black symbols represent the score mean (centroid) for each group. (E) ROC curves obtained after performing LDA for each combination of treatment vs DHT data sets. Treated groups with DHT + Bica or DHT + Enza are shown with dot or full lines, respectively. The calculated AUC values for each treatment are indicated in the table inset. AUC values in bold are different from 0.5 (a random classifier) with a P value ≤ 0.05. Table inset shows p values of AUC pairwise comparisons using DeLong's method (*p < 0.05, **p < 0.01, ****p < 0.0001). Number of cells analyzed for DHT, DHT + Bica or DHT + Enza treatment with LNCaP cells (n = 69, 64, 51), LAPC4, (n = 55, 45, 56) and 22Rv1 (n = 66, 57, 62), respectively. (F) The AUC obtained from linear discriminant analysis are replicable and can discriminate antiandrogen treated from untreated sensitive single-cell populations. Around 75 cells per well for each treatment arm (three wells per treatment arm per experiment) were included in the LDA analysis to build ROC curves and obtain AUC data. Three independent experiments are reported on the x axis. AUC data between DHT and the other treatment arms were compared by analysis of variance (ANOVAs) with post hoc Dunnett's multiple comparison test to determine if there is statistical significance or not. ANOVA with Tukey's multiple comparison test was used to determine if independent experiments were statistically different from each other within the same treatment arm. AUC: area under the curve; Bica: bicalutamide; DHT: dihydrotestosterone; Enza; enzalutamide; LDA: linear discriminant analysis.
Figure 7
Figure 7
The PCA3-Cre-PSEBC-ITSTA system highlights the antiandrogen therapeutic sensitivity in naive primary prostate cancer patient samples. Clinical information of each patient and ROC curves obtained after performing LDA for each combination of treatment vs DHT control data sets for each naive primary tumor sample. Analyzed cells treated with DHT + Bica or DHT + Enza, are shown with dotted or full line, respectively. AUC values in bold are different from 0.5 (a random classifier) with a P value ≤ 0.05. The non-significative difference between AUC is based on Delong method. Number of measured cells for each condition, n = 60. AUC: area under the curve; Bica: bicalutamide; DHT: dihydrotestosterone; Enza; enzalutamide; LDA: linear discriminant analysis.
Figure 8
Figure 8
Antiandrogen sensitivity of single prostate cancer cells population from metastatic castration resistant prostate cancer patients determined by PCA3-Cre-PSEBC-ITSTA system correlates with clinical patient responses. (A, E) Clinical information of each patient. (B, F) Plots of change in luminescence activity versus luminescence activity after treatment for each PCa cells from patient samples after 48 h of treatment with DHT, DHT + Bica or DHT + Enza. Dotted and full lines represent LDA decision boundaries of DHT vs DHT + Bica or DHT vs DHT + Enza groups, respectively. (C, G) Charts representing the observations of each cell factor scores after dimensionality reduction by LDA. Upper and bottom chart sections of each cell line compare DHT with DHT + Bica and with DHT + Enza group, respectively. Black symbols represent the score mean (centroid) for each group. (D, H) ROC curves obtained after performing LDA for each combination of treatment vs DHT data sets for each patient sample. Analyzed cells treated with DHT + Bica or DHT + Enza, are shown with dotted or full line, respectively. AUC is calculated for each treatment. AUC values in bold are significantly different (P value ≤ 0.05) from 0.5 (a random classifier). Significant differences between AUC are calculated using Delong method (*p < 0.05, ***p < 0.001). The number of measured cells for DHT, DHT + Bica or DHT + Enza condition are respectively; PT7, n = 42, 46, 38 and PT8 sampling #1, n = 65, 69; sampling #2, n = 69, 63. AUC: area under the curve; Bica: bicalutamide; DHT: dihydrotestosterone; Enza; enzalutamide; LDA: linear discriminant analysis.

References

    1. Watson PA, Arora VK, Sawyers CL. Emerging mechanisms of resistance to androgen receptor inhibitors in prostate cancer. Nat Rev Cancer. 2015;15:701–11. - PMC - PubMed
    1. Chandrasekar T, Yang JC, Gao AC, Evans CP. Mechanisms of resistance in castration-resistant prostate cancer (CRPC) Transl Androl Urol. 2015;4:365–80. - PMC - PubMed
    1. Dagogo-Jack I, Shaw AT. Tumour heterogeneity and resistance to cancer therapies. Nat Rev Clin Oncol. 2018;15:81–94. - PubMed
    1. Marusyk A, Janiszewska M, Polyak K. Intratumor Heterogeneity: The Rosetta Stone of Therapy Resistance. Cancer Cell. 2020;37:471–84. - PMC - PubMed
    1. Cyll K, Ersvaer E, Vlatkovic L, Pradhan M, Kildal W, Avranden Kjaer M. et al. Tumour heterogeneity poses a significant challenge to cancer biomarker research. Br J Cancer. 2017;117:367–75. - PMC - PubMed

Publication types