. 2022 Jan 1;12(2):620-638.
doi: 10.7150/thno.60540. eCollection 2022.

Single-cell RNA sequencing reveals a pro-invasive cancer-associated fibroblast subgroup associated with poor clinical outcomes in patients with gastric cancer

Affiliations

Single-cell RNA sequencing reveals a pro-invasive cancer-associated fibroblast subgroup associated with poor clinical outcomes in patients with gastric cancer

Xuechun Li et al. Theranostics. .

Abstract

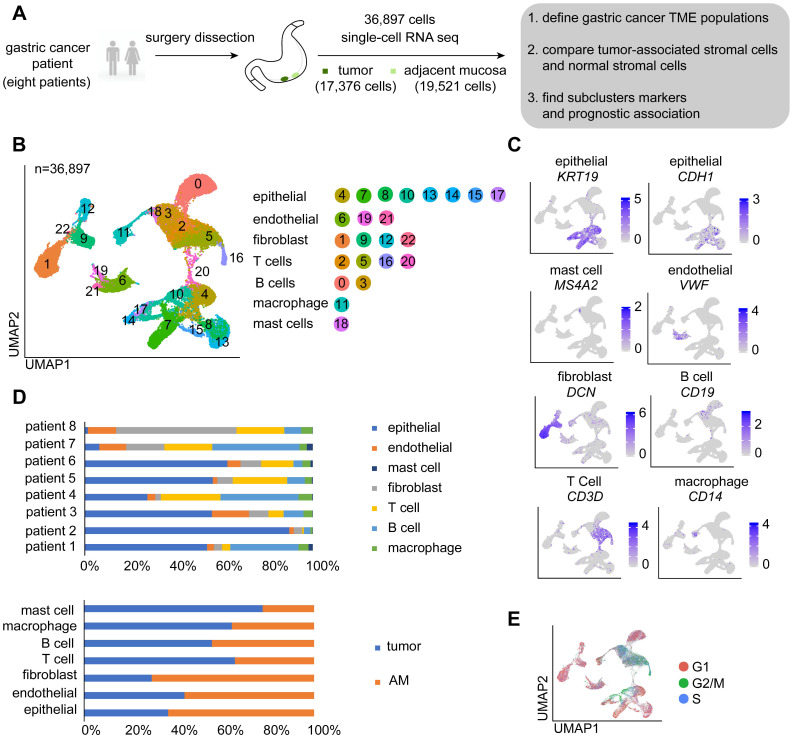
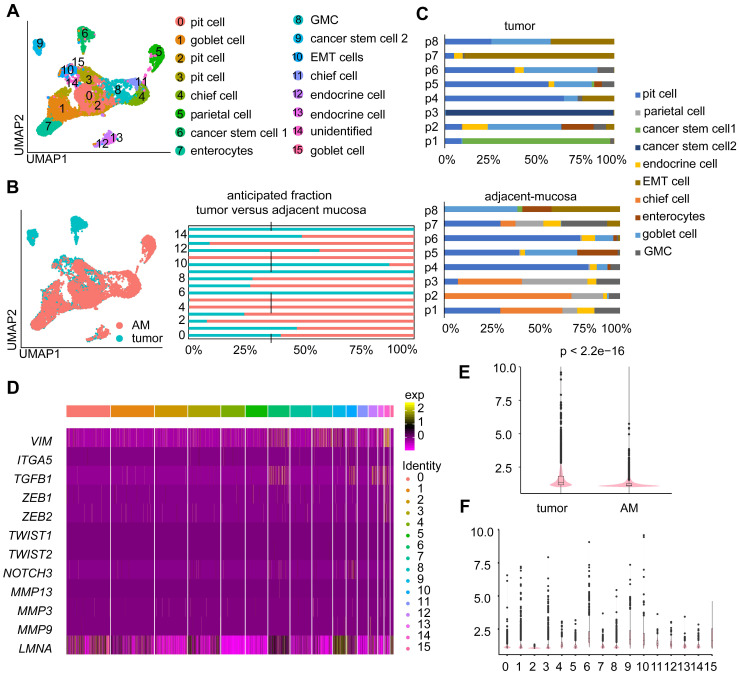
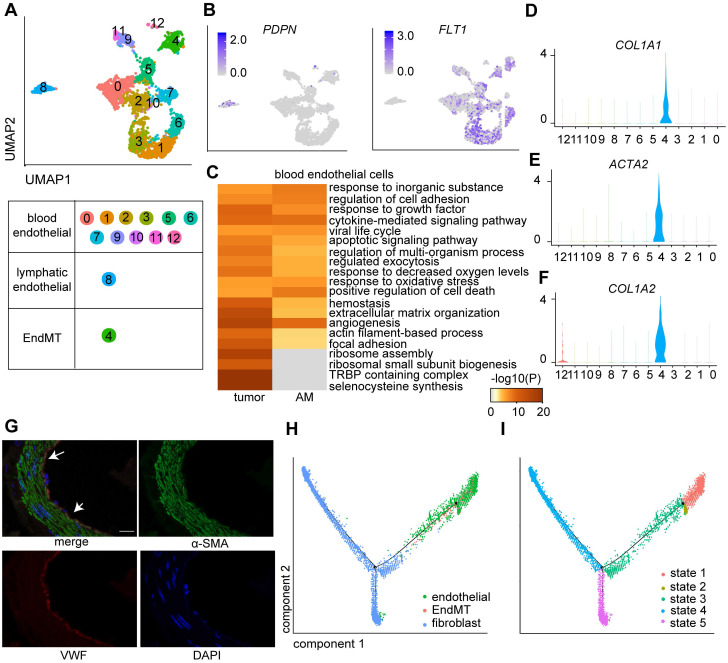
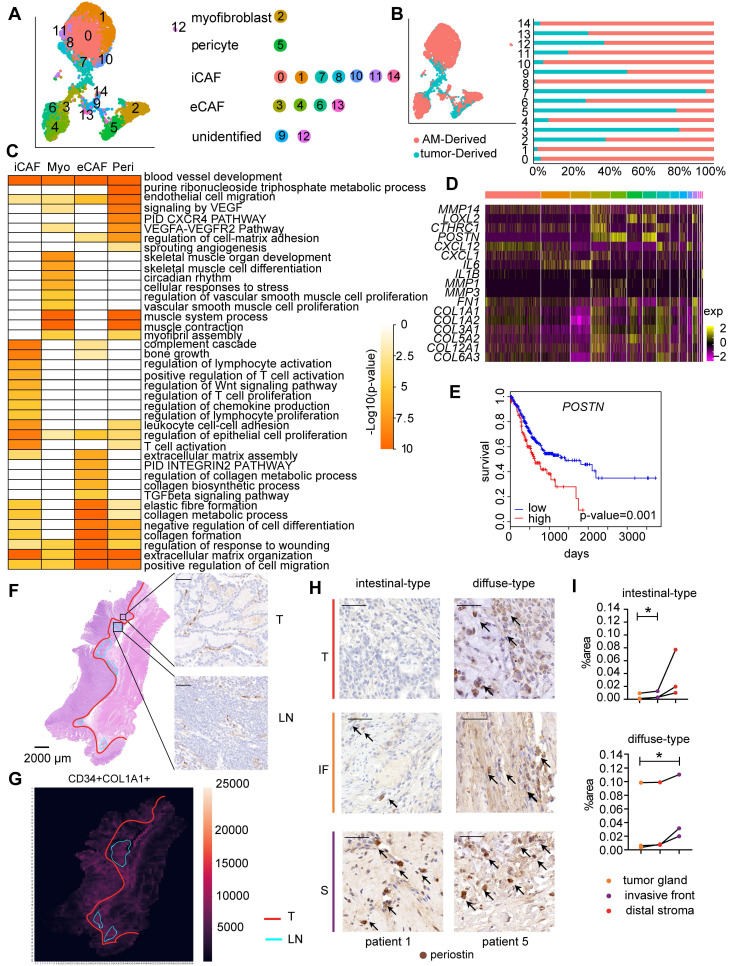
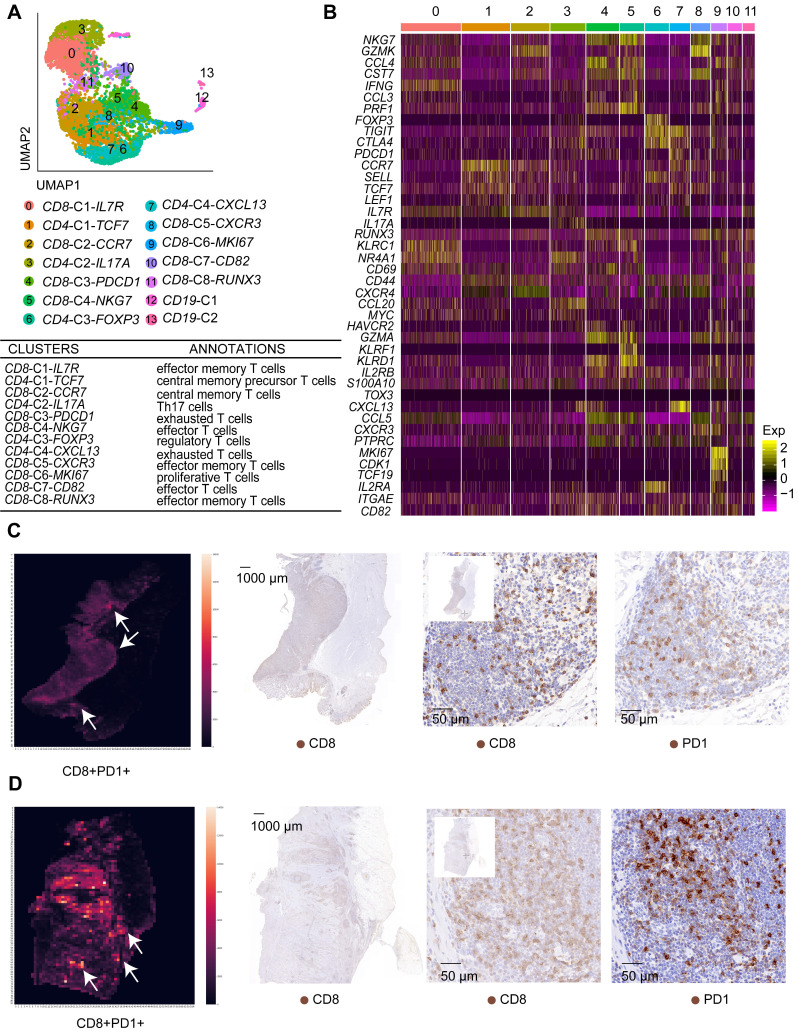
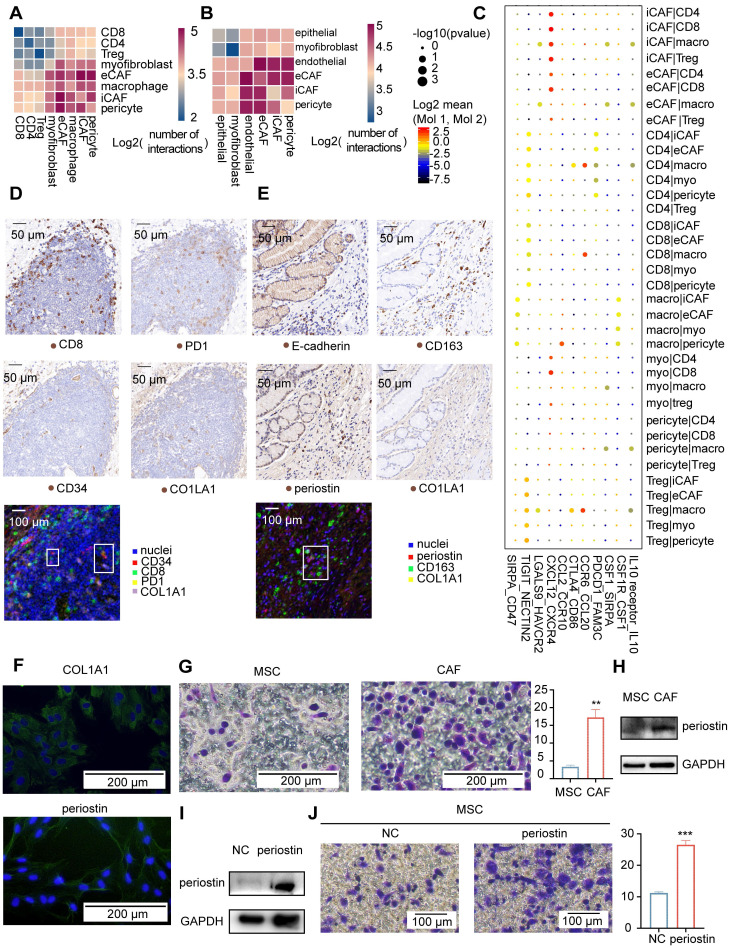
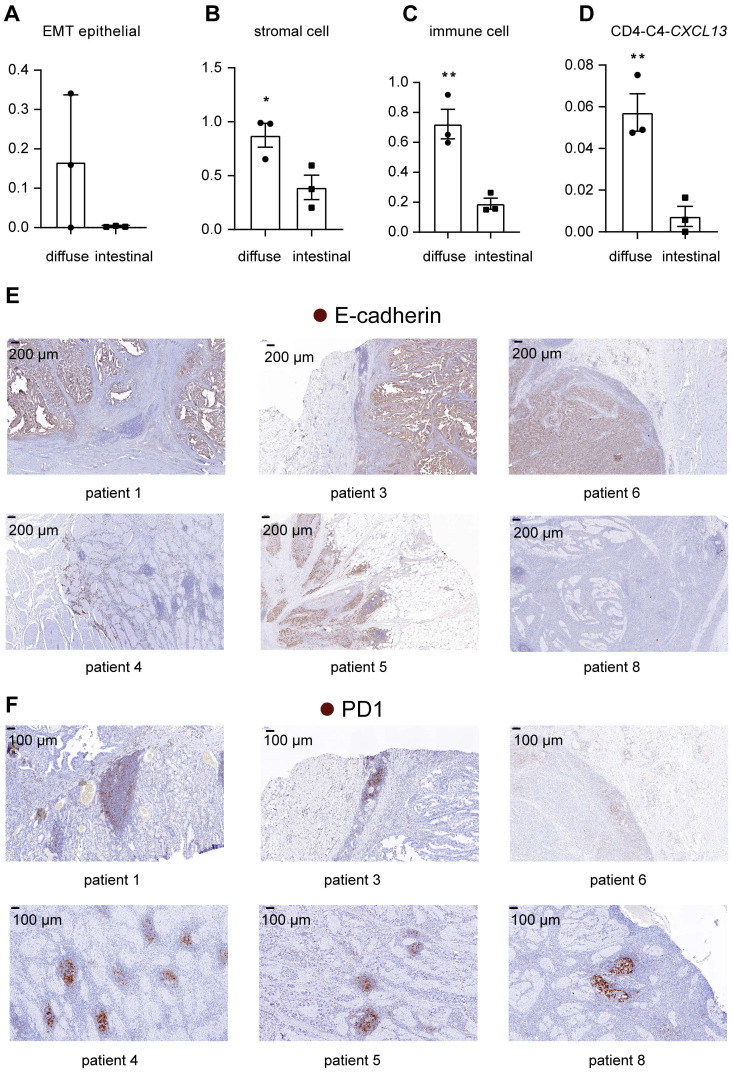
Background: The protumor activities of cancer-associated fibroblasts (CAFs) suggest that they are potential therapeutic targets for the treatment of cancer. The mechanism of CAF heterogeneity in gastric cancer (GC) remains unclear and has slowed translational advances in targeting CAFs. Therefore, a comprehensive understanding of the classification, function, activation stage, and spatial distribution of the CAF subsets in GC is urgently needed. Methods: In this study, the characteristics of the CAF subsets and the dynamic communication among the tumor microenvironment (TME) components regulated by the CAF subsets were analyzed by performing single-cell RNA sequencing of eight pairs of GC and adjacent mucosal (AM) samples. The spatial distribution of the CAF subsets in different Lauren subtypes of GC, as well as the neighborhood relations between these CAF subsets and the protumor immune cell subsets were evaluated by performing multistaining registration. Results: Tumor epithelial cells exhibited significant intratumor and intertumor variabilities, while CAFs mainly exhibited intratumor variability. Moreover, we identified four CAF subsets with different properties in GC. These four CAF subsets shared similar properties with their resident fibroblast counterparts in the adjacent mucosa but also exhibited enhanced protumor activities. Additionally, two CAF subsets, inflammatory CAFs (iCAFs) and extracellular matrix CAFs (eCAFs), communicated with adjacent immune cell subsets in the GC TME. iCAFs interacted with T cells by secreting interleukin (IL)-6 and C-X-C motif chemokine ligand 12 (CXCL12), while eCAFs correlated with M2 macrophages via the expression of periostin (POSTN). eCAFs, which function as a pro-invasive CAF subset, decreased the overall survival time of patients with GC. Conclusions: iCAFs and eCAFs not only exhibited enhanced pro-invasive activities but also mobilized the surrounding immune cells to construct a tumor-favorable microenvironment. Therefore, inhibiting their activation restrains the GC 'seed' and simultaneously improves the 'GC' soil, suggesting that it represents a promising therapeutic strategy for the treatment of GC.

Keywords: CAF heterogeneity; Gastric cancer; Multistaining registration; Tumor microenvironment; eCAF; iCAF; scRNA-Seq.


Conflict of interest statement

Competing Interests: The authors have declared that no competing interest exists.

Figures

Figure 1
Figure 1
Overview of the single cells isolated from eight primary gastric cancer (GC) lesions and matching adjacent mucosal (AM) samples. A. Summary of the workflow used to collect the specimens and perform single-cell transcriptome sequencing in the tumor microenvironment (TME) of GC. B. Uniform Manifold Approximation and Projection (UMAP) plot of the analyzed single cells. Each color represents one cluster. Annotated cell types are listed below. C. UMAP plot color-coded (gray to blue) to represent the expression levels of the marker genes for the seven cell types, which are listed beyond the UMAP plot. D. The distribution of cells derived from different patients or different sample origins. E. UMAP clustering of the 36,897 cells, with each color representing a different stage of the cell cycle.
Figure 2
Figure 2
Heterogeneity in the gene expression of GC-associated epithelial cells. A. UMAP visualization of 11,187 epithelial cells. Each color represents one cluster (see cluster ID panel). “endocrine cell” represents “enteroendocrine cell”. B. UMAP plot and bar plot of epithelial cells. Colors represent sample origins, either tumor-derived (Clusters 0, 1, 6, 9, 10, 12, 14, and 15) or AM-derived samples. C. The distribution of different epithelial cell subgroups derived from the tumor samples or AM samples from different patients. P1-P8 represent patient 1-patient 8. Colors represent the epithelial cell subgroups. D. Heatmap showing the expression levels of various partial epithelial-to-mesenchymal transition (p-EMT) genes in different clusters. E. p-EMT signature scores for tumor and normal cells. F. p-EMT signature scores across all clusters.
Figure 3
Figure 3
Clusters of endothelial cells in eight pairs of gastric tumor and adjacent normal samples. A. UMAP plot color-coded for 13 clusters of endothelial cells. 'EndMT' refers to EndMT cells. B. UMAP plot color-coded (gray to blue) to represent the expression levels of the marker genes: lymphatic endothelial cells, podoplanin (PDPN); blood endothelial cells, fms-related receptor tyrosine kinase 1 (FLT1); tumor samples (n = 8); AM samples (n = 8). C. Enriched Gene Ontology (GO) terms for the genes that were differentially expressed between the tumor-derived and AM-derived blood endothelial cells. P values are shown (from gray to red). D-F. Violin plot showing the distribution of collagen type I alpha 1 chain (COL1A1), collagen type I alpha 2 chain (COL1A2) and actin alpha 2 (ACTA2) among the different clusters. G. Images of immunofluorescence staining of representative GC tumors with antibodies against von Willebrand factor (VWF) (red) and alpha-smooth muscle actin (α-SMA) (green). Scale bar, 100 μm. H-I. Pseudotime analysis of endothelial cells and fibroblast cells derived from tumor samples inferred by Monocle2. Each point corresponds to one single cell. Each color represents one cell subgroup (H). Each color represents one cell state (I).
Figure 4
Figure 4
Fibroblast clusters in the GC and AM samples. A. UMAP plot showing 14 clusters of fibroblast cells colored according to different clusters identified here. B. UMAP plot of the tumor-derived and AM-derived fibroblast cells: tumor samples (n = 8) and AM samples (n = 8). Bar chart showing the composition by sample origin as the total percentage of each cell type per sample. The X-axis represents the cell proportion, and the Y-axis represents clusters. C. Heatmap showing the selected significant terms for the genes differentially expressed in the four subgroups of tumor-derived fibroblasts. Colors represent the P values (from white to orange). 'Myo' represents myofibroblasts. 'Peri' represents pericytes. D. Heatmap of the expression levels of the genes associated with invasion, cell migration, and extracellular matrix remodeling in different clusters of fibroblast cells. E. Overall survival curves of the patients with stomach cancer in The Cancer Genome Atlas (TCGA), stratified by the mRNA expression levels of the POSTN gene. The red line shows the survival curve of the patients exhibiting high POSTN expression levels in the tumor samples (for the top 30% of all samples); the blue line shows the survival curve of the remaining patients (P value = 0.001). F. Hematoxylin and eosin (H&E) staining and immunohistochemical staining for cluster of differentiation (CD)-34 (marker of iCAFs) in tumor tissues from patient 6 (scale bar, 50 μm). Upper right panel: CD34-positive staining in the tumor gland (T). Lower right panel: CD34-positive staining in the lymphoid nodule-like structure (LN). Arrows indicate the positive staining for CD34. G. Heatmap showing the density of positive staining for CD34 and COL1A1 in the tumor tissues from patient 6. The area inside the yellow line represents the tumor gland (T). The area inside the blue line indicates the lymphoid nodule-like structure (LN). The remaining area is the stroma (S). H. Tumor sections from patients with intestinal-type and diffuse-type GC showing how periostin-positive cells are distributed in the tumor gland (T), invasive front (IF) and distal stroma (S). Cells were stained for periostin in tumor tissues from patient 1 and patient 5. Arrows indicate the positive staining. I. Proportions of the periostin-positive area in the tumor gland (T), invasive front (IF) and distal stroma (S). Upper panel: Proportion in each patient with intestinal-type GC. The P value was calculated based on the paired t test (P = 0.0377). Lower panel: Proportion in each patient with diffuse-type GC. The P value was calculated based on the paired t test (P = 0.0464).
Figure 5
Figure 5
T cell clusters in tumor samples and AM samples. A. UMAP plot of T cells showing 14 clusters annotated in different colors. B. Heatmap of marker gene expression in each annotated cell subgroup. C. Heatmap showing the density of positive staining for CD8 and PD1 and IHC staining for CD8 and PD1 in the tumor tissue from patient 6 (intestinal-type). D. Heatmap showing the density of positive staining for CD8 and PD1 and IHC staining for CD8 and PD1 in the tumor tissue from patient 5 (diffuse-type).
Figure 6
Figure 6
Communication among tumor microenvironment components. A-B. Heatmap showing interactions between fibroblast subgroups and immune cells (A) or other stromal cells (B). The color represents the number of interactions (blue to red); n=8 tumors. C. Selected specific interactions between CAF subgroups and immune cells in tumors. The size indicates the p values, and the color indicates the mean values of the receptor/ligand pairs between two clusters. D. IHC staining and pseudofluorescence synthesized by multistaining registration for CD8, PD1, CD34, and COL1A1 in the tumor tissue from patient 6. The box indicates adjacent cells. E. Images of IHC staining and pseudofluorescence synthesized by multistaining registration for E-cadherin, CD163, periostin, and COL1A1 in the tumor tissue from patient 6. The box indicates adjacent cells. F. Immunofluorescence staining for COL1A1 and periostin in the fifth generation of CAFs. G. Crystal violet staining of M2 macrophages in response to MSCs and CAFs. Bar plot showing the average crystal violet-stained area in Transwells calculated using ImageJ software. The p value was calculated using the unpaired t test (P value = 0.0038). H. Western blot results showing a comparison of the periostin and GAPDH bands between MSCs and CAFs. I. Western blot results showing a comparison of the periostin and GAPDH bands between NC-MSCs and periostin-overexpressing MSCs. J. Crystal violet staining of M2 macrophages that were recruited in response to NC-MSCs and periostin-overexpressing MSCs. Bar plots showing the average crystal violet-stained area in the Transwells calculated using ImageJ software. The p value was calculated using the unpaired t test (P value = 0.0004).
Figure 7
Figure 7
Comparison of cell subgroup fractions between two histopathological types of gastric cancer. A. Fraction of EMT epithelial cells relative to total nonimmune cells in 6 tumor samples. B. Fraction of all stromal cells relative to the total cells in 6 tumor samples. “*” represents a p value<0.05; unpaired Student's t test. C. Fraction of immune cells relative to total cells in 6 tumor samples. “**” represents a p value<0.01; unpaired Student's t test. D. Fraction of CD4-C4-CXCL13 cells relative to the total immune cells in 6 tumor samples. “**” represents a p value<0.01; unpaired Student's t test. E. IHC staining for E-cadherin in tumor tissues from patients with intestinal-type GC (patients 1, 3 and 6) and diffuse-type GC (patients 4, 5 and 8). F. IHC staining for PD1 in tumor tissues from patients with intestinal-type GC (patients 1, 3 and 6) and diffuse-type GC (patients 4, 5 and 8).

References

    1. Sung H, Ferlay J, Siegel R L, Laversanne M, Soerjomataram I, Jemal A. et al. Global Cancer Statistics 2020: GLOBOCAN Estimates of Incidence and Mortality Worldwide for 36 Cancers in 185 Countries. CA Cancer J Clin. 2021;71:209–49. - PubMed
    1. Smyth E C, Nilsson M, Grabsch H I, van Grieken N C, Lordick F. Gastric cancer. Lancet. 2020;396:635–48. - PubMed
    1. Wu X, Gu Z, Chen Y, Chen B, Chen W, Weng L. et al. Application of PD-1 Blockade in Cancer Immunotherapy. Comput Struct Biotechnol J. 2019;17:661–74. - PMC - PubMed
    1. Lauren P. THE TWO HISTOLOGICAL MAIN TYPES OF GASTRIC CARCINOMA: DIFFUSE AND SO-CALLED INTESTINAL-TYPE CARCINOMA. AN ATTEMPT AT A HISTO-CLINICAL CLASSIFICATION. Acta Pathol Microbiol Scand. 1965;64:31–49. - PubMed
    1. Ansari S, Gantuya B, Tuan V P, Yamaoka Y. Diffuse Gastric Cancer: A Summary of Analogous Contributing Factors for Its Molecular Pathogenicity. Int J Mol Sci. 2018. 19. - PMC - PubMed

Publication types