. 2022 Jan 1;12(2):842-858.
doi: 10.7150/thno.66575. eCollection 2022.

FcγRIIB potentiates differentiation of myeloid-derived suppressor cells to mediate tumor immunoescape

Affiliations

FcγRIIB potentiates differentiation of myeloid-derived suppressor cells to mediate tumor immunoescape

Lei Wu et al. Theranostics. .

Abstract

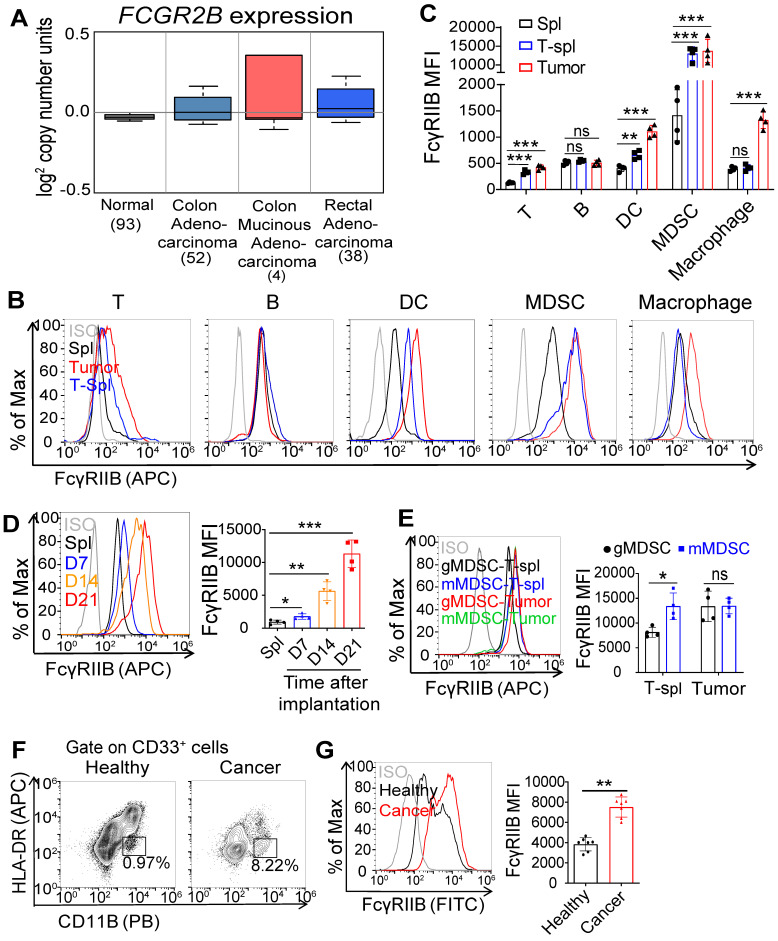
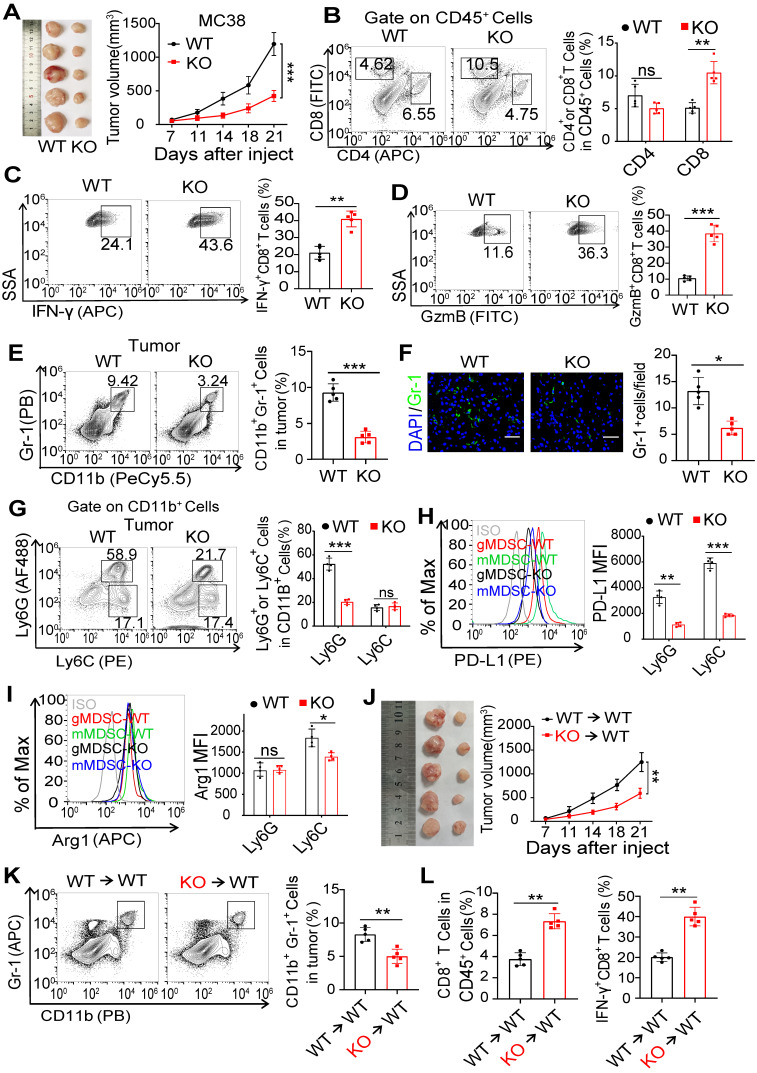
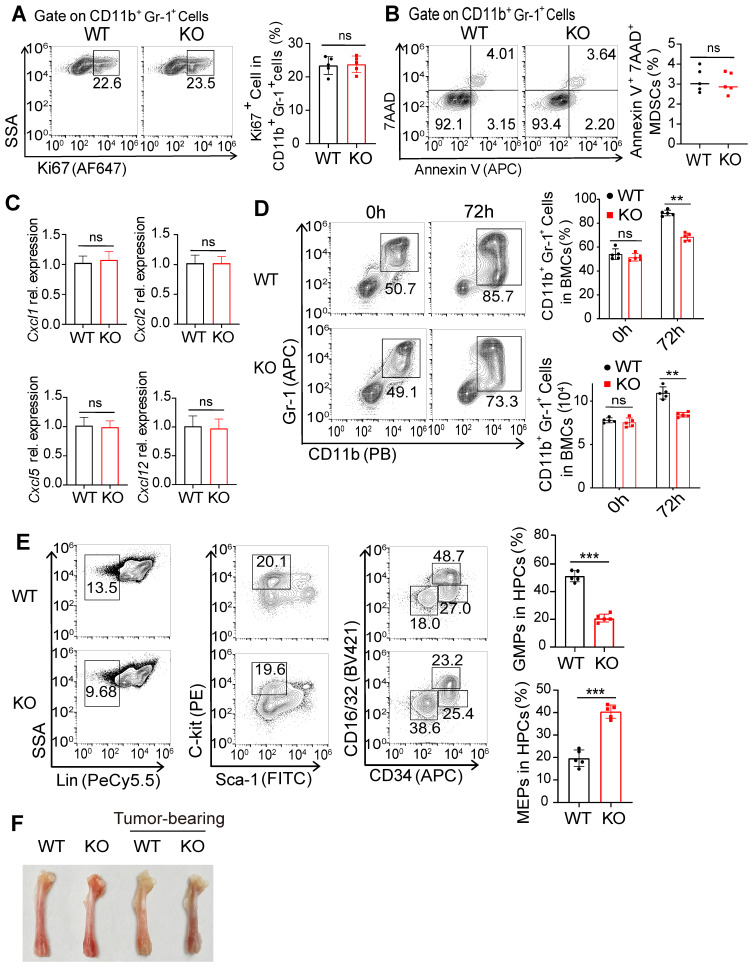
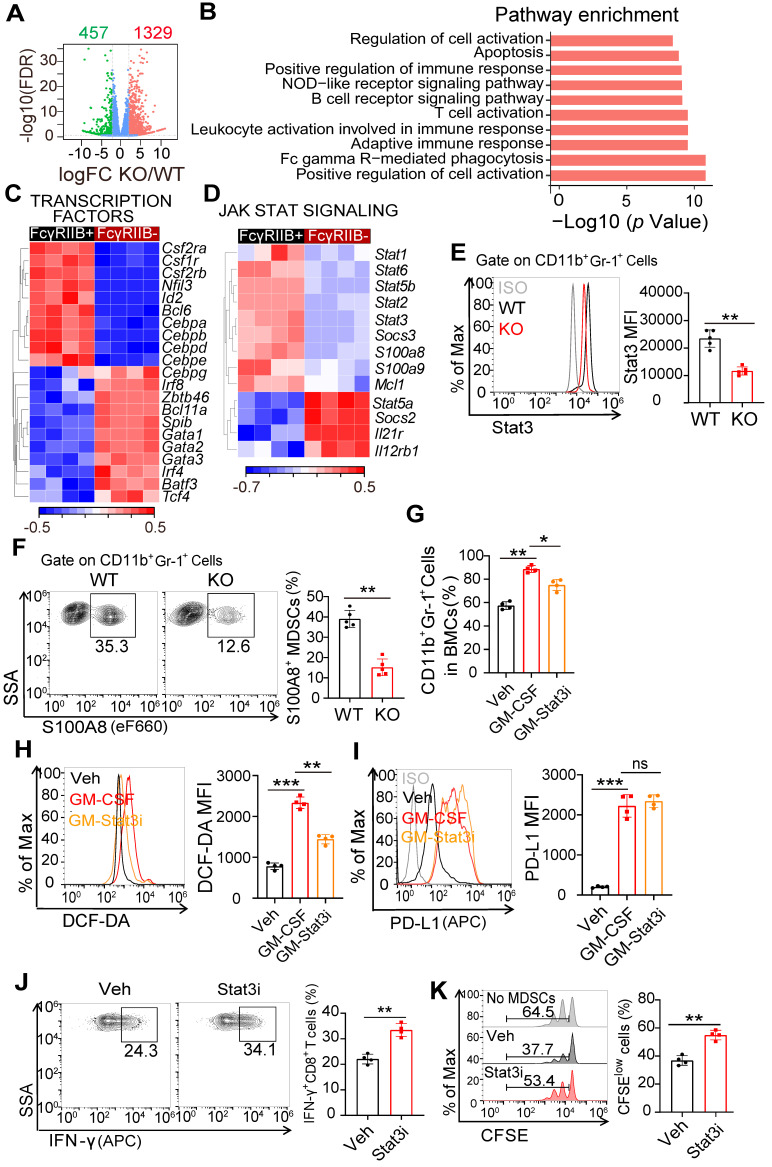
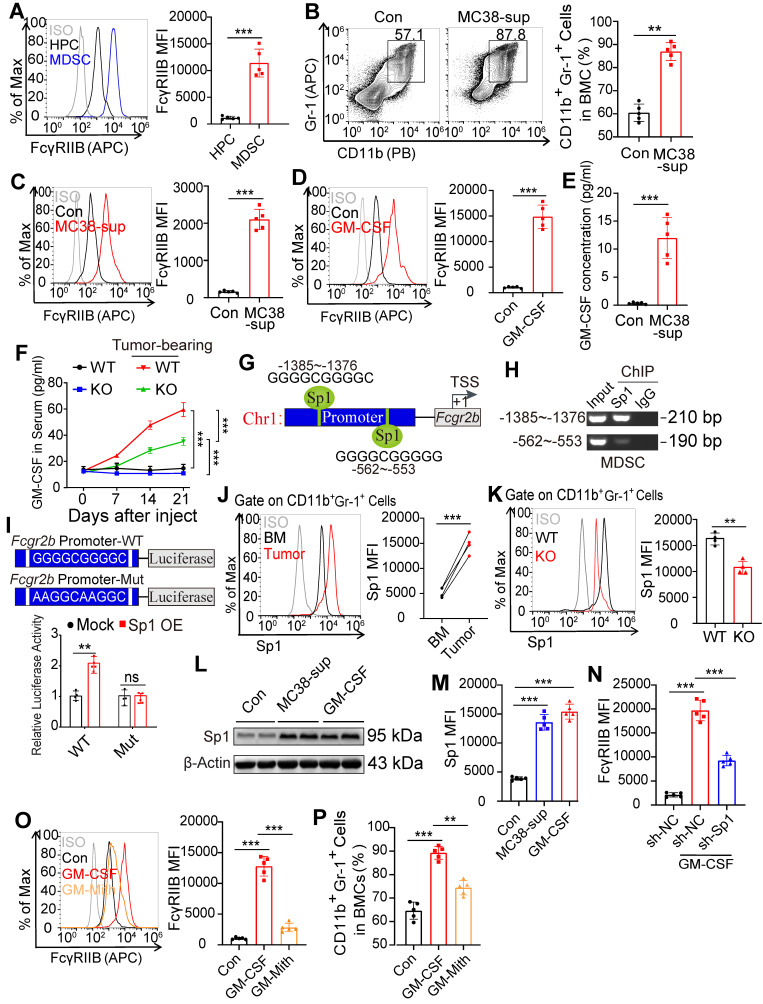
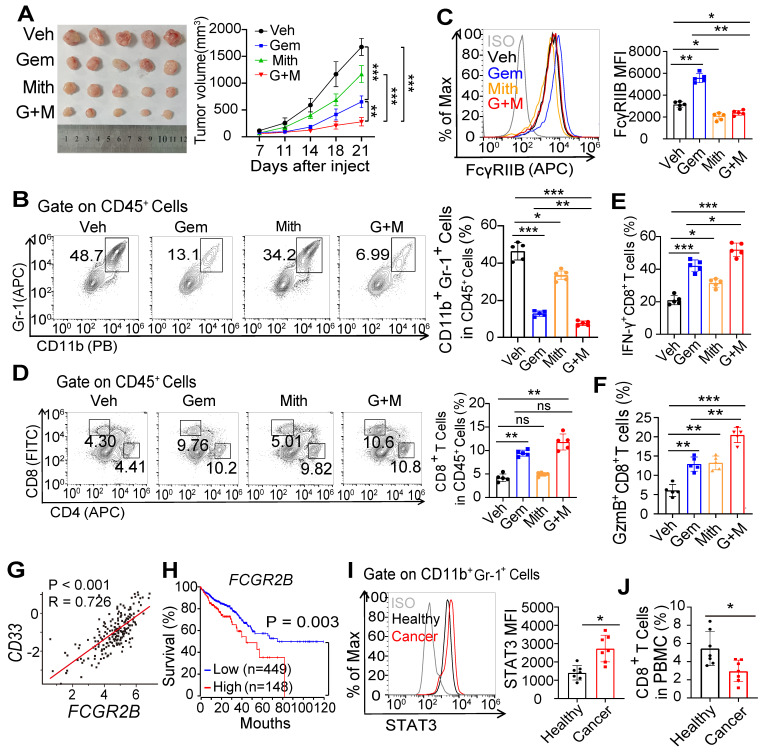
Background: FcγRIIB, the sole inhibitory receptor of the Fc gamma receptor family, plays pivotal roles in innate and adaptive immune responses. However, the expression and function of FcγRIIB in myeloid-derived suppressor cells (MDSCs) remains unknown. This study aimed to investigate whether and how FcγRIIB regulates the immunosuppressive activity of MDSCs during cancer development. Methods: The MC38 and B16-F10 tumor-bearing mouse models were established to investigate the role of FcγRIIB during tumor progression. FcγRIIB-deficient mice, adoptive cell transfer, mRNA-sequencing and flow cytometry analysis were used to assess the role of FcγRIIB on immunosuppressive activity and differentiation of MDSCs. Results: Here we show that FcγRIIB was upregulated in tumor-infiltrated MDSCs. FcγRIIB-deficient mice showed decreased accumulation of MDSCs in the tumor microenvironment (TME) compared with wild-type mice. FcγRIIB was required for the differentiation and immunosuppressive activity of MDSCs. Mechanistically, tumor cell-derived granulocyte-macrophage colony stimulating factor (GM-CSF) increased the expression of FcγRIIB on hematopoietic progenitor cells (HPCs) by activating specificity protein 1 (Sp1), subsequently FcγRIIB promoted the generation of MDSCs from HPCs via Stat3 signaling. Furthermore, blockade of Sp1 dampened MDSC differentiation and infiltration in the TME and enhanced the anti-tumor therapeutic efficacy of gemcitabine. Conclusion: These results uncover an unrecognized regulatory role of the FcγRIIB in abnormal differentiation of MDSCs during cancer development and suggest a potential therapeutic target for anti-tumor therapy.

Keywords: Fc gamma receptor IIB; Sp1 signaling; anti-tumor therapy; granulocyte-macrophage colony stimulating factor; immunosuppression; myeloid-derived suppressor cells; tumor microenvironment.


Conflict of interest statement

Competing Interests: The authors have declared that no competing interest exists.

Figures

Figure 1
Figure 1
Increased FcγRIIB expression on tumor-infiltrating MDSCs. (A) Gene expression of FCGR2B in normal colon, colon adenocarcinoma, colon mucinous adenocarcinoma and rectal adenocarcinoma tissues according to Kurashina Colon cancer in Oncomine datasets. (B) Representative histogram plots of the expression of FcγRIIB in T cells, B cells, DCs, MDSCs and macrophages from splenocytes of tumor free mice (Spl), MC38 tumor tissues (Tumor) and splenocytes of tumor bearing mice (T-Spl), ISO, isotype control. (C) The expression of FcγRIIB for T cells, B cells, DCs, MDSCs and macrophages, as shown in (B), MFI is shown, n = 4. (D) The expression of FcγRIIB for MDSCs (CD11b+Gr1+) in the splenocytes of 100 μL PBS injected C57BL/6 mice for 21days (Spl) or MC38 tumor tissues were quantified at different time points (7, 14 and 21days) after MC38 tumor cell inoculation (n = 4). (E) FcγRIIB expression in gMDSCs (CD11b+Ly6G+Ly6Clow) and mMDSCs (CD11b+Ly6ChighLy6G-) from the MC38 tumor bearing spleens (T-spl) or MC38 tumor tissues were measured by FCM, n = 4. (F, G) Representative flow cytometry plots (E) and FcγRIIB expression (F) of MDSCs in the peripheral blood of patients with CRC versus healthy donors (n = 7). Data are expressed as means ± SD. *P < 0.05, **P < 0.01, ***P < 0.001, Mann-Whitney test were used for all comparisons, ns, no significant difference.
Figure 2
Figure 2
FcγRIIB deficiency in MDSCs inhibits tumorigenesis. (A) C57BL/6 (WT) or FcγRIIB-/- (KO) mice were injected subcutaneously with 106 MC38 cells. Tumor growth was monitored at indicated time points, n = 5. (B) WT or KO mice were sacrificed at day 14 post-xenograft of MC38 cells and tumors were analyzed by FCM for the frequency of CD4+ and CD8+ T cells. Shown data are representative from two independent experiments, n = 5 per group. (C, D) The frequency of IFN-γ-producing (C) and GzmB-producing (D) CD8+ T cells in the MC38 tumor from WT and FcγRIIB-KO mice were determined by FCM. (E) The frequency of tumor-infiltrating MDSCs in WT or KO tumor was assessed 14 days after MC38 tumor inoculation. (F) The expression of Gr-1 (green) in MC38 tumor tissue sections from WT or KO mice was detected by immunofluorescence. Scale bars: 50 μm. (G) gMDSCs and mMDSCs frequency in CD11b+ cells from WT or KO tumor tissues were analyzed by FCM. (H, I) PD-L1 (H) and Arg1 (I) expression in gMDSCs and mMDSCs from WT or KO tumor tissues were analyzed by FCM; n = 4. (J-L), Irradiated WT mice (CD45.1) were i.v. injected with WT (CD45.2) or FcγRIIb-/- (CD45.2) BM Cells for BM reconstitution assay. Six weeks after BM chimaera reconstitution, mice were injected subcutaneously with 1 × 10⁶ MC38 cells. Tumor size was monitored over time (J), n = 5; The frequency of tumor-infiltrating MDSCs, n = 5 (K), CD8+ T cells and IFN-γ-producing CD8+ T cells, n = 5 (L) in tumor from BM chimeric mice was assessed. Data are expressed as means ± SD. *P < 0.05, **P < 0.01, ***P < 0.001, by Mann-Whitney test.
Figure 3
Figure 3
FcγRIIB deficiency suppresses the immunosuppressive activity and differentiation of MDSCs. (A) iNOS and Arg1 expression in WT and KO MDSCs from MC38 tumors were assessed using FCM; n = 5. (B, C) PD-L1 (B) and DCF-DA (C) expression in WT and KO MDSCs; n = 5. (D-F) Isolated MDSCs from MC38 tumors of WT and KO mice were cocultured with CFSE-labeled CD8+ T lymphocytes isolated from WT mice (1:2) for 3 days, the production of IFN-γ (D), and GzmB (E) in CD8+ T cells, anti-CD3 and anti-CD28 induced proliferation (F) were measured by FCM; n = 4. Data are expressed as means ± SD. *P < 0.05, **P < 0.01, ns, no significant difference, by Mann-Whitney test.
Figure 4
Figure 4
FcγRIIB deficiency impairs the differentiation of gMDSCs from HPCs in the tumor-bearing mice. (A) The percentage of proliferating (Ki67+) MDSCs in WT and KO tumor tissues were analyzed with flow cytometry after Ki67 staining, n = 5. (B) Representative staining and frequencies of AnnexinV+7AAD+ cells in MDSCs from WT and KO tumor tissues were assessed by FCM. (C) The gene expression of MDSC-related chemokines within whole tumor tissues from WT and KO mice were detected by qPCR; n = 4. Data are expressed as means ± SD. (D) WT and KO BMs were treated with GM-CSF/IL-6 (20ng/mL) to induce MDSCs differentiation, MDSCs ratio and numbers were analyzed after 72 hrs. (E) Gating strategy for granulocyte/macrophage progenitors (GMP; Lin-Sca-1-C-kit+CD16/32+CD34+), common myeloid progenitors (CMP; Lin-Sca-1-C-kit+CD16/32intCD34+), megakaryocyte/erythrocyte progenitors (MEP; Lin-Sca-1-C-kit-CD16/32-CD34-), and percentages of these HPCs subpopulations rates in BMs from WT and KO tumor bearing mice were detected, n = 5. (F) Representative photograph of femurs dissected from WT and KO tumor-free or MC38 tumor-bearing mice on day 21 after tumor cells implantation. Data are expressed as means ± SD. *P < 0.05, **P < 0.01, ***P < 0.001, ns, no significant difference, by Mann-Whitney test.
Figure 5
Figure 5
FcγRIIB promotes gMDSCs generation from HPCs via Stat3 signaling. (A) Volcano plots of differentially expressed genes in HPCs from WT or FcγRIIB KO mice at 14 days post-grafting of MC38 cells (adjusted P ≤ 0.01 and fold change (FC) ≥ 2), n = 4. (B) Signaling pathway enrichment analysis of differentially expressed genes. (C) Heatmap of differentially expressed genes that function as transcription factors involved in differentiation of HPCs into GMPs, n = 4. (D) Heatmap of differentially expressed genes in Jak-Stat signaling from WT or FcγRIIB KO HPCs, n = 4. (E, F) WT or KO Mice were sacrificed at day 14 post-grafting, and tumor-infiltrating MDSCs were assessed for Stat3 (E) and S100A8 (F) expression; n =5. (G) WT mice BMs were treated with Veh (PBS), GM-CSF (20ng/mL) for 48 hrs, in the presence or absence of STAT3-IN-1 (GM-Stat3i, 1μM), and MDSCs proportion were analyzed. (H, I) Isolated Gr-1+ cells from BM were treated with GM-CSF (20ng/mL) for 48 hrs, in the presence or absence of STAT3-IN-1 (GM-Stat3i, 1μM), DCF-DA (H) and PD-L1 (I) expression were assessed using FCM; n = 4. (J, K) BM derived MDSCs were treated with STAT3-IN-1 (GM-Stat3i, 1μM) for 48 hrs, and then cocultured with CFSE-labeled CD8+ T lymphocytes isolated from WT mice (1:2) for 3 days, the production of IFN-γ in CD8+ T cells (J, n = 4), anti-CD3 and anti-CD28 induced proliferation (K, n = 4) were measured by FCM; n = 4. Data are expressed as means ± SD. **P <0.01, by Mann-Whitney test.
Figure 6
Figure 6
GM-CSF induces FcγRIIB expression on MDSCs via Sp1 signaling. (A) FcγRIIB expression on HPCs and tumor-infiltrating MDSCs were analyzed, representative histogram plots were shown. (B, C) WT and KO BM cells were treated with 10% tumor supernatants (from MC38 cells) for 48 hrs, the percentage of CD11b+Gr-1+ cells in BM cells (B), FcγRIIB expression on MDSCs (C) was determined. (D) WT mice BM cells were treated with PBS (Control) or GM-CSF (20 nM) for 48 hrs, the expression of FcγRIIB were determined with flow cytometry. (E) GM-CSF protein levels in supernatants of MC38 tumor were measured using ELISA, n =5. (F) GM-CSF protein levels in serum of tumor-free or MC38 tumor-bearing WT and FcγRIIb-/- mice were measured using ELISA, n = 4 each group. (G) In silico analysis predicted two Sp1 binding site in the promoter of Fcgr2b, TSS; transcription start site. (H) ChIP assay analyzed recruitment of Sp1 to Fcgr2b gene locus in WT MDSCs. The prepared chromatin from MDSCs was immunoprecipitated with an anti-Sp1 antibody or control IgG, and pulled-down DNA was subjected to qPCR using the specific primers designed for Sp1 binding region. (I) Luciferase report assay of Fcgr2b promoter containing WT or mutant Sp1 binding site in Sp1 overexpression HPCs. (J) Sp1 expressions in CD11b+Gr-1+ cells from BM and paired tumor were measured by FCM, n = 5. (K) Sp1 expression in WT and KO MDSCs were measured by FCM, n = 4. (L, M) CD11b+Gr-1+ cells from BM were treated with 10% tumor supernatants or GM-CSF (20 nM) for 48 h, the expression of Sp1 was determined by western blot (L) and FCM (M), n = 5. (N) CD11b+Gr-1+ cells from BM were transfected with control (sh-NC) or virus expressing shRNA against Sp1 (sh-Sp1), in the presence or absence of 20 nM GM-CSF for 48 hrs, FcγRIIB expression on MDSCs were analyzed. (O, P) BM cells were treated with GM-CSF for 48 hrs, in the presence or absence of 1 μL PBS (Con) or Mithramycin A (Mith, 20 nM), FcγRIIB expression on MDSCs (O) and the percentages of MDSCs (P) in BM cells were analyzed by FCM. Data are expressed as means ± SD. **P <0.01, by Mann-Whitney test (A to F, I, K to P) or Wilcoxon matched-pairs signed rank test (J).
Figure 7
Figure 7
Inhibition of FcγRIIB expression improves the anti-tumor effect of gemcitabine. (A-C) WT mice were injected subcutaneously with MC38 tumor cell. After 7 days, tumor-bearing mice were injected with PBS (Veh), gemcitabine (Gem, 50 mg/kg), Mithramycin A (Mith, 0.2mg/kg) or combined Gem with Mith (G+M). Tumor growth was monitored for 21 days (A). All mice were euthanized on day 21 after tumor injection, the percentages of MDSCs (B) and FcγRIIB expression on MDSCs (C) in tumor tissues were analyzed by FCM. (D-F) The percentages of CD8+ T cells in tumor tissues (D), the percentage of CD8+ T cells producing IFN-γ (E) and GzmB (F) in tumor tissues were analyzed by FCM. (G) Pearson's correlation coefficient was used to determine the correlation between FCGR2B and CD33. (H) Colon adenocarcinoma patient survival data were obtained from TCGA database, and overall survival probability was calculated using the Kaplan-Meier analysis, and the differences in survival curves were assessed using the log-rank test. (I, J) STAT3 expression in MDSCs (I) and CD8+ T cells percentages (J) in peripheral blood of patients with CRC versus healthy donor were analyzed by FCM, n = 7. Data are shown as means ± SD. One way ANOVA with Tukey multiple comparison post-test was used to evaluate statistical significance. *P < 0.05, **P < 0.01, ***P < 0.001. ns, no significant difference.

Similar articles

Cited by

References

    1. Gabrilovich DI, Nagaraj S. Myeloid-derived suppressor cells as regulators of the immune system. Nat Rev Immunol. 2009;9:162–74. - PMC - PubMed
    1. Rooney MS, Shukla SA, Wu CJ, Getz G, Hacohen N. Molecular and genetic properties of tumors associated with local immune cytolytic activity. Cell. 2015;160:48–61. - PMC - PubMed
    1. Kramer ED, Abrams SI. Granulocytic Myeloid-Derived Suppressor Cells as Negative Regulators of Anticancer Immunity. Front Immunol. 2020;11:1963. - PMC - PubMed
    1. Liu CY, Wang YM, Wang CL, Feng PH, Ko HW, Liu YH. et al. Population alterations of L-arginase- and inducible nitric oxide synthase-expressed CD11b+/CD14(-)/CD15+/CD33+ myeloid-derived suppressor cells and CD8+ T lymphocytes in patients with advanced-stage non-small cell lung cancer. J Cancer Res Clin Oncol. 2010;136:35–45. - PMC - PubMed
    1. Diaz-Montero CM, Salem ML, Nishimura MI, Garrett-Mayer E, Cole DJ, Montero AJ. Increased circulating myeloid-derived suppressor cells correlate with clinical cancer stage, metastatic tumor burden, and doxorubicin-cyclophosphamide chemotherapy. Cancer Immunol Immunother. 2009;58:49–59. - PMC - PubMed

Publication types