. 2022 Jan 1;12(2):859-874.
doi: 10.7150/thno.66274. eCollection 2022.

Extracellular ATP is increased by release of ATP-loaded microparticles triggered by nutrient deprivation

Affiliations

Extracellular ATP is increased by release of ATP-loaded microparticles triggered by nutrient deprivation

Valentina Vultaggio-Poma et al. Theranostics. .

Abstract

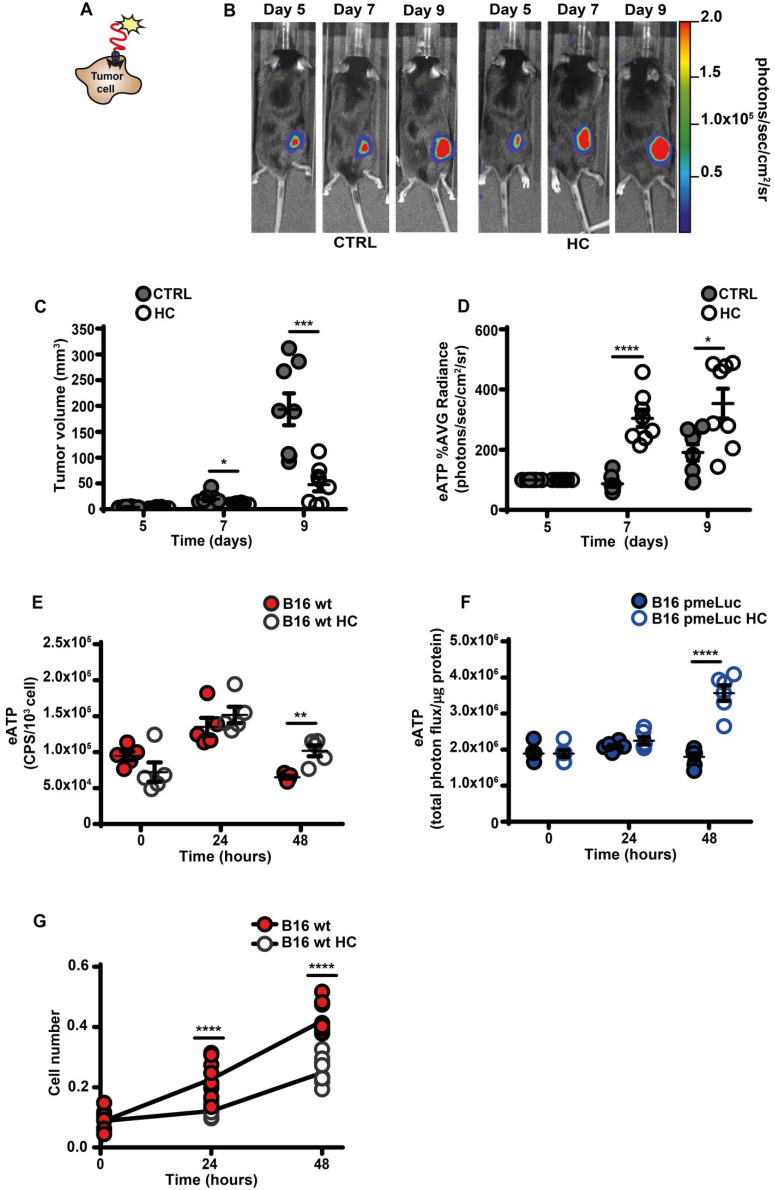
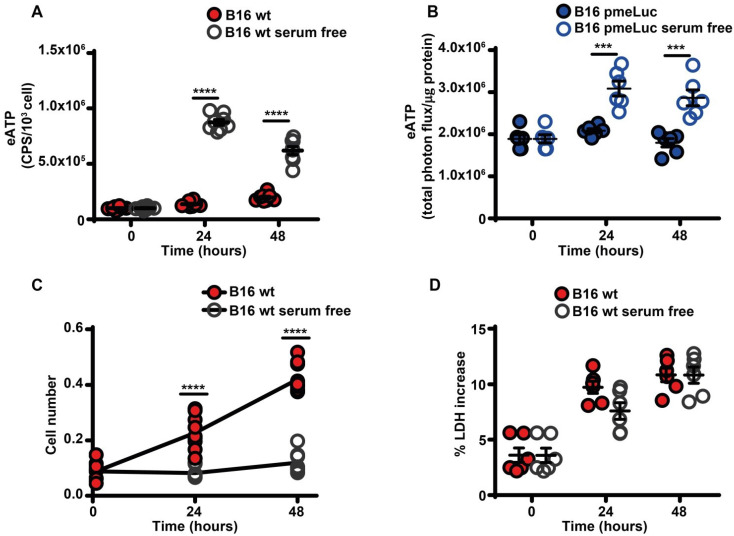
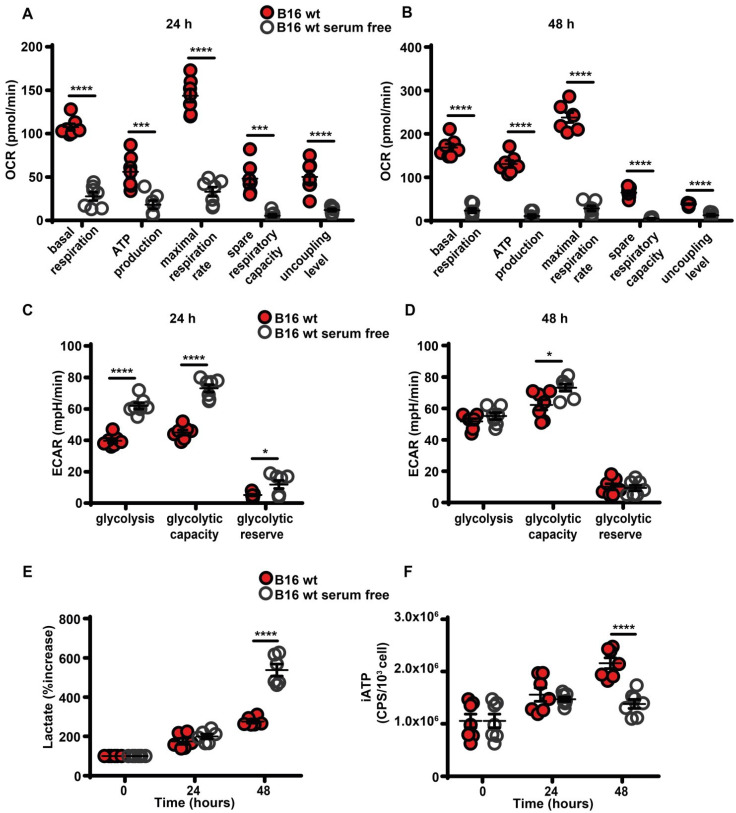
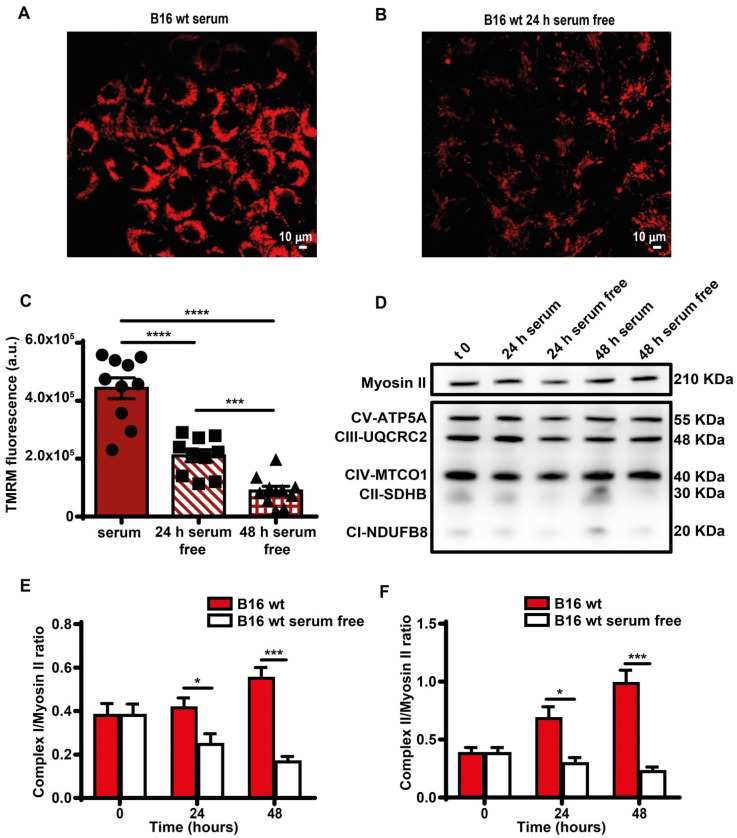
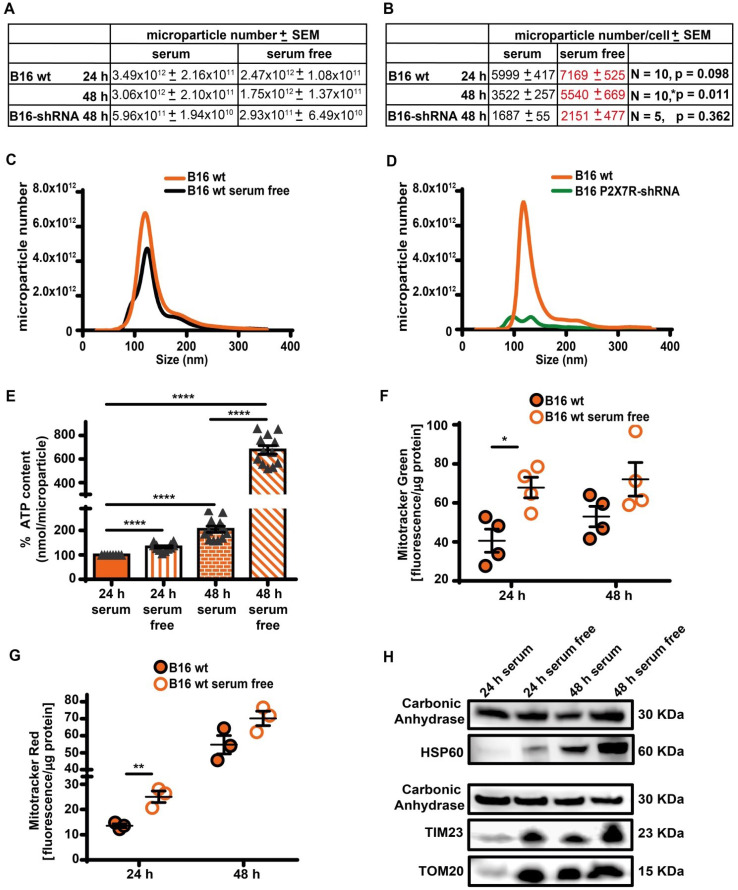
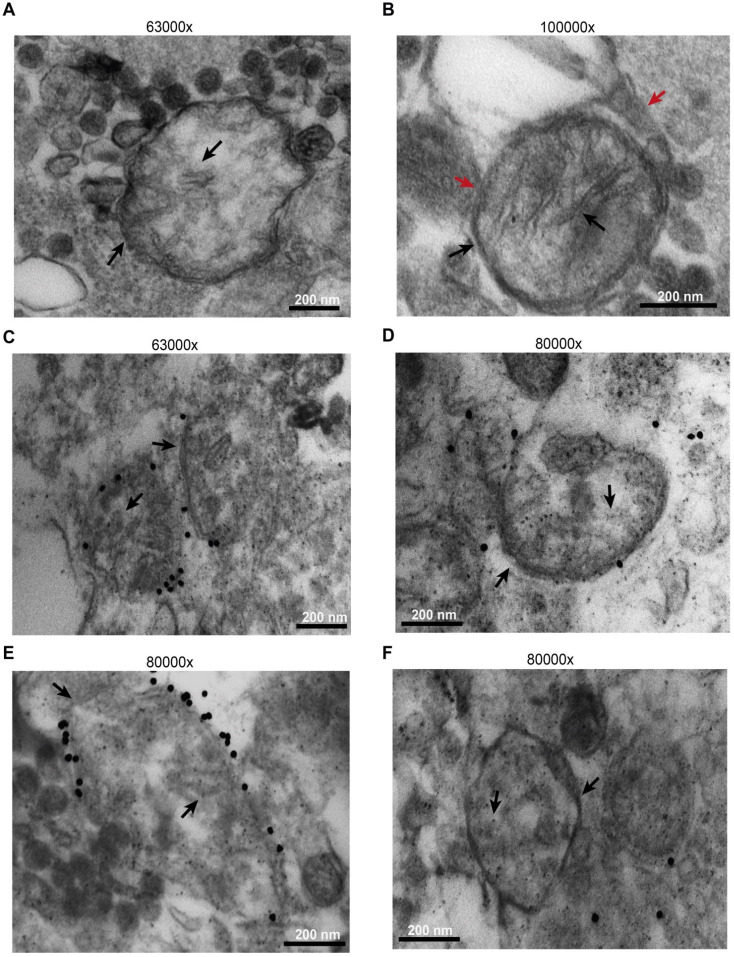
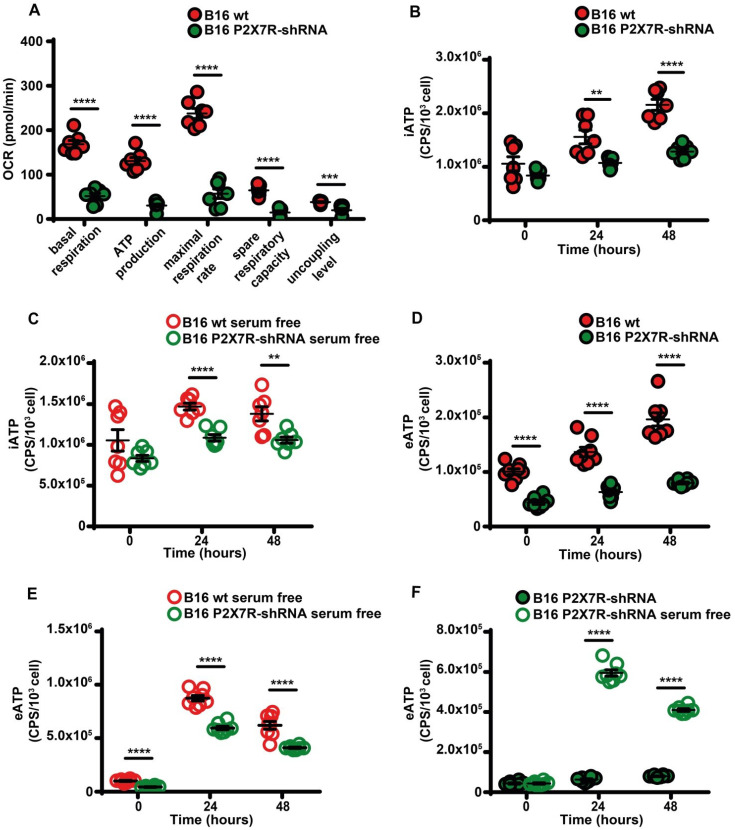
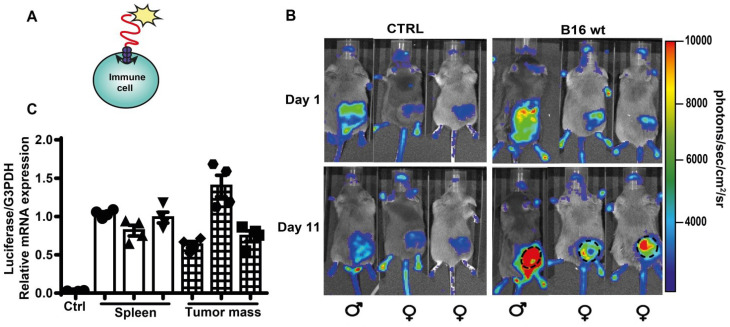
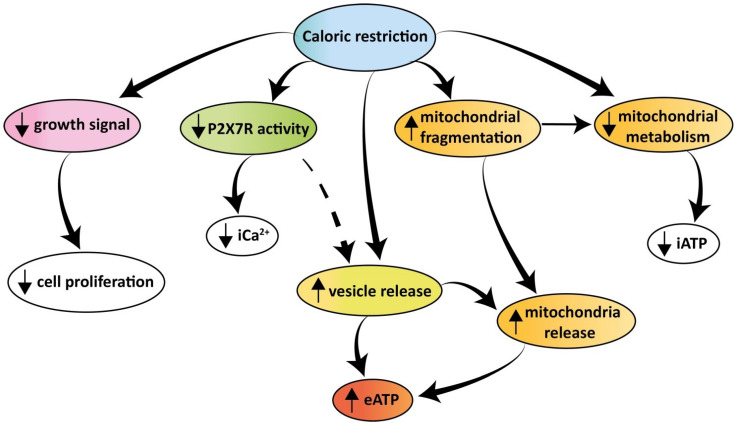
Rationale: Caloric restriction improves the efficacy of anti-cancer therapy. This effect is largely dependent on the increase of the extracellular ATP concentration in the tumor microenvironment (TME). Pathways for ATP release triggered by nutrient deprivation are largely unknown. Methods: The extracellular ATP (eATP) concentration was in vivo measured in the tumor microenvironment of B16F10-inoculated C57Bl/6 mice with the pmeLuc probe. Alternatively, the pmeLuc-TG-mouse was used. Caloric restriction was in vivo induced with hydroxycitrate (HC). B16F10 melanoma cells or CT26 colon carcinoma cells were in vitro exposed to serum starvation to mimic nutrient deprivation. Energy metabolism was monitored by Seahorse. Microparticle release was measured by ultracentrifugation and by Nanosight. Results: Nutrient deprivation increases eATP release despite the dramatic inhibition of intracellular energy synthesis. Under these conditions oxidative phosphorylation was dramatically impaired, mitochondria fragmented and glycolysis and lactic acid release were enhanced. Nutrient deprivation stimulated a P2X7-dependent release of ATP-loaded, mitochondria-containing, microparticles as well as of naked mitochondria. Conclusions: Nutrient deprivation promotes a striking accumulation of eATP paralleled by a large release of ATP-laden microparticles and of naked mitochondria. This is likely to be a main mechanism driving the accumulation of eATP into the TME.

Keywords: P2X7.; extracellular ATP; microparticles; nutrient deprivation; tumor microenvironment.


Conflict of interest statement

Competing Interests: FDV is a member of the Scientific Advisory Board of Biosceptre Ltd, a biotech Company involved in the development of anti-P2X7 antibodies, and a consultant with Axxam SpA. The other authors declare no conflict of interest.

Figures

Figure 1
Figure 1
Hydroxycitrate promotes ATP release from B16F10 melanoma cells and growth inhibition in vivo and in vitro. (A) Schematic rendition of pmeLUC-transfected B16F10 (B16F10-pmeLUC) cells showing plasma membrane localization of the pmeLUC probe. (B) Representative images showing luminescence emission from control (left) and hydroxycitrate (HC)-treated (right) C57Bl/6 wt mice (n = 8) inoculated with B16F10-pmeLUC cells (2.5 × 10⁵) into the right hind flank; HC, 300 mg/kg, was i.p. administered at p.i. d 5, 7 and 9. (C) Volume of tumors from control (closed circles) and HC-treated (open circles) mice assessed in vivo by calliper at the indicated time points. (D) In vivo extracellular ATP (eATP) levels in tumor-bearing mice estimated by pmeLUC luminescence average (AVG) emission (p/s/cm2/sr). Data are reported as percentage luminescence increase over d 5. (E) In vitro eATP levels measured at the indicated time points with soluble luciferase in the supernatant of B16F10 cells (5 × 10³) incubated in RPMI-1640 medium in the absence (closed red circles) or presence (open circles) of 1 mM HC. To measure ongoing eATP release rather than eATP accumulation into the cell supernatant, the incubation medium was withdrawn right before eATP measurement, and 50 μL of buffer solution supplemented with 50 μL of rLuciferase/Luciferin reagent were added to each well. CPS (counts per second) were normalized to cell content measured with crystal violet (n = 5). (F) In vitro eATP levels measured at the indicated time points in B16F10-pmeLUC monolayers (50 × 103) incubated in RPMI-1640 medium in the absence (closed blue circles) or presence (open circles) of 1 mM HC. Total photon flux was normalized to cell protein (µg) (n = 6). (G) In vitro proliferation of B16F10 cells (3 × 10³) incubated in RPMI-1640 medium in the absence (closed red circles) or presence (open circles) of 1 mM HC. Cell number was measured with crystal violet (n = 10). Data are shown as mean ± SEM. *P < 0.05; **P < 0.01; ***P < 0.001; ****P < 0.0001.
Figure 2
Figure 2
Serum deprivation causes ATP release and cell growth inhibition. (A) Extracellular ATP levels in B16F10 cells (5 × 10³) cultured in RPMI-1640 medium in the presence (closed red circles) or absence (open circles) of serum. eATP was measured with soluble luciferase. CPS (counts per second) were normalized to cell content measured with crystal violet (n = 8). (B) eATP levels measured in B16F10-pmeLUC monolayers (50 × 103) incubated in RPMI-1640 medium in the presence (closed blue circles) or absence (open circles) of serum. Total flux was normalized to cell protein (µg) (n = 6). (C) In vitro proliferation of B16F10 cells (3 × 10³) incubated in RPMI-1640 medium in the presence (closed red circles) or absence (open circles) of serum (n = 10). (D) Lactate dehydrogenase (LDH) release from B16F10 cells (10 × 103) incubated in RMPI-1640 medium in the presence (closed red circles) or absence (open circles) of serum. LDH release is shown as percentage release of total LDH cell content (n = 6). Data are shown as mean ± SEM. ***P < 0.001; ****P < 0.0001.
Figure 3
Figure 3
Serum deprivation impairs mitochondrial energy metabolism and reduces intracellular ATP levels. B16F10 cells (5-6 × 10³) were incubated in RPMI-1640 medium in the presence (closed red circles) or absence (open white circles) of serum for 24 (A and C) or 48 (B and D) h, then oxygen consumption rate (OCR) (A and B) and extracellular acidification rate (ECAR) (C and D) were measured in a Seahorse Analyzer (n = 7) (mpH= milli pH units). (E) B16F10 cells (10 × 103) were incubated in the presence (closed red circles) or absence (open white circles) of serum for the indicated time and lactate release was measured in the cell supernatants. Lactate release is expressed as percent increase over time zero. (F) B16F10 cells (5 × 10³) were incubated in RPMI-1640 medium in the presence (closed red circles) or absence (open white circles) of serum, at the indicated time were lysed and intracellular ATP (iATP) measured by luciferase assay. CPS (counts per second) were normalized to cell content determined by crystal violet (n = 7). Data are shown as mean ± SEM. *P < 0.05; ***P < 0.001; ****P < 0.0001.
Figure 4
Figure 4
Serum deprivation reduces mitochondrial membrane potential and Complex I and II levels. B16F10 monolayers were incubated in the presence (A) or absence (B) of serum for 24 h, then rinsed twice with warm PBS to remove serum and cell debris, and loaded with tetramethyl rhodamine methyl ester (TMRM, 50 nM) in saline solution (see Methods). Fluorescence was measured with a Zeiss LS510 confocal microscope at an emission wavelength of 570 nm using red laser excitation (543 nm). Images were analyzed with ImageJ software. Bars = 10 µm. (C) Mitochondrial membrane potential (Ѱm) expressed as ratio between TMRM fluorescence (in arbitrary units, a.u.) before and after FCCP addition (n = 10). (D) Western blot analysis of respiratory chain complexes from B16F10 serum-supplemented and serum-starved cells at t 0, 24 and 48 h. Fifteen micrograms of protein were loaded in each lane. Densitometry of Western blot analysis of mitochondrial Complex I (E) and Complex II (F) at indicated time points (n = 4). Data are shown as mean ± SEM. *P < 0.05; ***P < 0.001; ****P < 0.0001.
Figure 5
Figure 5
Serum deprivation enhances microparticle release in a P2X7R-dependent fashion. (A) Control (B16 wt) or P2X7R-silenced (B16-shRNA) B16F10 cells were incubated at a concentration of 1 × 10⁶ (for the 48 h incubation) or 2 × 10⁶ (for the 24 h incubation)/flask in the presence or absence of serum depleted of extracellular vesicles (EV) for the indicated time. At the end of this incubation, cells were counted again, the supernatant removed and extracellular particles isolated as described in Methods. Microparticles were measured with the NanoSight system as described in Methods. Total microparticle number is reported in panel (A), while particle number normalized to cell number is reported in panel (B). Representative traces of size distribution of microparticles released from B16F10 wt cells incubated in the presence or absence of serum (C), and from wt or P2X7R-silenced B16F10 cells (D). (E) ATP content of microparticles isolated from B16F10 cells incubated in the presence or absence of serum. Microparticles were isolated as described in (A). Data are reported as percent increase over ATP content at 24 h in the presence of serum (n = 12). (F-G) B16F10 cells (1 × 10⁶/flask) were loaded with Mitotracker Green (200 nM, n = 4) (F) or Mitotracker Red (300 nM, n = 3) (G) in RPMI-1640 serum free medium, rinsed twice with warm PBS and then incubated in RPMI-1640 medium in the presence (closed orange circles) or absence (open white circles) of EV-depleted serum for 24 and 48 h. Microparticles were isolated and fluorescence measured as described in Methods. Fluorescence emission was normalized over microparticle protein. Data are shown as mean ± SEM. *P < 0.05; **P < 0.01; ***P < 0.001; ****P < 0.0001. (H) Representative blot of mitochondrial protein content (HSP60, TIM23 and TOM20) of microparticles isolated from B16F10 cells incubated in the presence or absence of serum. The same volume of microparticle suspension was loaded in each lane, and carbonic anhydrase was used as loading control.
Figure 6
Figure 6
B16F10 cells release mitochondria as both free organelles and microparticle encapsulated. Microparticles were isolated and processed as described in Methods. Images were captured with the EM910 transmission electron microscope. (A) Representative picture of free mitochondria released by B16F10 cells. (B) Representative picture of mitochondrion trapped within a microparticle. (C and E) Immunogold staining in the presence of anti-TOM20 primary antibody. (D and F) Immunogold staining of microparticles incubated in the absence of the anti-TOM20 primary antibody (controls). Mitochondrial membrane and cristae are indicated by black arrows in all panels. Microparticle membrane in panel (B) is indicated by red arrow. Bars = 200 nm.
Figure 7
Figure 7
P2X7R-silencing impairs mitochondrial energy metabolism and ATP synthesis. (A) B16F10 wt (closed red circles) or P2X7R-silenced cells (B16-P2X7R-shRNA) (closed green circles) were incubated in RPMI-1640 medium and oxygen consumption rate (OCR) measured after 48 h as described in Figure 3 (n = 7). Intracellular ATP (iATP) levels were measured in B16F10 wt (closed red circles) or B16F10-P2X7R-shRNA (closed green circles) cultured in the presence (B) or absence (C) of serum. Intracellular ATP was measured with soluble luciferase after lysis with milli-Q water. CPS (counts per second) were normalized to cell content determined with crystal violet (n = 7). Extracellular ATP levels were measured in B16F10 wt (closed red circles) or B16F10-shP2X7R (closed green circles) cultured in the presence (D) or absence (E) of serum. CPS (counts per second) were normalized to cell content determined with crystal violet (n = 8). (F) Extracellular ATP measured with soluble luciferase in B16F10-shP2X7R cells cultured in the presence (closed green circles) or absence (open white circles) of serum. CPS (counts per second) were normalized to cell content determined with crystal violet (n = 8). Data are shown as mean ± SEM. **P < 0.01; ***P < 0.001; ****P < 0.0001.
Figure 8
Figure 8
Extracellular ATP in the TME is detected by host cell-expressed pmeLuc. (A) Schematic rendition of pmeLuc expression on host immune cells showing plasma membrane localization of the probe. (B) Representative pictures of luminescence signal detected in pmeLuc transgenic mice. Mice on the right were shaved and inoculated with B16F10 wt cells into the right hind flank. Mice on the left (controls) were just shaved on the right hind flank. Dotted circles on the tumor-bearing mice highlight the perimeter of the tumor mass. (C) Relative expression by qRT-PCR of pmeLuc probe in the spleens from control and pmeLuc-TG-mice, and from inflammatory cells eluted from tumors excised from pmeLuc-TG-mice. PmeLuc expression was normalized to G3PDH (n = 3).
Figure 9
Figure 9
Schematic rendition of the effects of caloric restriction on cell metabolism and eATP. Caloric restriction inhibits growth signal generation, P2X7R function, and cell proliferation. Resting and P2X7R-stimulated intracellular Ca2+ level is also reduced. Mitochondria are fragmented, thus impairing energy metabolism and iATP accumulation. At the same time, caloric restriction promotes release of mitochondria-containing microparticles/microvesicles as well as of naked mitochondria. This process is accompanied by, and possibly even responsible for, release of eATP.

References

    1. Madeo F, Carmona-Gutierrez D, Hofer SJ, Kroemer G. Caloric Restriction Mimetics against Age-Associated Disease: Targets, Mechanisms, and Therapeutic Potential. Cell Metab. 2019;29:592–610. - PubMed
    1. Levesque S, Pol JG, Ferrere G, Galluzzi L, Zitvogel L, Kroemer G. Trial watch: dietary interventions for cancer therapy. Oncoimmunology. 2019;8:1591878. - PMC - PubMed
    1. Pietrocola F, Pol J, Vacchelli E, Rao S, Enot DP, Baracco EE. et al. Caloric Restriction Mimetics Enhance Anticancer Immunosurveillance. Cancer Cell. 2016;30:147–60. - PMC - PubMed
    1. Kepp O, Bezu L, Yamazaki T, Di Virgilio F, Smyth MJ, Kroemer G. et al. ATP and cancer immunosurveillance. EMBO J. 2021;40:e108130. - PMC - PubMed
    1. Burnstock G. Pathophysiology and therapeutic potential of purinergic signaling. Pharmacol Rev. 2006;58:58–86. - PubMed

Publication types