. 2021 Oct 18;12(46):15239-15252.
doi: 10.1039/d1sc05077j. eCollection 2021 Dec 1.

Towards developing novel and sustainable molecular light-to-heat converters

Affiliations

Towards developing novel and sustainable molecular light-to-heat converters

Temitope T Abiola et al. Chem Sci. .

Abstract

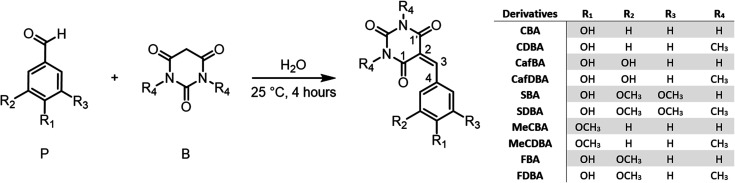
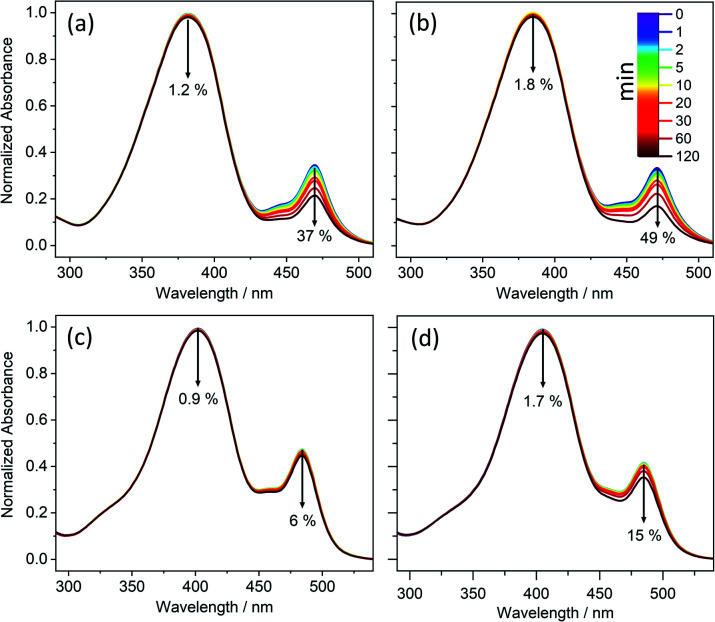
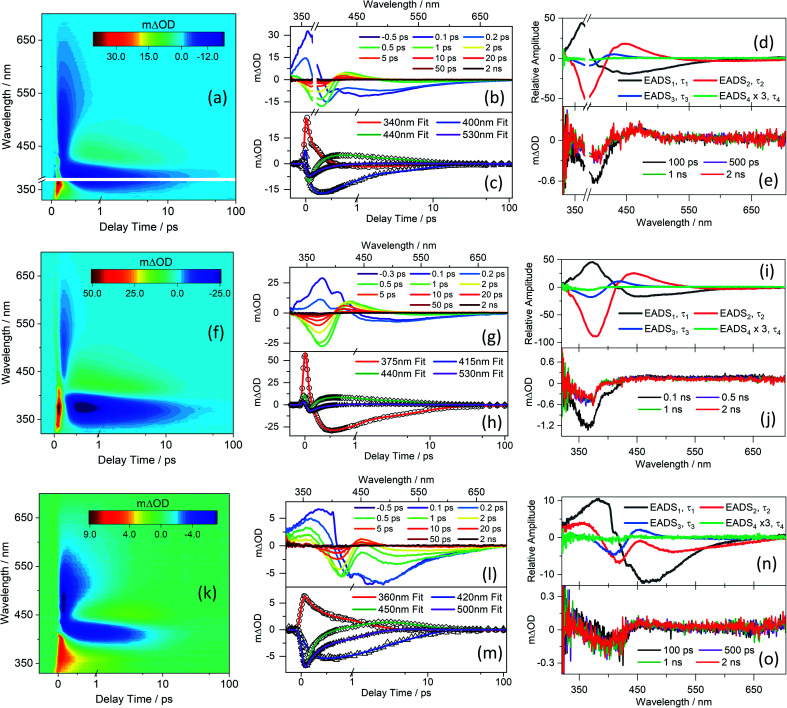
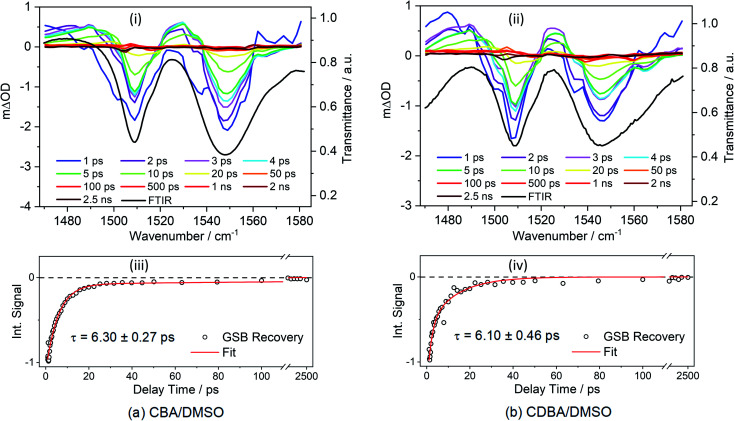
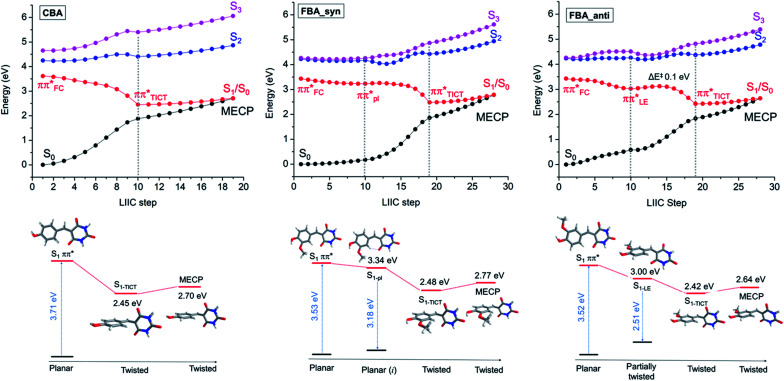
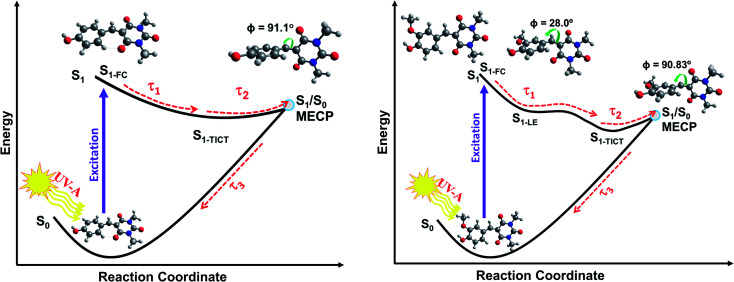
Light-to-heat conversion materials generate great interest due to their widespread applications, notable exemplars being solar energy harvesting and photoprotection. Another more recently identified potential application for such materials is in molecular heaters for agriculture, whose function is to protect crops from extreme cold weather and extend both the growing season and the geographic areas capable of supporting growth, all of which could help reduce food security challenges. To address this demand, a new series of phenolic-based barbituric absorbers of ultraviolet (UV) radiation has been designed and synthesised in a sustainable manner. The photophysics of these molecules has been studied in solution using femtosecond transient electronic and vibrational absorption spectroscopies, allied with computational simulations and their potential toxicity assessed by in silico studies. Following photoexcitation to the lowest singlet excited state, these barbituric absorbers repopulate the electronic ground state with high fidelity on an ultrafast time scale (within a few picoseconds). The energy relaxation pathway includes a twisted intramolecular charge-transfer state as the system evolves out of the Franck-Condon region, internal conversion to the ground electronic state, and subsequent vibrational cooling. These barbituric absorbers display promising light-to-heat conversion capabilities, are predicted to be non-toxic, and demand further study within neighbouring application-based fields.


Conflict of interest statement

There are no conflicts to declare.

Figures

Scheme 1
Scheme 1. Synthesis of phenolic barbituric acid derivatives synthesis: coumaryl barbituric acid (CBA), coumaryl dimethyl barbituric acid (CDBA), caffeyl barbituric acid (CafBA), caffeyl dimethyl barbituric acid (CafDBA), sinapyl barbituric acid (SBA), sinapyl dimethyl barbituric acid (SDBA), 4-methoxy coumaryl barbituric acid (MeCBA), 4-methoxy coumaryl dimethyl barbituric acid (MeCDBA), ferulyl barbituric acid (FBA), and ferulyl dimethyl barbituric acid (FDBA). The central C atoms in the product are labelled consistently with the numbering scheme used in the electronic structure calculations.
Fig. 1
Fig. 1. Long-term photostability of (a) CBA, (b) CDBA, (c) FBA, and (d) FDBA. UV-visible spectra of samples obtained in DMSO at varying duration of irradiation with a xenon arc lamp. The downward arrows denote the observed decrease in absorbance over 120 minutes of irradiation, with the time colour-coded.
Fig. 2
Fig. 2. TEA spectra obtained for 1 mM of (a) CDBA/DMSO photoexcited at 385 nm, (f) MeCDBA/DMSO photoexcited at 375 nm, and (k) FDBA/DMSO photoexcited at 404 nm, shown as false colour maps. In each case, the pump–probe delay time is presented as a linear plot until 1 ps and then as a logarithmic scale between 1 and 100 ps. The same data are presented as line plots of mΔOD vs. probe wavelength at selected pump–probe time delays in panels (b), (g), and (l) for CDBA/DMSO, MeCDBA/DMSO, and FDBA/DMSO, respectively. Panels (c), (h), and (m) show transients (raw data as symbols and fits as solid lines) at selected probe wavelengths for CDBA/DMSO, MeCDBA/DMSO, and FDBA/DMSO, respectively. The evolution associated difference spectra (EADS) produced by the fitting procedure are shown in panels (d) CDBA/DMSO, (i) MeCDBA/DMSO, and (n) FDBA/DMSO with, in each case, EADS4 multiplied by three as a visual aid. The transients at longer delay time (100 ps, 500 ps, 1 ns, and 2 ns) are shown in panels (e), (j) and (o) for CDBA/DMSO, MeCDBA/DMSO, and FDBA/DMSO, respectively. The smaller mΔOD signal of the 2 ns transients observed for the ferulyl series as compared with the coumaryl series reflects the lower pump excitation power from our setup at the wavelength of interest.
Fig. 3
Fig. 3. TVA spectra obtained for 30 mM solutions of (a) CBA/DMSO and (b) CDBA/DMSO, both photoexcited at 385 nm and using a broadband IR probe pulse centred at 1529 cm−1. The TVA spectra in the upper panels (i) and (ii) are presented as smoothed coloured line plots of mΔOD (left-hand y-axis) vs. probe wavenumber at selected pump–probe delay times. The steady-state FTIR spectra are shown as black lines in the respective panels, with the transmittance scale shown on the right-hand y-axis. The lower panels (iii) and (iv) show the transients for the GSB recovery (raw data as open circles and fit as solid red line) of signals at selected wavenumber. The normalized integration of the GSB signal for CBA/DMSO (1539–1560 cm−1) and CDBA/DMSO (1534–1560 cm−1) were fitted with mono-exponential functions. In both cases, the delay times are plotted linearly until 110 ps; then there is a break until 1300 ps beyond which the 1300–2500 ps data are plotted on a logarithmic scale to show the full GSB recovery.
Fig. 4
Fig. 4. Potential energy curves calculated at the TD-ωB97XD/cc-pVDZ level of theory using PCM/DMSO for CBA, FBA_anti, and FBA_syn. For CBA: LIIC starting from the S1 geometry accessed by vertical excitation from the S0 state to the S1-TICT min (shown up to the dashed grey line) and from S1-TICT to S1/S0 MECP. For FBA: LIIC from the S1 geometry accessed by vertical excitation to the S1-LE minimum or S1-pl (shown up to the first dashed grey line), from the former point to the S1-TICT (up to the second dashed grey line), and from S1-TICT to the S1/S0 MECP. The FBA_syn isomer is 0.05 eV (1.1 kcal mol−1) more stable than FBA_anti in the ground state.
Fig. 5
Fig. 5. Schematic of the relaxation pathways for CDBA (left) and FDBA-anti (right) representing the coumaryl and ferulyl series, respectively. Molecular conformations at the Franck–Condon (FC) region, at the local S1-LE minimum (only for FDBA-anti) and at S1/S0 MECP are shown. The respective Φ (C1–C2–C3–C4) dihedral angles, (see Scheme 1 for atom numbering), are also indicated. The molecular structures for the S1-TICT configurations are omitted here for clarity but are shown in ESI Fig. S43 and S44 and are very similar to the respective S1/S0 MECP geometries.

References

    1. Huang X. El-Sayed I. H. Qian W. El-Sayed M. A. J. Am. Chem. Soc. 2006;128:2115–2120. doi: 10.1021/ja057254a. - DOI - PubMed
    1. Boyer D. Tamarat P. Maali A. Lounis B. Orrit M. Science. 2002;297:1160–1163. doi: 10.1126/science.1073765. - DOI - PubMed
    1. Neumann O. Urban A. S. Day J. Lal S. Nordlander P. Halas N. J. ACS Nano. 2013;7:42–49. doi: 10.1021/nn304948h. - DOI - PubMed
    1. Li R. Zhang L. Wang P. Nanoscale. 2015;7:17167–17194. doi: 10.1039/C5NR04870B. - DOI - PubMed
    1. Jaque D. Maestro L. M. Del Rosal B. Haro-Gonzalez P. Benayas A. Plaza J. Rodriguez E. M. Sole J. G. Nanoscale. 2014;6:9494–9530. doi: 10.1039/C4NR00708E. - DOI - PubMed