. 2021 Nov 18;12(46):15407-15417.
doi: 10.1039/d1sc04656j. eCollection 2021 Dec 1.

How to exploit different endocytosis pathways to allow selective delivery of anticancer drugs to cancer cells over healthy cells

Affiliations

How to exploit different endocytosis pathways to allow selective delivery of anticancer drugs to cancer cells over healthy cells

Vu Thanh Cong et al. Chem Sci. .

Abstract

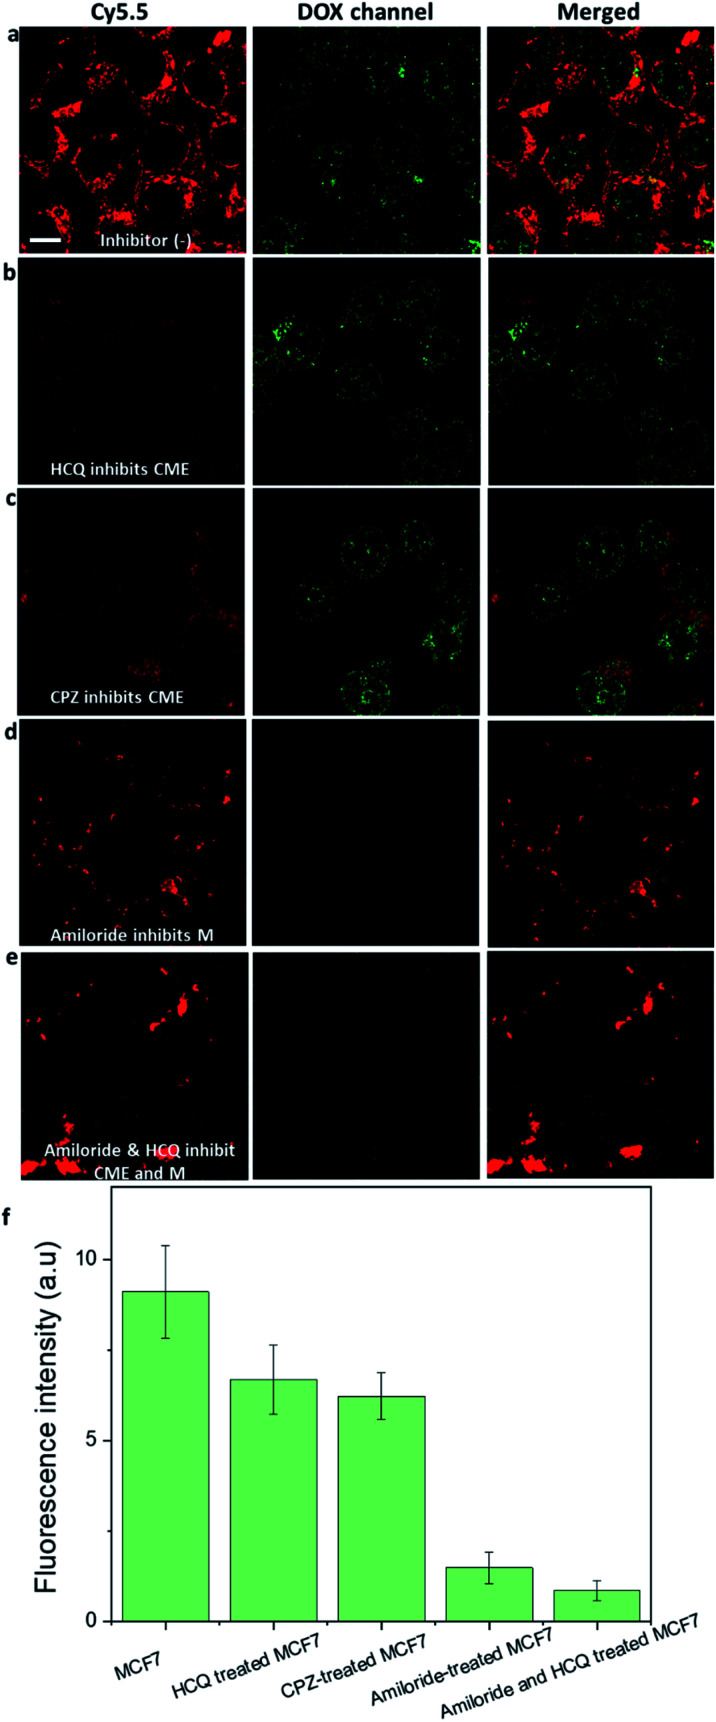
It was recently shown that it is possible to exploit the nanoparticle shape to selectively target endocytosis pathways found in cancer and not healthy cells. It is important to understand and compare the endocytosis pathways of nanoparticles in both cancer and healthy cells to restrict the healthy cells from taking up anticancer drugs to help reduce the side effects for patients. Here, the clathrin-mediated endocytosis inhibitor, hydroxychloroquine, and the anticancer drug, doxorubicin, are loaded into the same mesoporous silica nanorods. The use of nanorods was found to restrict the uptake by healthy cells but allowed cancer cells to take up the nanorods via the macropinocytosis pathway. Furthermore, it is shown that the nanorods can selectively deliver doxorubicin to the nucleus of breast cancer cells and to the cytoplasm of pancreatic cancer cells. The dual-drug-loaded nanorods were able to selectively kill the breast cancer cells in the presence of healthy breast cells. This study opens exciting possibilities of targeting cancer cells based on the material shape rather than targeting antibodies.


Conflict of interest statement

There are no conflicts to declare.

Figures

Fig. 1
Fig. 1. Schematic illustration of drug-loaded mesoporous silica nanorod selection in cancer and healthy cells. Hydroxychloroquine (HCQ) and doxorubicin (DOX) are co-loaded into mesoporous silica nanorods. HCQ is released first which inhibits clathrin-mediated endocytosis pathways in both healthy and cancer cells. As the cancer cells can use the macropinocytosis pathway to take the nanorods, the nanorods enter the cancer cells despite HCQ inhibition. The nanorods allow the delivery of DOX to the nucleus of cancer cells.
Fig. 2
Fig. 2. The release profile of DOX and HCQ at pH 7.4 and 5.8. The figure is represented by ■ (pH 7.4 for HCQ-NR-Cy5.5), ▲ (pH 7.4 for DOX-NR-Cy5.5) and ● (pH 5.8 for DOX-NR-Cy5.5). The drug release percentage is calculated from the weight of the released drug in PBS solution divided by the weight of the drug in nanorods.
Fig. 3
Fig. 3. DOX-NR-Cy5.5 was incubated with breast cancer MCF7 cells or pancreatic cancer PANC-1 cells after 24 h. (a–d) MCF7 cells. (e–h) PANC-1 cells. (a and e) Cy5.5 channel. (b and f) DOX channel. (c and g) Merged two channels. In a, b, c, e, f, and g, the 20× lens was used. In d and h, the 100× lens was used. The white arrows indicate the location of DOX in the nucleus of the two cell lines. (i) Comparison of the fluorescence intensity of Cy5.5 in the cytoplasm and DOX in the nucleus of MCF7 and PANC-1 cells. Cy5.5-labelled nanorods are represented with the red emission color. DOX is represented with the green emission color. The scale bar is 10 μm.
Fig. 4
Fig. 4. Comparison of the amount of DOX in the nucleus of MCF7 cells and inhibitor-treated MCF7 cells. Hydroxychloroquine (HCQ) or chlorpromazine (CPZ) was used to inhibit the clathrin-mediated endocytosis (CME) pathway so that the cancer cells can use the macropinocytosis pathway. Amiloride was used to inhibit the macropinocytosis (M) pathway so that the cancer cells can use the clathrin-mediated endocytosis pathway. (a) MCF7 cells were incubated with DOX-NR-Cy5.5. (b) Hydroxychloroquine-treated MCF7 cells were incubated with DOX-NR-Cy5.5. (c) Chlorpromazine-treated MCF7 cells were incubated with DOX-NR-Cy5.5. (d) Amiloride-treated MCF7 cells were incubated with DOX-NR-Cy5.5. (e) Amiloride and hydroxychloroquine-treated MCF7 cells were incubated with DOX-NR-Cy5.5. (f) Comparison of the amount of DOX in the nucleus of these cells. All the cells were incubated with nanorods for 24 h. The scale bar is 10 μm.
Fig. 5
Fig. 5. Comparison of the extracellular and intracellular fluorescence intensity of nanorod-Cy5.5 in MCF10A (a–c) and MCF7 cells (d–f). HCQ-NR-Cy5.5 was exposed to the two cell lines and the measurements were conducted at 30 min (a and d), at 20 h (b and e) and at 48 h (e and f) of incubation. The extracellular fluorescence intensity was measured as shown in the yellow square. The data were extracted in (g). The intracellular fluorescence intensity was measured as shown in the green square. The data were extracted in (h). The scale bar is 10 μm.
Fig. 6
Fig. 6. Cellular uptake of HCQ & DOX-NR-Cy5.5. (a) MCF7 and (b) MCF10A cells after 24 h incubation. (c) Fluorescence intensity of DOX in the whole cells and nucleus of MCF7 and MCF10A cells. The shorter white arrows indicate the location of DOX in the nucleus (NU) of the two cell lines. The longer white arrows indicate the location of DOX in the cytoplasm (CYTO) of the two cell lines. (c) Comparison of the amount of DOX in the whole cells and the nucleus of these cells. (d and e) Mixed culture of MCF7 and MCF10A cells was incubated with HCQ & DOX-NR-Cy5.5 after 48 h and 72 h. The MCF7 cells were stained with cell tracker violet in d and e. NU represents the nucleus. CYTO represents the cytoplasm of the cells. DOX is represented with the green emission. The Cy5.5 nanorod is represented with the red emission color. Cell tracker violet is represented with blue emission color. The scale bar is 10 μm.
Fig. 7
Fig. 7. HCQ & DOX-NR-Cy5.5 incubated with (a) MCF7 and (b) MCF10A after 72 h. The cell viability of HCQ & DOX-NR-Cy5.5 in MCF7 and MCF10A (c). The cell viability was quantified using a LIVE/DEAD Viability/Cytotoxicity Kit for mammalian cells based on staining the live cells with calcein-AM (0.5 μM) and dead cells with ethidium homodimer-1 (1 μM) dyes. Images of live (green) and dead (red) cells were acquired using the LSM780 with the 20× objective lens. The white arrow in (a) shows the stressed cancer cells after being treated with HCQ & DOX-NR-Cy5.5 for 72 h. The scale bar is 10 μm.

References

    1. Sousa de Almeida M. Susnik E. Drasler B. Taladriz-Blanco P. Petri-Fink A. Rothen-Rutishauser B. Chem. Soc. Rev. 2021;50:5397–5434. doi: 10.1039/D0CS01127D. - DOI - PMC - PubMed
    1. Wang W. Gaus K. Tilley R. D. Gooding J. J. Mater. Horiz. 2019;6:1538–1547. doi: 10.1039/C9MH00664H. - DOI
    1. Cong V. T. Wang W. Tilley R. D. Sharbeen G. Phillips P. A. Gaus K. Gooding J. J. Adv. Funct. Mater. 2021;31:2007880. doi: 10.1002/adfm.202007880. - DOI
    1. Kinnear C. Moore T. L. Rodriguez-Lorenzo L. Rothen-Rutishauser B. Petri-Fink A. Chem. Rev. 2017;117:11476–11521. doi: 10.1021/acs.chemrev.7b00194. - DOI - PubMed
    1. Rennick J. J. Johnston A. P. R. Parton R. G. Nat. Nanotechnol. 2021;16:266–276. doi: 10.1038/s41565-021-00858-8. - DOI - PubMed