. 2021 Nov 29:27:184-199.
doi: 10.1016/j.omtn.2021.11.024. eCollection 2022 Mar 8.

Time-controlled and muscle-specific CRISPR/Cas9-mediated deletion of CTG-repeat expansion in the DMPK gene

Affiliations

Time-controlled and muscle-specific CRISPR/Cas9-mediated deletion of CTG-repeat expansion in the DMPK gene

Beatrice Cardinali et al. Mol Ther Nucleic Acids. .

Abstract

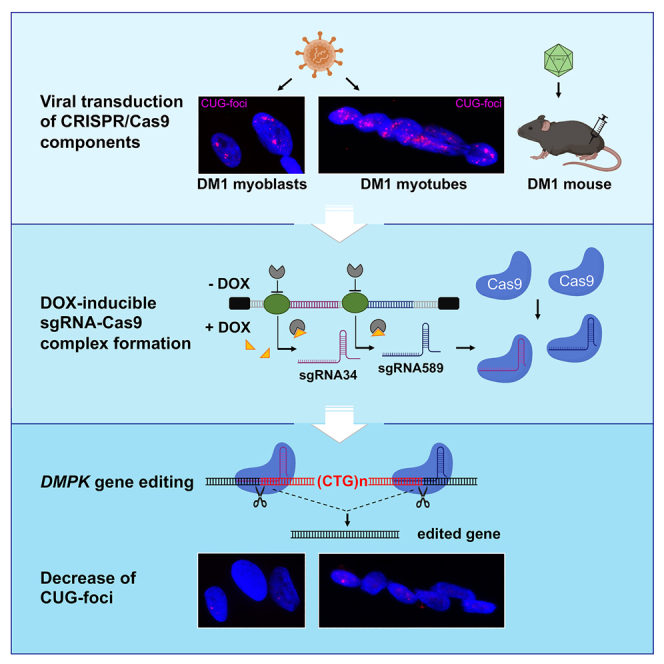
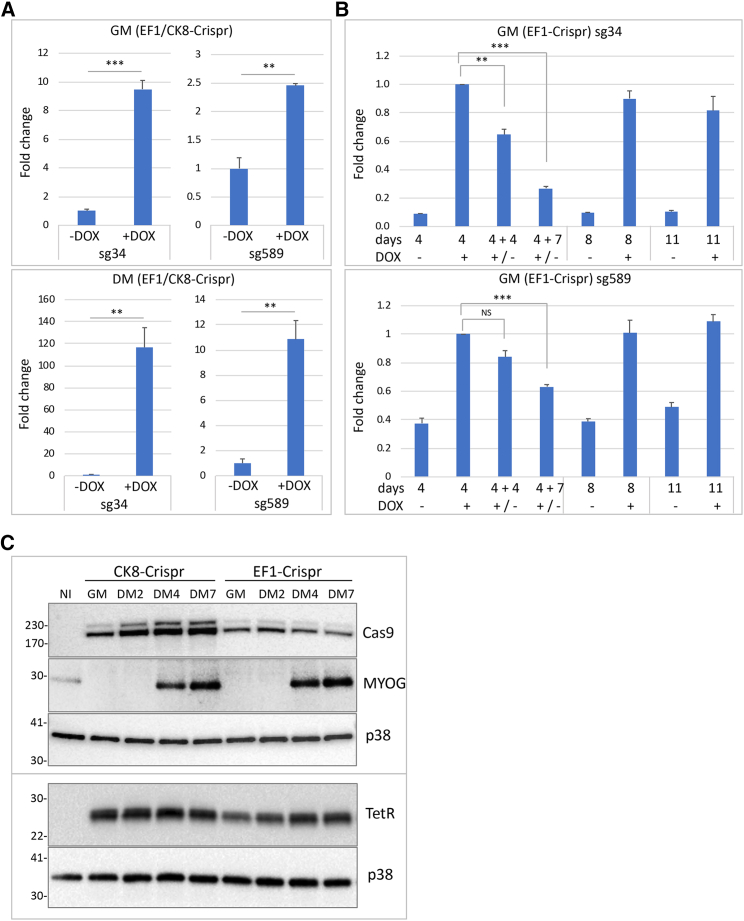
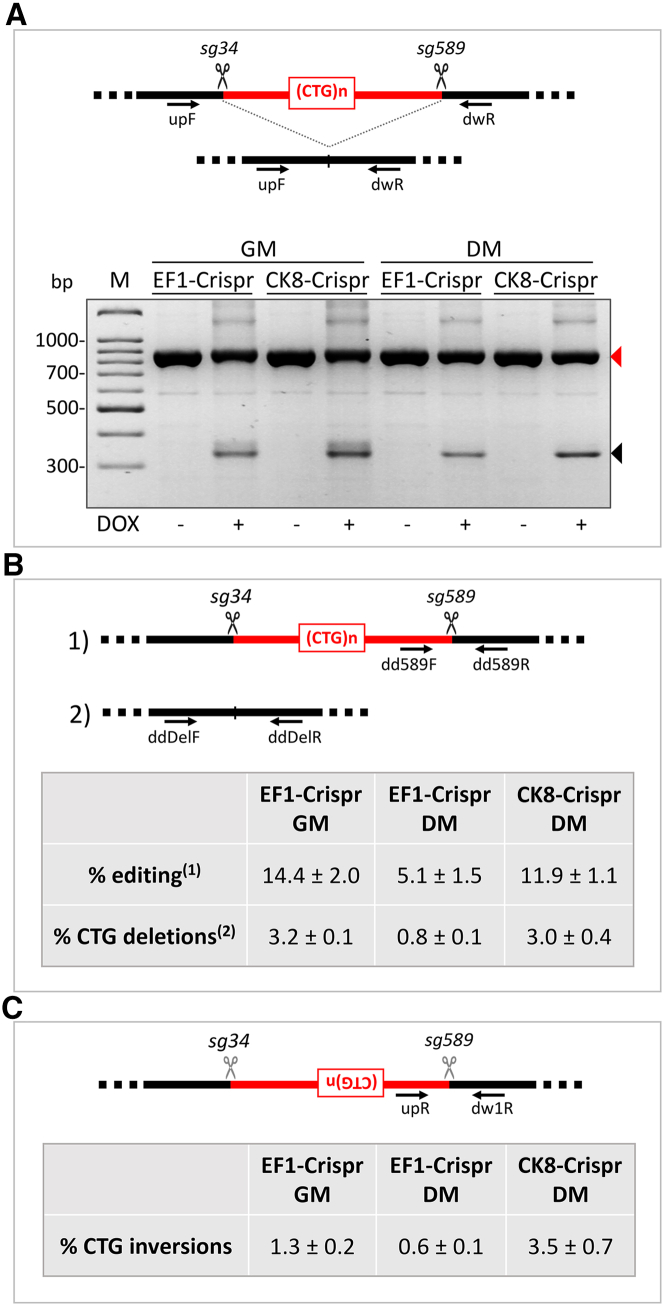
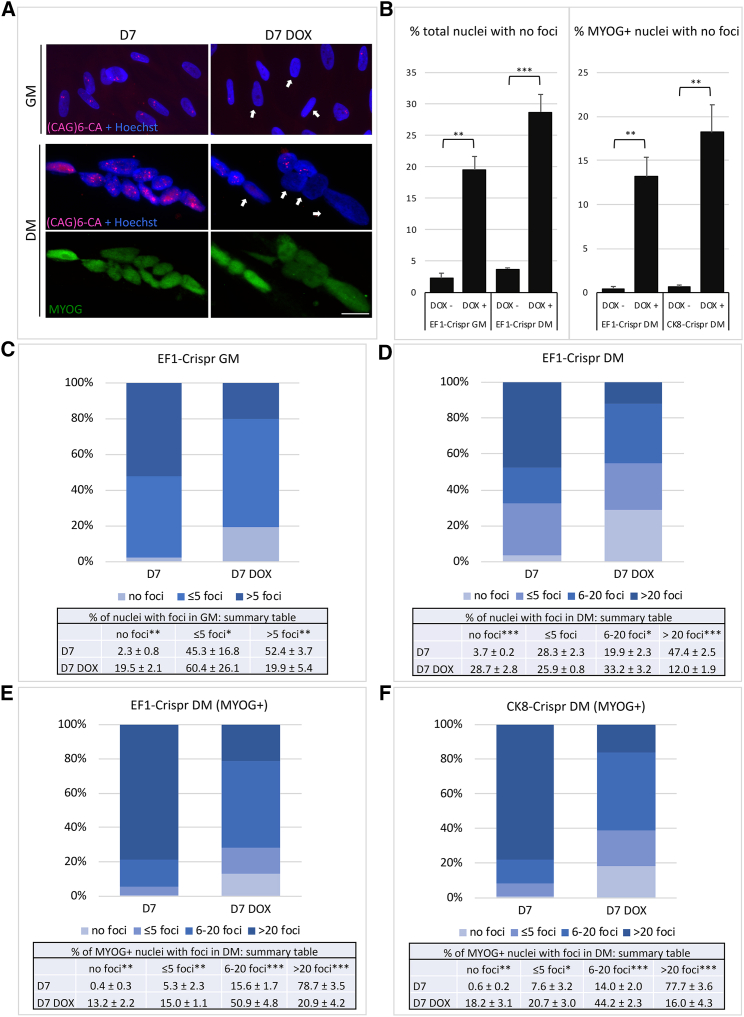
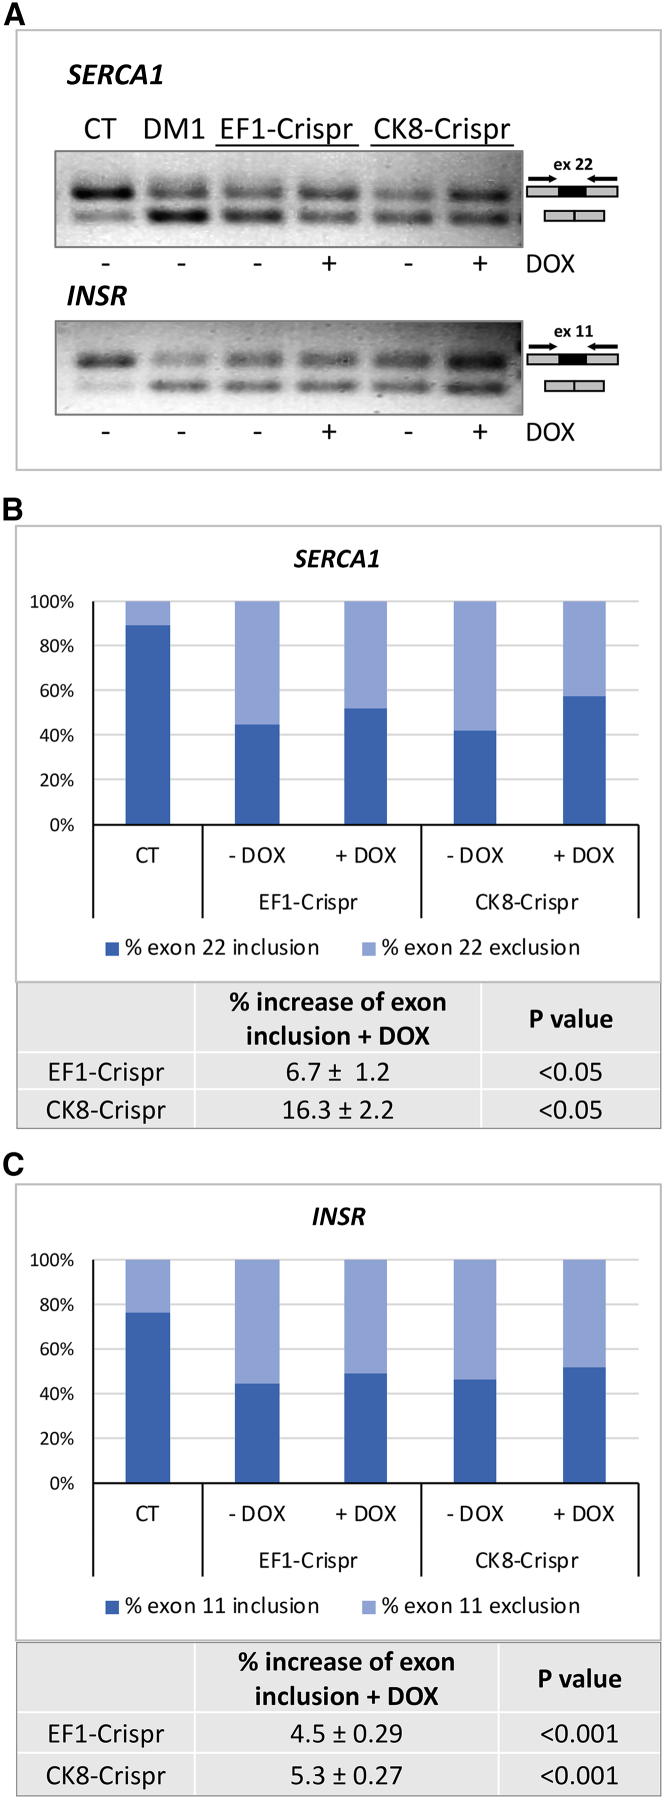
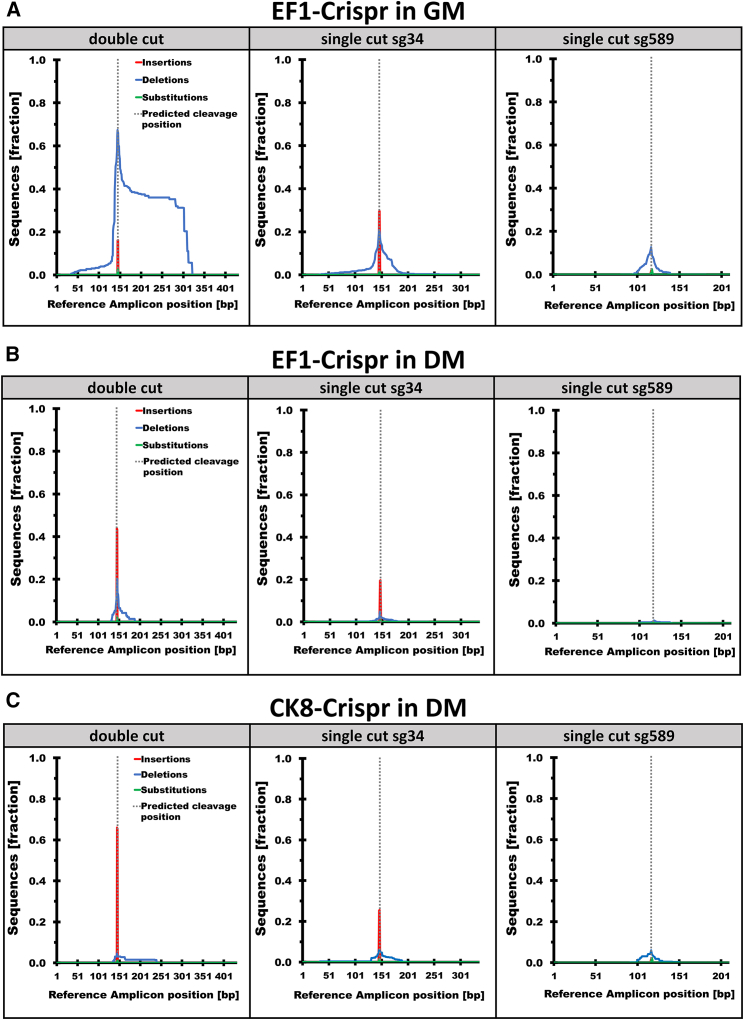
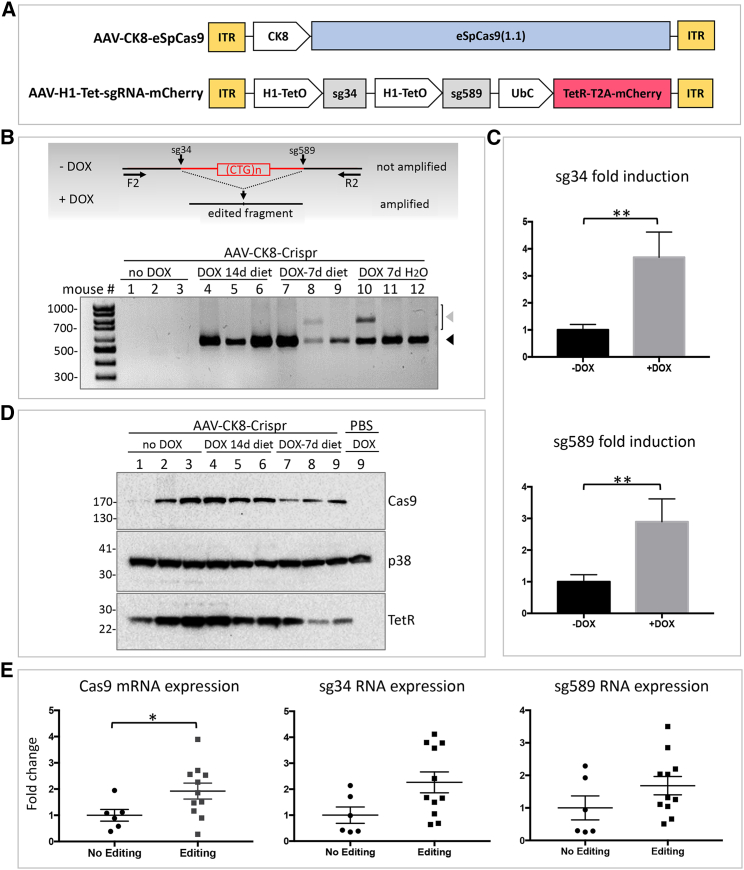
CRISPR/Cas9-mediated therapeutic gene editing is a promising technology for durable treatment of incurable monogenic diseases such as myotonic dystrophies. Gene-editing approaches have been recently applied to in vitro and in vivo models of myotonic dystrophy type 1 (DM1) to delete the pathogenic CTG-repeat expansion located in the 3' untranslated region of the DMPK gene. In DM1-patient-derived cells removal of the expanded repeats induced beneficial effects on major hallmarks of the disease with reduction in DMPK transcript-containing ribonuclear foci and reversal of aberrant splicing patterns. Here, we set out to excise the triplet expansion in a time-restricted and cell-specific fashion to minimize the potential occurrence of unintended events in off-target genomic loci and select for the target cell type. To this aim, we employed either a ubiquitous promoter-driven or a muscle-specific promoter-driven Cas9 nuclease and tetracycline repressor-based guide RNAs. A dual-vector approach was used to deliver the CRISPR/Cas9 components into DM1 patient-derived cells and in skeletal muscle of a DM1 mouse model. In this way, we obtained efficient and inducible gene editing both in proliferating cells and differentiated post-mitotic myocytes in vitro as well as in skeletal muscle tissue in vivo.

Keywords: CRISPR/Cas9; CTG repeats; DM1; DMSXL mouse model; gene editing; gene therapy; myotonic dystrophy; skeletal muscle.


Conflict of interest statement

The authors declare no competing interests.

Figures

None
Graphical abstract
Figure 1
Figure 1
Characterization of Cas9 and sgRNA expression following DOX addition and removal in transduced DM1 cells (A) qRT-PCR of sg34 and sg589 RNAs expressed in EF1-Crispr and CK8-Crispr myoblasts, in growing medium (GM) and differentiation medium (DM) for 7 days with or without doxycycline (DOX). Expression of sgRNAs was normalized on rpL23 mRNA and expressed relative to the levels measured in untreated cells set as 1 (mean ± SEM). n = 3; ∗∗p < 0.01; ∗∗∗p < 0.001. (B) qRT-PCR of sg34 and sg589 RNAs from myoblasts infected with EF1-Crispr in GM after treatment with DOX for 4 days, followed by either DOX removal for 4 and 7 days or left in DOX medium for the same time. Expression of sgRNAs was normalized on rpL23 mRNA and shown relative to the levels measured after DOX treatment for 4 days set as 1 (mean ± SEM). n = 3; ∗p < 0.05; ∗∗p < 0.01; ∗∗∗p < 0.001. (C) Representative western blot analysis of Cas9 protein (Cas9), driven by either CK8 or EF1 promoter, and of the differentiation marker MYOG (MYOG) in proliferating myoblasts (GM) and differentiated myoblasts in DM for 2, 4 and 7 days, transduced with CK8-Crispr or EF1-Crispr (top panel). Tet repressor (TetR) was analyzed in a separate experiment (bottom panel). p38 is shown as loading control. NI, non-infected.
Figure 2
Figure 2
DOX-inducible CTG-repeat deletions and inversions in DM1-patient-derived myogenic cells EF1-Crispr- or CK8-Crispr-transduced cells were treated with DOX or left untreated for 3 days (A) or 7 days (B, C) in growing medium (GM) and differentiation medium (DM). The scheme in each panel shows the positions of the primers used for PCR amplification, relative to the sgRNA cutting sites. Black scissors indicate effective cuts (A and B), gray scissors indicate ineffective cut due to inversion of the target sequences (C). (A) Genomic DNA was extracted and analyzed by PCR using DMPK primers binding upstream (upF) and downstream (dwR) of CTG expansion, as shown in the diagram. The black triangle indicates the expected CTG-deleted products from both wild-type and mutated alleles, the red triangle indicates undeleted wild-type allele-derived amplicons. (B) Editing efficiency was analyzed by performing ddPCR with genomic DNAs of EF1-Crispr in GM (n = 3) and DM (n = 3) and CK8-Crispr in DM (n = 3). Primers binding near the editing site upstream and downstream of either (1) the sg589 site (dd589F, dd589R) or (2) the CTG expansion (ddDelF, ddDelR) were used together with reference primers annealing >7,000 bp upstream from editing site (ddPCR.Ref.DMPK F, ddPCR.Ref.DMPK R). Obtained concentrations (copies/μL) of replicates were averaged, and differences due to editing events were expressed in percentage relative to reference (mean ± SEM). (C) qPCR analysis of CTG-repeat inversions was performed in EF1-Crispr in GM and DM and CK8-Crispr in DM. Each sample represents a pool of genomic DNAs derived from three independent experiments. Three different qPCR reactions were performed on the same pools using primers DMPK up R (upR) and DMPK dw1 R (dw1R). The percentage of inversions is calculated compared with a DM1-derived cell clone (clone C12) where the mutated allele is inverted (mean ± SEM).
Figure 3
Figure 3
Reduction of nuclear foci following DOX-induced gene editing in DM1-derived proliferating and differentiated cells Cells were infected with the indicated lentiviral combinations and cultured in proliferation medium (GM) or differentiation medium (DM) for 7 days (D7) with or without doxycycline (DOX), then fixed and processed for RNA FISH analysis using a fluorescent (CAG)6CA probe and MYOG staining (only for differentiated cells). (A) Representative images of untreated and DOX-treated EF1-Crispr-transduced cells in GM and DM, stained as indicated, are shown. White arrows highlight edited nuclei without foci. Scale bar, 10 μm. Note that treated myotubes contain both foci-negative and foci-positive nuclei. (B) Histograms show the increase of both total (left panel) and MYOG-positive (right panel) foci-free nuclei following DOX treatment. (C and D) Histograms show quantitation of (C) total nuclei containing no foci, ≤5 foci, and >5 foci in growing cells (GM) and (D) no foci, ≤5 foci, between 6 and 20 foci, and >20 foci in differentiated cells (DM) transduced with EF1-Crispr following DOX treatment. (E and F) Histograms show quantitation of MYOG-positive nuclei containing no foci, ≤5 foci, between 6 and 20 foci, and >20 foci in differentiated cells (DM) transduced with (E) EF1-Crispr or (F) CK8-Crispr following DOX treatment. At least 300 nuclei were counted for each condition (mean ± SEM). n = 3–4. ∗p < 0.05; ∗∗p < 0.01; ∗∗∗p < 0.001.
Figure 4
Figure 4
Improvement of SERCA and INSR normal splicing after induction of gene editing SERCA1 and INSR transcripts were analyzed by standard RT-PCR (A) or qRT-PCR (B and C) in EF1-Crispr- and CK8-Crispr-infected DM1 cells, as indicated, and following doxycycline (DOX) induction for 1 day in GM and 1 day in DM. (A) Both spliced and not spliced transcript forms were amplified using the primers hSERCA1 ex22F+R for SERCA1 transcripts and the primers hINSR ex11F+R for INSR transcripts (see diagram on the right). The splicing patterns of SERCA1 and INSR are shown compared with cells derived from unaffected control (CT) and to DM1 parental cells not expressing CRISPR/Cas9 (DM1). (B and C) qRT-PCR of SERCA1 and INSR using primers specific for each isoform normalized to the total amount of SERCA1 and INSR transcripts, respectively (Table S4). Histogram represents the percentage of exon inclusion and exclusion for SERCA1 and INSR transcripts in the absence or presence of DOX, compared with the control cells. For each transcript the percentage of increase of exon inclusion following DOX administration is shown in the table (mean ± SEM, n = 3).
Figure 5
Figure 5
Amplicon sequencing analysis reveals higher editing accuracy in differentiated cells than in proliferating cells Genomic DNA was extracted from DM1 patient-derived proliferating cells in GM infected with (A) EF1-Crispr (n = 3) and differentiated cells in DM infected with (B) EF1-Crispr (n = 3) or (C) CK8-Crispr (n = 2). The precision of CRISPR/Cas9 activity was analyzed by amplicon sequencing of three possible editing events. For the double cut (simultaneous cut of both sgRNAs), primers located upstream of sg34 and downstream of sg589 were used. Single-cut events were examined using primers flanking the target site for sg34 or sg589 (single-cut sg34, single-cut sg589). The fraction of insertions, deletions, and substitutions resulting from this analysis was obtained by comparison with the reference sequence (Reference Amplicon, expected sequence derived from perfect rejoining at single- and double-cut sites).
Figure 6
Figure 6
DOX-inducible gene editing in skeletal muscle of DMSXL mice (A) Scheme of AAV constructs containing Cas9 and sgRNAs. ITR, inverted terminal repeat; CK8, creatine kinase 8 promoter; TetO, tetracycline operator; TetR, tetracycline repressor; UbC, ubiquitin C promoter. (B) Editing of genomic DNA extracted from TA muscles of DMSXL hemizygous mice, injected with both the AAV vectors (AAV-CK8-Crispr), and treated with DOX as indicated. Primers DMPK F2 (F2) and DMPK R2 (R2) were used for PCR amplification. In the diagram the expected outcomes in the absence (−DOX) or presence (+DOX) of DOX are indicated. The black triangle indicates the expected CTG-deleted products and the gray triangle indicates non-specific PCR products. (C) qRT-PCR showing fold induction of sg34 and sg589 RNAs in untreated or DOX-treated mice, normalized to mCherry expression; ∗∗p < 0.01, n = 5 (−DOX); n = 12 (+DOX). (D) Western blot analysis of Cas9 and TetR proteins in TA of DMSXL mice, treated as indicated. PBS-injected TA muscle is shown as negative control; p38 is shown as loading control. (E) Dot plots represent qRT-PCR expression analysis of Cas9, sg34, and sg589 RNAs in TA muscles of DMSXL mice injected with the AAV vectors and treated with DOX. RNA expression in samples either with or without CTG editing was normalized to GAPDH expression: ∗p < 0.05, n = 6 (No Editing); n = 11 (Editing).

References

    1. Meola G., Cardani R. Myotonic dystrophies: an update on clinical aspects, genetic, pathology, and molecular pathomechanisms. Biochim. Biophys. Acta. 2015;1852:594–606. doi: 10.1016/j.bbadis.2014.05.019. - DOI - PubMed
    1. Andre L.M., Ausems C.R.M., Wansink D.G., Wieringa B. Abnormalities in skeletal muscle myogenesis, growth, and regeneration in myotonic dystrophy. Front. Neurol. 2018;9:368. doi: 10.3389/fneur.2018.00368. - DOI - PMC - PubMed
    1. Sicot G., Gomes-Pereira M. RNA toxicity in human disease and animal models: from the uncovering of a new mechanism to the development of promising therapies. Biochim. Biophys. Acta. 2013;1832:1390–1409. doi: 10.1016/j.bbadis.2013.03.002. - DOI - PubMed
    1. Thomas J.D., Oliveira R., Sznajder L.J., Swanson M.S. Myotonic dystrophy and developmental regulation of RNA processing. Compr. Physiol. 2018;8:509–553. doi: 10.1002/cphy.c170002. - DOI - PMC - PubMed
    1. Alwazzan M., Newman E., Hamshere M.G., Brook J.D. Myotonic dystrophy is associated with a reduced level of RNA from the DMWD allele adjacent to the expanded repeat. Hum. Mol. Genet. 1999;8:1491–1497. doi: 10.1093/hmg/8.8.1491. - DOI - PubMed