

Examining the spatial risk environment tied to the opioid crisis through a unique public health, EMS, and academic research collaborative: Lowell, Massachusetts, 2008-2018
- PMID: 34976650
- PMCID: PMC8683861
- DOI: 10.1016/j.pmedr.2021.101591
Examining the spatial risk environment tied to the opioid crisis through a unique public health, EMS, and academic research collaborative: Lowell, Massachusetts, 2008-2018
Abstract
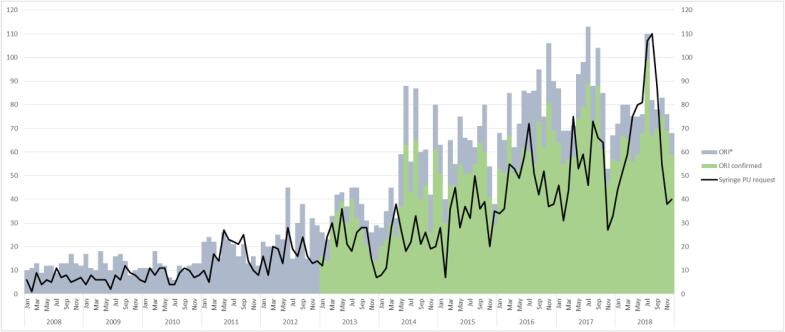
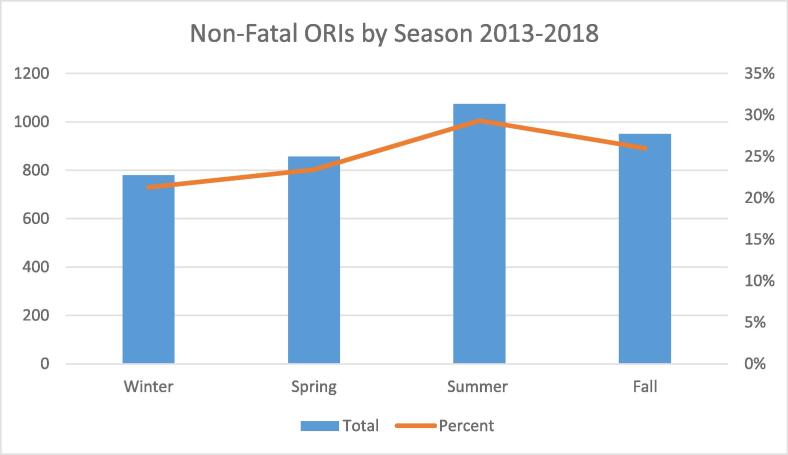
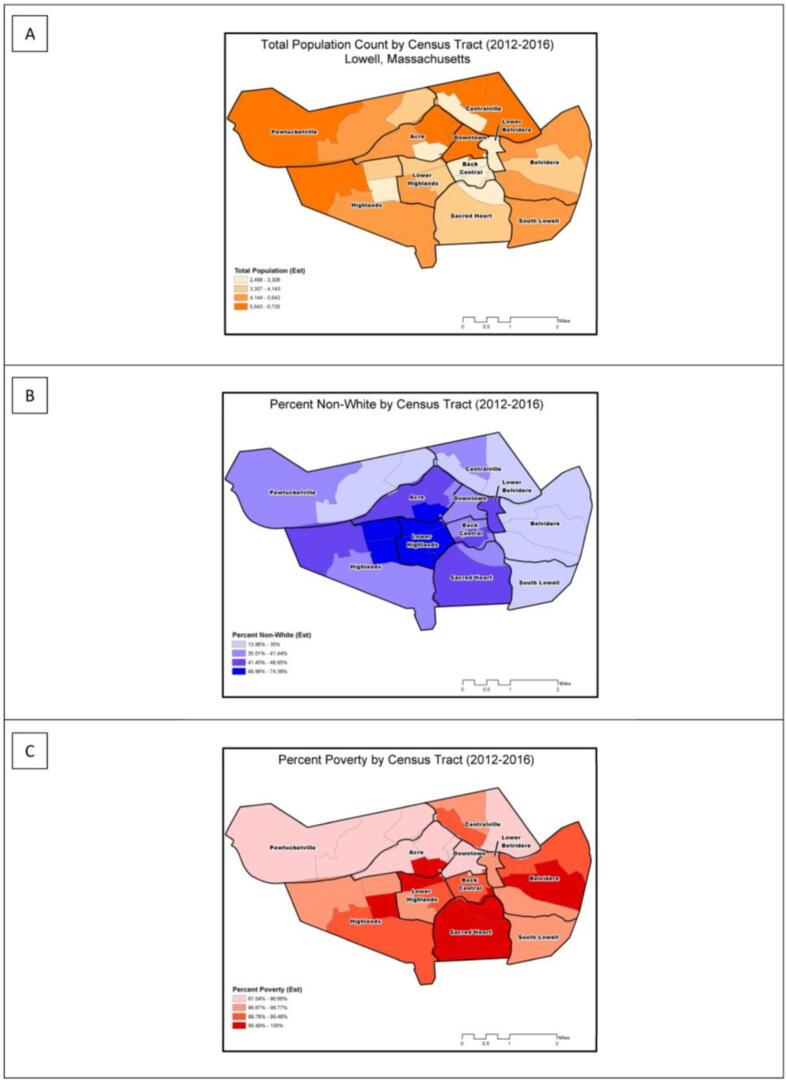
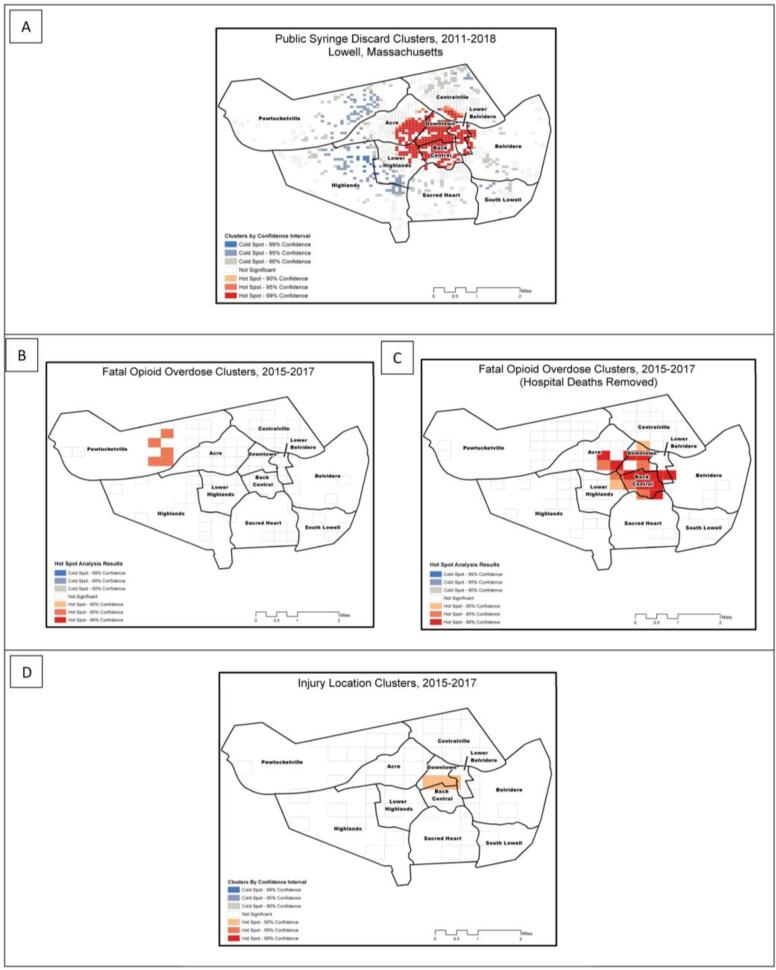
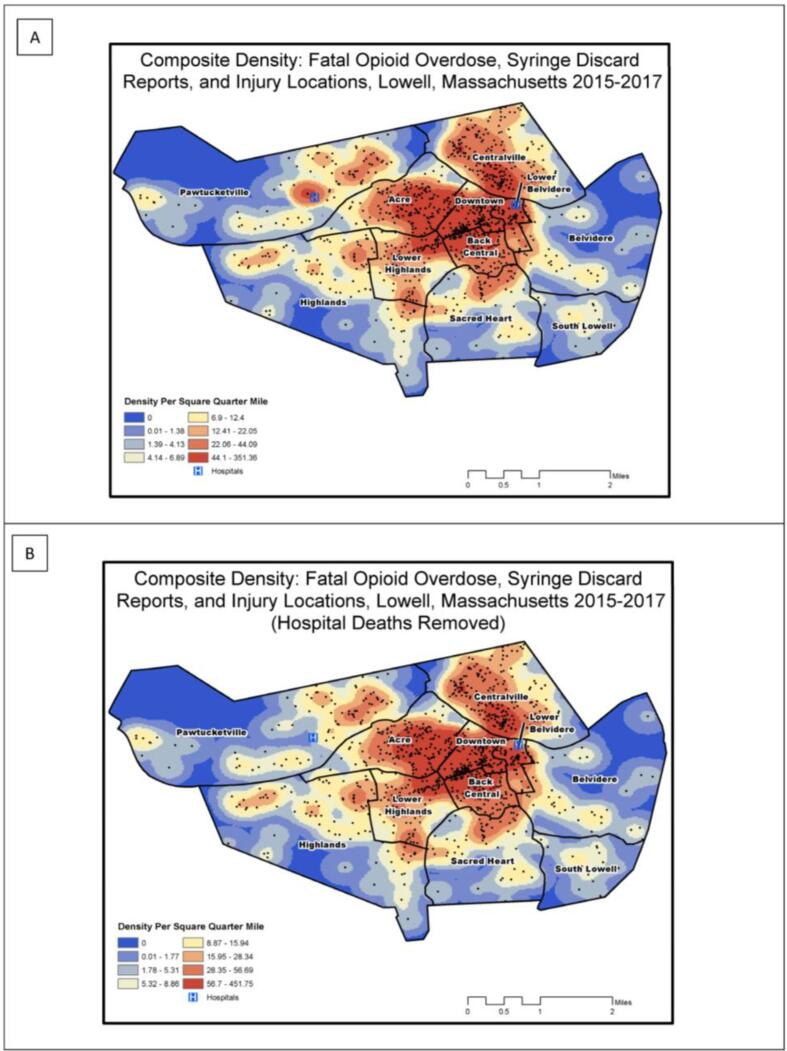
Between 2015 and 2018, Lowell Massachusetts experienced outbreaks in opioid overdoses, HIV, and hepatitis C virus infections (HCV) among people who inject drugs. Through an innovative collaboration between emergency medical services (EMS), public health, and academic partners, we assessed the geographic distribution of opioid-related risks to inform intervention efforts. We analyzed data from three unique data sources for publicly discarded syringes, opioid-related incidents (ORIs), and fatal opioid overdoses in Lowell between 2008 and 2018. We assessed the risk environment over time using a geographic information system to identify and characterize hotspots and noted parallel trends within the syringe discard and ORI data. We identified two notable increases in ORIs per day: the first occurring between 2008 and 2010 (from 0.3 to 0.5), and the second between 2011 and 2014 (from 0.9 to 1.3), following the introduction of fentanyl within local drug markets. We also identified seasonal patterns in the syringe discard, ORI, and overdose data. Through our spatial analyses, we identified significant clusters of discarded syringes, ORIs, and fatal overdoses (p < 0.05), and neighborhoods where high densities of these outcomes overlapped. We found that areas with the highest densities shifted over time, expanding beyond the epicenter of the Downtown neighborhood. Data sharing and analyses among EMS, public health, and academic partners can foster better assessments of local risk environments. Our work, along with new public health efforts in Lowell, led to a city-funded position to improve pick-up and proper disposal of publicly discarded syringes, and better targeted harm reduction services.
Keywords: Lowell; Massachusetts; Opioids; Overdose; Syringe discard.
© 2021 The Authors.
Conflict of interest statement
The authors declare that they have no known competing financial interests or personal relationships that could have appeared to influence the work reported in this paper.
Figures
References
-
- 2019 Massachusetts HIV/AIDS Epidemiologic Profile, Statewide Report (2020).
-
- An Assessment of Fatal and Non-Fatal Opioid Overdoses in Massachusetts (2011–2015). http://www.mass.gov/eohhs/docs/dph/stop-addiction/legislative-report-cha... (2017).
-
- ArcGIS-Pro. How Kernel Density Works. 2020. Esri, Redlands, CA. Accessed February 14, 2020. https://pro.arcgis.com/en/pro-app/tool-reference/spatial-analyst/how-ker....
-
- ArcGIS-Pro. How Optimized Hot Spot Analysis Works. 2020. Esri, Redlands CA. Accessed February 14, 2020. https://pro.arcgis.com/en/pro-app/tool-reference/spatial-statistics/how-....
LinkOut - more resources
Full Text Sources
