. 2021 Dec 15:31:126-138.
doi: 10.1016/j.jot.2021.10.008. eCollection 2021 Nov.

Comprehensive analysis of N6-methyladenosine (m6A) modification during the degeneration of lumbar intervertebral disc in mice

Affiliations

Comprehensive analysis of N6-methyladenosine (m6A) modification during the degeneration of lumbar intervertebral disc in mice

Bin Zhu et al. J Orthop Translat. .

Abstract

Objective: To study the N6-methyladenosine (m6A) modification pattern of nucleus pulposus (NP) tissue during intervertebral disc degeneration (IDD).

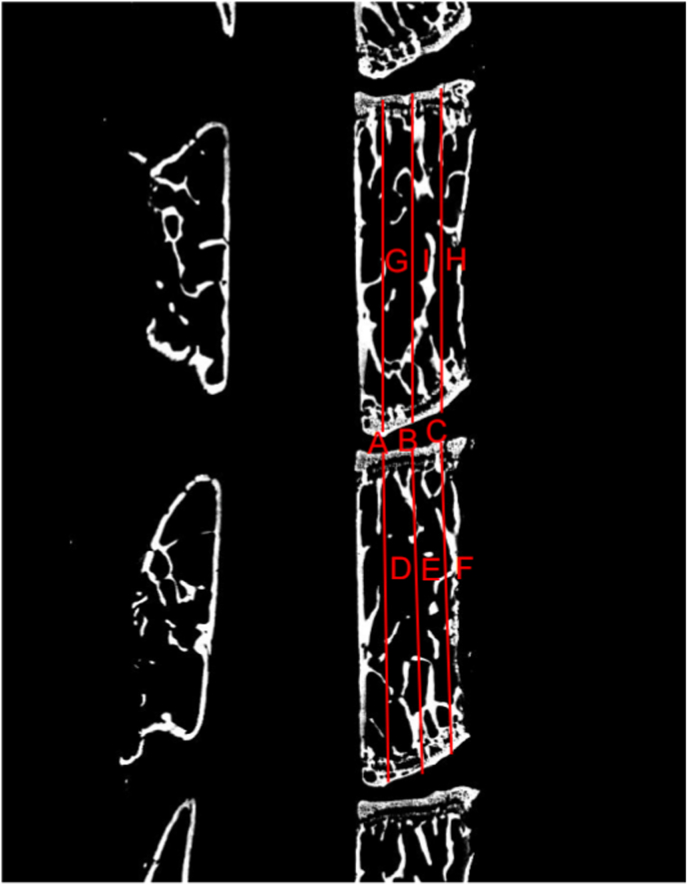
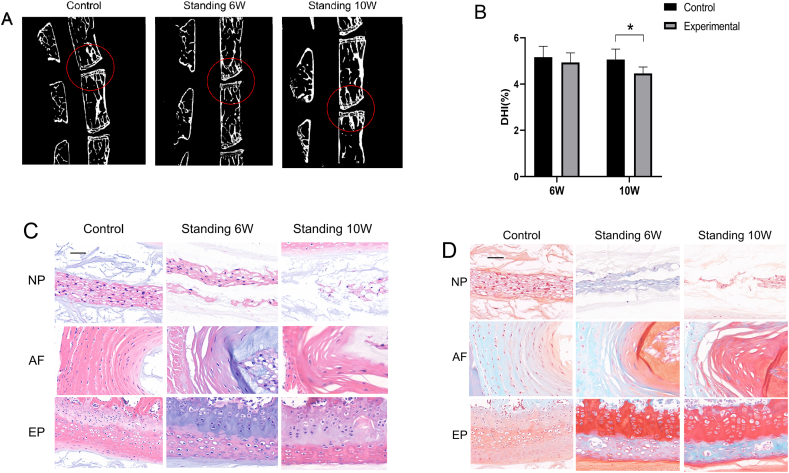
Methods: A standing mouse model was generated, and staining and imaging methods were used to evaluate the IDD model. Methylated RNA immunoprecipitation with next-generation sequencing (MeRIP-seq) was used to analyze m6A methylation-associated transcripts in the NP, and real-time quantitative polymerase chain reaction (qRT-PCR) was used to detect the expression of methylation-related enzymes and conduct bio-informatics analysis.

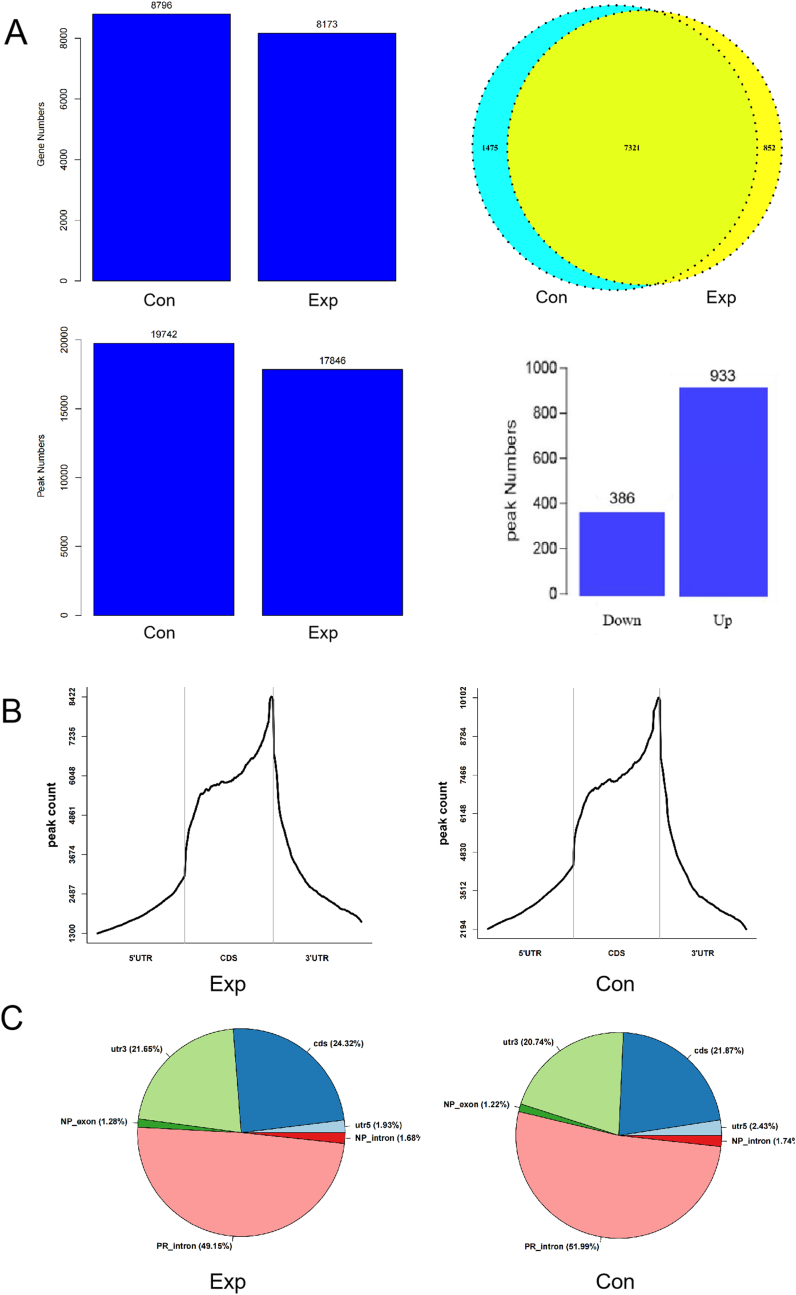
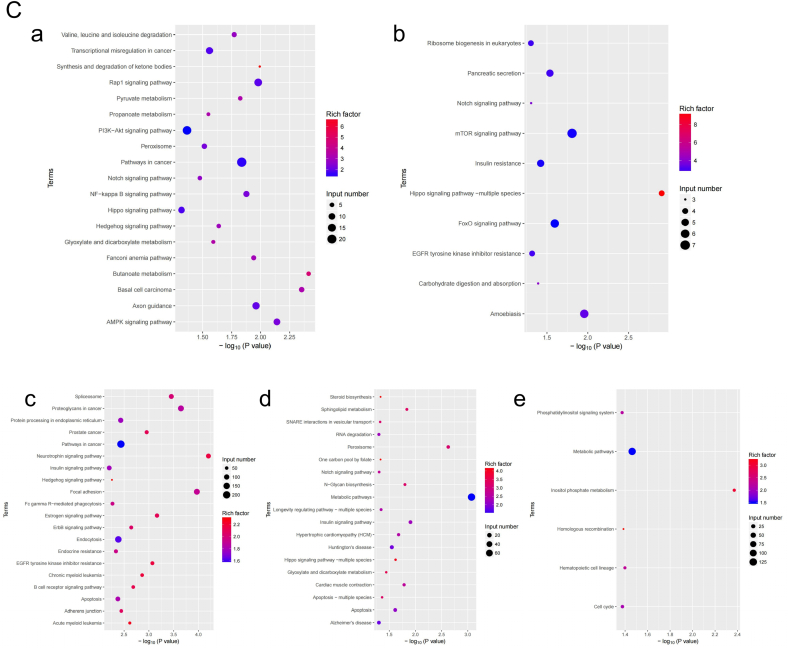
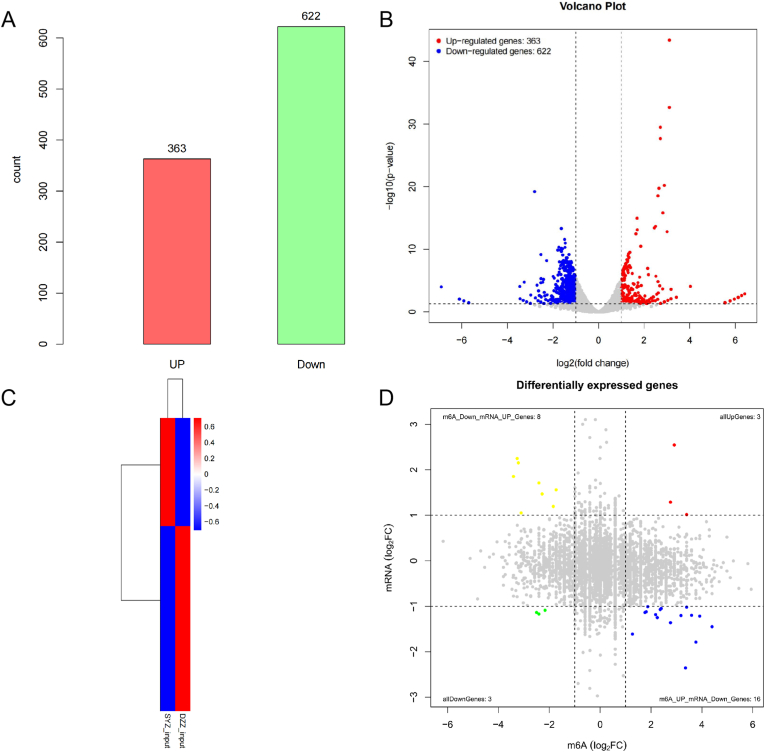
Results: The standing mouse model caused IDD. Continuous axial pressure changed the expression of related methylases in degenerated NP tissue. Relative to the control group, the expression levels of KIAA1429, METTL14, METTL3, METTL4, WTAP, DGCR8, EIF3A and YTHDC1 in the experimental group were higher, while those of FTO, ELAVL1, HNRNPC1 and SRSF2 were lower. We identified 985 differentially expressed genes through MeRIP-Seq, among which 363 genes were significantly up-regulated, and 622 genes were significantly down-regulated. In addition, among the 9648 genes counted, 1319 m6A peaks with significant differences in methylation were identified, among which 933 were significantly up-regulated, and 386 were significantly down-regulated. Genes and pathways that were enriched in IDD have been identified.

Conclusion: The results of this study elucidated the m6A methylation pattern of NP tissue in degenerated lumbar intervertebral disc of mice and provided new perspectives and clues for research on and the treatment of lumbar disc degeneration.

The translational potential of this article: As one of the important causes of low back and leg pain, intervertebral disc degeneration brings a huge economic burden to the society, family and medical system. Therefore, understanding the molecular and cellular mechanisms of intervertebral disc degeneration is of great significance for guiding clinical treatment. In this study, methylated RNA immunoprecipitation with next-generation sequencing on mice lumbar nucleus pulposus tissues found that differentially expressed genes and changes in the expression of related methylases, confirming that RNA methylation is involved in intervertebral disc degeneration. The process provides new vision and clues for future research on intervertebral disc degeneration.

Keywords: Intervertebral disc degeneration; Methylated RNA immunoprecipitation with next-generation sequencing; m6A methylation; nucleus pulposus.


Conflict of interest statement

The authors declare that they have no competing interests.

Figures

Figure 1
Figure 1
Bipedal standing of mice. Experimental group (Left), Control group (Right).
Figure 2
Figure 2
Micro-CT scan and DHI% measurement simulation image of lumbar vertebrae in mice. A-C. The line represents the height of the anterior 25%, 50% and 75% of the IVD; D-H. The line represents the height of the anterior and posterior 25%, 50% and 75% of the adjacent vertebral body. DHI%:Disc Height Index.
Figure 3
Figure 3
A. Micro-CT results show that the intervertebral height of the experimental group was decreased compared with that of the control group. B. The DHI% of the mice in the experimental and control groups is shown. C-D. HE staining and safranin green staining results show that the number of NP cells and the amount of extracellular matrix decreased, the arrangement of the annulus fibrosus was disordered, and the height of the end-plate was decreased. ∗p ​< ​0.05 compared with the control group; NP = NP; AF ​= ​annulus fibrosus; EP ​= ​end-plate (scale bars ​= ​20 ​mm); magnification: 40x.
Figure 4
Figure 4
Distribution of reads in different regions of the reference genome.
Figure 5
Figure 5
A. The numbers of methylated genes and m6A peaks in the experimental and control groups. B. Distribution of m6A peaks in the 5′ UTR, CDS regions and 3′ UTR of mRNA. C. The distribution of m6A peaks in different gene is contexts shown in pie charts.
Figure 6
Figure 6
GO and KEGG analyses provided biological information associated with m6A methylation. A. Major GO terms significantly enriched in genes associated with the hypermethylated m6A peak. B. Major GO terms significantly enriched in genes associated with the hypomethylated m6A peak. C. a. Enriched pathways related to hypermethylated m6A-modified genes; b. Enriched pathways related to hypomethylated m6A-modified genes; c-e: Common and unique pathways of the experimental and control groups.
Figure 6
Figure 6
GO and KEGG analyses provided biological information associated with m6A methylation. A. Major GO terms significantly enriched in genes associated with the hypermethylated m6A peak. B. Major GO terms significantly enriched in genes associated with the hypomethylated m6A peak. C. a. Enriched pathways related to hypermethylated m6A-modified genes; b. Enriched pathways related to hypomethylated m6A-modified genes; c-e: Common and unique pathways of the experimental and control groups.
Figure 7
Figure 7
Changes in gene transcription and correlation analysis of meRIP-seq and mRNA-seq results associated with lumbar disc degeneration. A-B. The expression levels of genes after IDD. A total of 363 genes showed significantly up-regulated, and 622 genes showed significantly down-regulated in mouse NP after IDD. C. The heat map shows the relative expression levels of the input between the experimental group and control group. D. Four-quadrant diagram showing the relationship between m6A methylation and mRNA expression.
Figure 8
Figure 8
The relative expression of m6A-related enzymes in the experimental and control groups is shown.

Similar articles

Cited by

References

    1. Brodke D., Ritter S. Nonsurgical management of low back pain and lumbar disk degeneration. Instr Course Lect. 2005;54:279–286. - PubMed
    1. Wu A., Lyn M., Zheng X., Huang J., Wang X., Zhao J., et al. Global low back pain prevalence and years lived with disability from 1990 to 2017: estimates from the Global Burden of Disease Study 2017.[J] Ann Transl Med. 2020;8:299. - PMC - PubMed
    1. Lv B., Yuan J., Ding H., Wan B., Jiang Q., Luo Y., et al. Relationship between endplate defects, modic change, disc degeneration, and facet joint degeneration in patients with low back pain. [J] .Biomed Res Int. 2019;2019:9369853. - PMC - PubMed
    1. Bogduk N. Evidence-informed management of chronic low back pain with facet injections and radiofrequency neurotomy. Spine J : official journal of the North American Spine Society. 2008;8(1):56–64. - PubMed
    1. Taylor R., Taylor R. The economic impact of failed back surgery syndrome. British journal of pain. 2012;6(4):174–181. - PMC - PubMed