. 2021 Dec 7:9:12-21.
doi: 10.1016/j.toxrep.2021.12.001. eCollection 2022.

High-fat western diet-consumption alters crystalline silica-induced serum adipokines, inflammatory cytokines and arterial blood flow in the F344 rat

Affiliations

High-fat western diet-consumption alters crystalline silica-induced serum adipokines, inflammatory cytokines and arterial blood flow in the F344 rat

Janet A Thompson et al. Toxicol Rep. .

Abstract

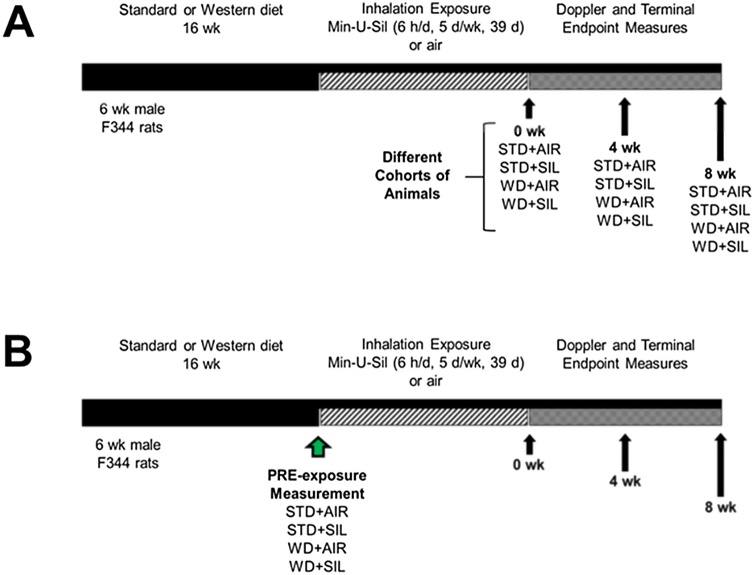
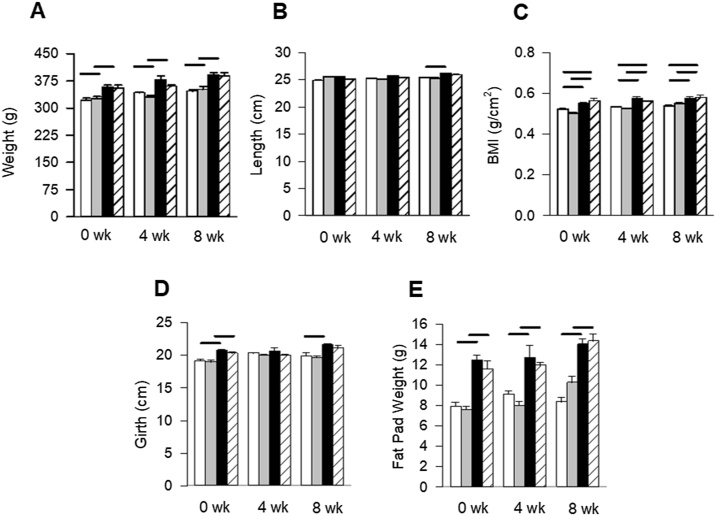
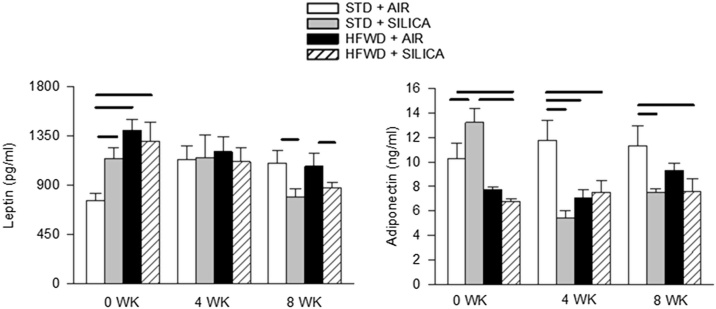
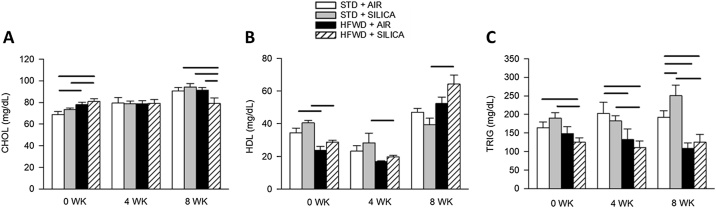
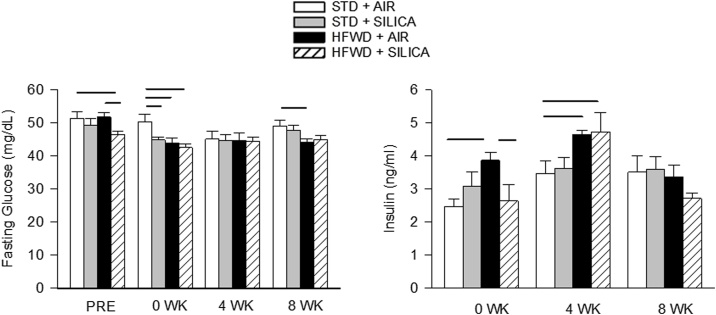
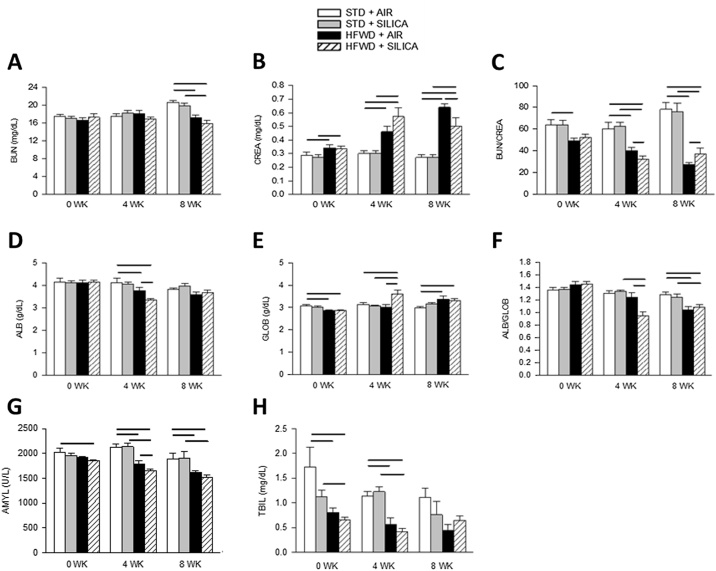
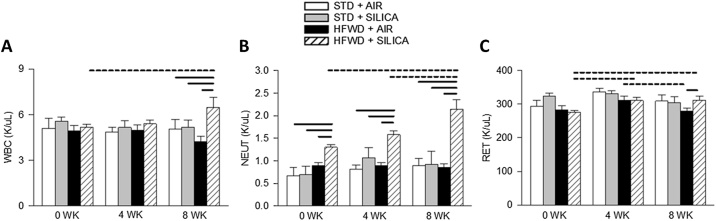
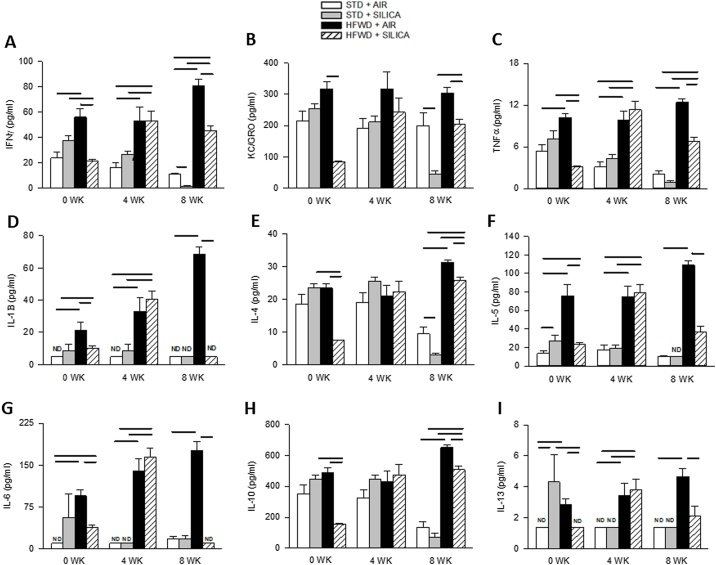
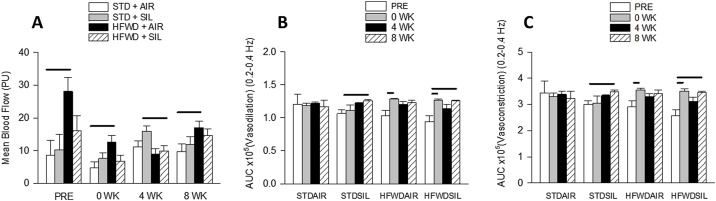
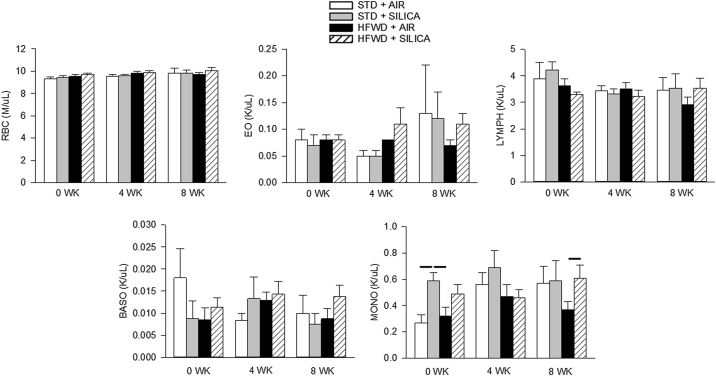
Adipose tissue (AT) plays a central role in the maintenance of whole-body energy homeostasis through release of adipokines. High-fat Western diet (HFWD)-consumption contributes to obesity, disruption of adipocyte metabolism, chronic systemic inflammation, and metabolic dysfunction (MetDys). MetDys is associated with impaired lung function, pulmonary hypertension, and asthma. Thirty-five percent of adults in the U.S. have MetDys, yet the impact of MetDys on susceptibility to occupational hazards is unknown. The aim of this study was to determine the potential of HFWD-consumption to alter inhaled crystalline silica dust-induced metabolic responses. Six-wk old male F344 rats were fed a HFWD (45 kcal % fat, sucrose 22.2 % by weight) or standard rat chow (STD, controls), and exposed to silica-inhalation (6 h/d, 5 d/wk, 39 d; Min-U-Sil 5®, 15 mg/m3) or filtered air. Indices of MetDys and systemic inflammation were measured at 0, 4, and 8 wk following cessation of silica exposure. At 8 wk post-exposure, silica reduced serum leptin and adiponectin levels, and increased arterial pulse frequency. HFWD-consumption induced weight gain, altered adipokines, liver, kidney, and pancreatic function, and increased tail artery blood flow. At 8 wk in HFWD + SIL-treated animals, the levels of serum pro-inflammatory cytokines (IFN-γ, CXCL-1, TNF-α, IL-1β, IL-4, IL-5, IL-6, IL-10 and IL-13) were increased compared to STD + SIL but were less than HFWD + AIR-induced levels. In conclusion, consumption of a HFWD altered silica-induced metabolic responses and silica exposure disrupted AT endocrine function. These findings demonstrate previously unknown interactions between HFWD-consumption and occupational silica exposure.

Keywords: Adipokines; Adipose tissue; Cytokines; Inflammation; Obesity; Silicosis.


Conflict of interest statement

The authors report no declarations of interest.

Figures

Fig. 1
Fig. 1
Experimental design for HFWD-induction of MetDys, silica inhalation exposure and endpoint experiments. A) Describes the design for single endpoint experiments using separate cohorts of animals (n = 8 for each group). B) Describes the design for repeated measures of fasting glucose and LDF experiments.
Fig. 2
Fig. 2
Graphs indicate measures of body weight (A), length (B), body mass index (BMI) (C), girth (D), and fat pad weight (E), at 0, 4 and 8 wk post-silica exposure. Consumption of a HFWD increased animal body and fat pad weight, and abdominal girth, at 0 and 8 wk. Silica exposure had no effect. Solid lines indicate significant differences between different exposure groups at a given time point. (P < 0.05; n = 6 – 8).
Fig. 3
Fig. 3
Leptin level (left panel) was increased at 0 wk by both silica and HFWD exposure at 0 wk but reduced by silica in both STD and HFWD groups at 8 wk. Adiponectin levels (right panel) were reduced by both silica and HFWD at all time points compared to STD exposure alone. These results indicate that both diet and silica exposure alter adipose tissue endocrine function. Solid lines indicate significant differences between different exposure groups at a given time point. (P < 0.05; n = 6 – 8 for each group).
Fig. 4
Fig. 4
Effects of HFWD and silica inhalation on total cholesterol (A), HDL (B), and triglycerides (C) are shown. While HFWD initially increased cholesterol in both air and silica exposed groups at 0 wk compared to their STD controls, there were no differences at 4 wk, and levels decreased in the HFWD + SIL group by 8 wk compared to all other groups (A). HDL was reduced by HFWD in both air and silica groups at 0 wk but was only reduced by HFWD + SIL at 4 wk, followed by an increase in HDL by HFWD + SIL compared to STD + SIL (B). Triglycerides were reduced by HFWD in both exposure groups at all time points compared to their diet controls; at 8 wk triglycerides were significantly increased in the STD + SIL group compared to STD + AIR control (C). Solid lines indicate significant differences between different exposure groups at a given time point. (P < 0.05; n = 4 – 8).
Fig. 5
Fig. 5
Effects of HFWD and silica inhalation on fasting glucose and non-fasting insulin. Fasting glucose (left panel) was reduced by silica reduced at 0 wk, and HFWD decreased fasting glucose levels at 0 and 8 wk compared to STD + AIR. Insulin levels (right panel) were increased by HFWD at 0 wk and 4 wk; HFWD + SIL reduced the insulin level at 0 wk compared to HFWD. Solid lines indicate significant differences between different exposure groups at a given time point. (P < 0.05; n = 7 – 8).
Fig. 6
Fig. 6
Consumption of HFWD alters blood chemistry panel. (A) Blood urea nitrogen (BUN) was decreased by HFWD-consumption at 8 wk, (B) creatine (CRE) was increased by HFWD-consumption at all time points, (C) BUN/CREA was decreased by HFWD in both air and silica exposed groups. (D) Albumin (ALB) was decreased by HFWD at 4 wk only, while (E) globulin (GLOB) was altered and (F) ALB/GLOB ratio was decreased by HFWD-consumption in both air and silica exposure groups. Solid lines indicate significant differences between different exposure groups at a given time point. (P < 0.05; n = 4 – 8).
Fig. 7
Fig. 7
Combined exposure HFWD + SIL increased (A) white blood cells (WBC) at 8 wk compared to all groups and WBCs within the HFWD + SIL group over time. (B) Neutrophils (NEUT) levels were increased in the HFWD + SIL group compared to all other groups at all time points and within the HFWD + SIL group over time. (C) Reticulocytes (RET) were elevated at 4 wk within the HFWD + AIR group compared to 0 and 8 wk, while RETs increased over time within the HFWD + SIL group. Solid lines indicate significant differences between different exposure groups at a given time point; dashed lines indicate significant differences within a single exposure group compared at different time points. (P < 0.05; n = 4 – 8).
Fig. 8
Fig. 8
Effects of HFWD and silica inhalation on serum proinflammatory cytokines: (A) IFNγ, (B) KC/GRO, (C) TNFα, (D) IL-1β, (E) IL-4, (F) IL-5, (G) IL-6, (H) IL-10, and (I) IL-13. Silica exposure (STD + SIL) had little effect on systemic cytokines while HFWD consumption increased systemic cytokines at all time points (A-I). At 8 wk, HFWD + SIL reduced all HFWD-induced cytokines (A – I). ND indicates cytokine levels below LLOD. [LLODs (pg/mL): IFNγ = 0.65; IL-1β = 6.92; IL-4 = 0.69; IL-5 = 14.10; IL-6 = 13.80; KC/GRO = 1.04; TNFα = 0.72]. (P < 0.05; n = 8).
Fig. 9
Fig. 9
Effects of HFWD and silica inhalation on changes in tail artery function measured by the LDF technique. (A) HFWD + AIR increased mean blood flow compared to STD + AIR control at all time points. Changes in vasodilation (B) and vasoconstriction (C) within groups are shown over time. Silica increased vasodilation and vasoconstriction over time from pre-exposure to 8 wk in both STD and HFWD groups. HFWD increased arterial vasodilation and constriction from pre-exposure to 0 wk in both air and silica exposed groups. Combined HFWD + SIL had a cumulative effect on arterial dilation and constriction at both 0 and 8 wk compared to pre-exposure. Solid lines indicate significant differences between different exposure groups at a given time point. (P < 0.05; n = 8).
None

Similar articles

Cited by

References

    1. Jéquier E. Leptin signaling, adiposity, and energy balance. Ann. N. Y. Acad. Sci. 2002;967:379–388. - PubMed
    1. Kadowaki T., Yamauchi T., Kubota N., Hara K., Ueki K., Tobe K. Adiponectin and adiponectin receptors in insulin resistance, diabetes, and the metabolic syndrome. J. Clin. Invest. 2006;116(7):1784–1792. - PMC - PubMed
    1. Barra N.G., Henriksbo B.D., Anhê F.F., Schertzer J.D. The NLRP3 inflammasome regulates adipose tissue metabolism. Biochem. J. 2020;477(6):1089–1107. - PubMed
    1. Wu K.K., Cheung S.W., Cheng K.K. Nlrp3 inflammasome activation in adipose tissues and its implications on metabolic diseases. Int. J. Mol. Sci. 2020;21(11) - PMC - PubMed
    1. Weisberg S.P., McCann D., Desai M., Rosenbaum M., Leibel R.L., Ferrante A.W., Jr. Obesity is associated with macrophage accumulation in adipose tissue. J. Clin. Invest. 2003;112(12):1796–1808. - PMC - PubMed