. 2021 Dec 17:11:740120.
doi: 10.3389/fonc.2021.740120. eCollection 2021.

High ATF4 Expression Is Associated With Poor Prognosis, Amino Acid Metabolism, and Autophagy in Gastric Cancer

Affiliations

High ATF4 Expression Is Associated With Poor Prognosis, Amino Acid Metabolism, and Autophagy in Gastric Cancer

Mingliang Wang et al. Front Oncol. .

Abstract

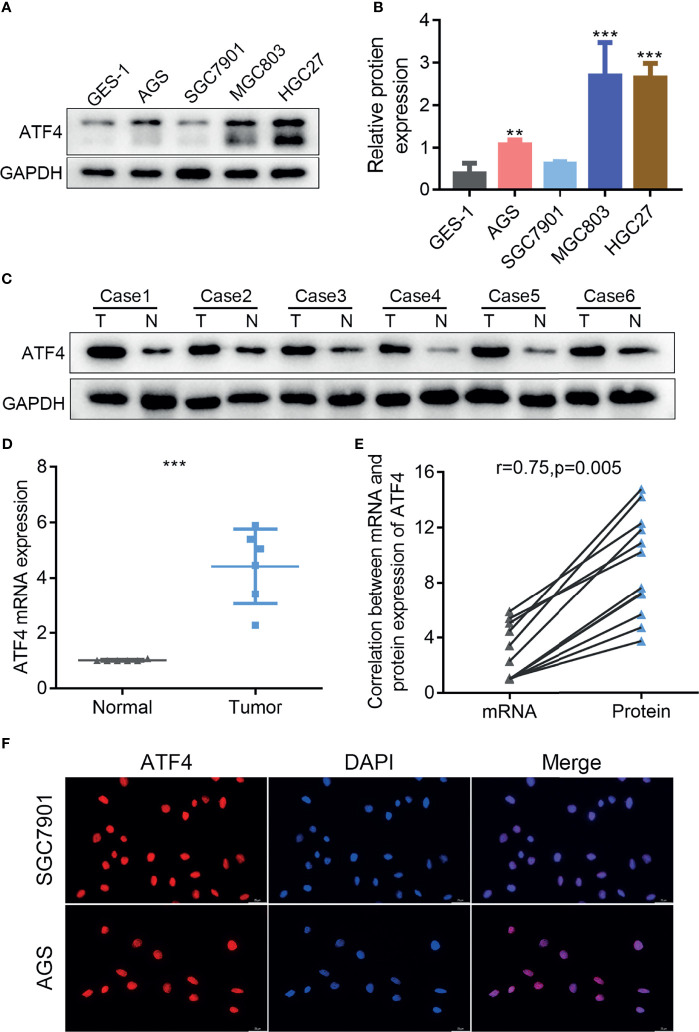
Background: The role of activating transcription factor 4 (ATF4) underlying gastric cancer (GC) remains unclear. The purpose of this study was to investigate the expression levels and biological functions of ATF4 in GC.

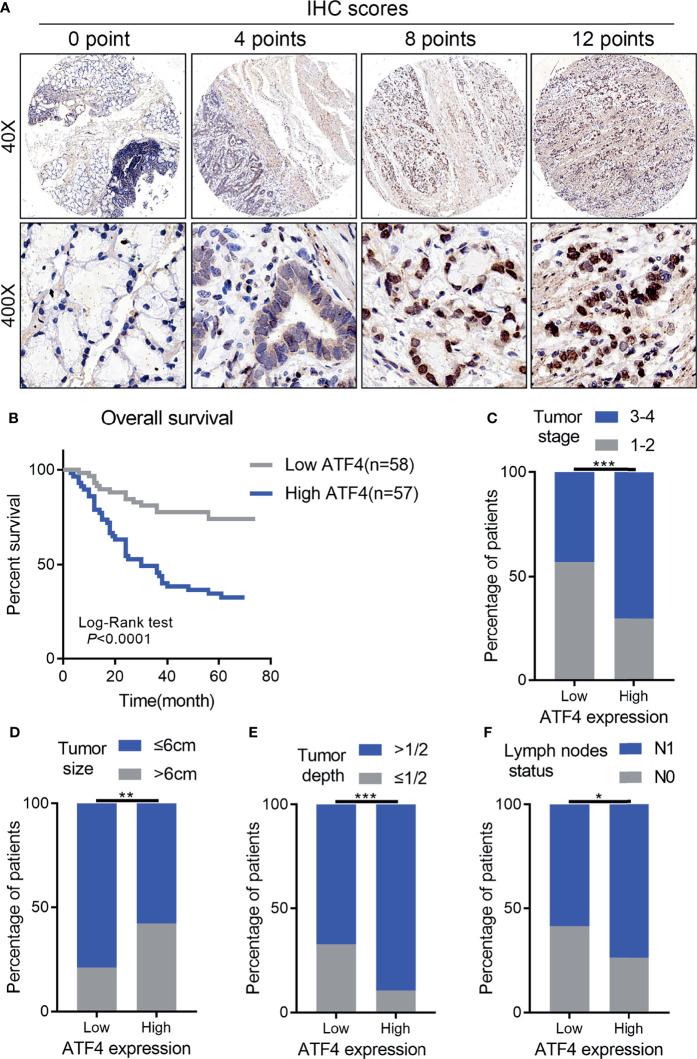
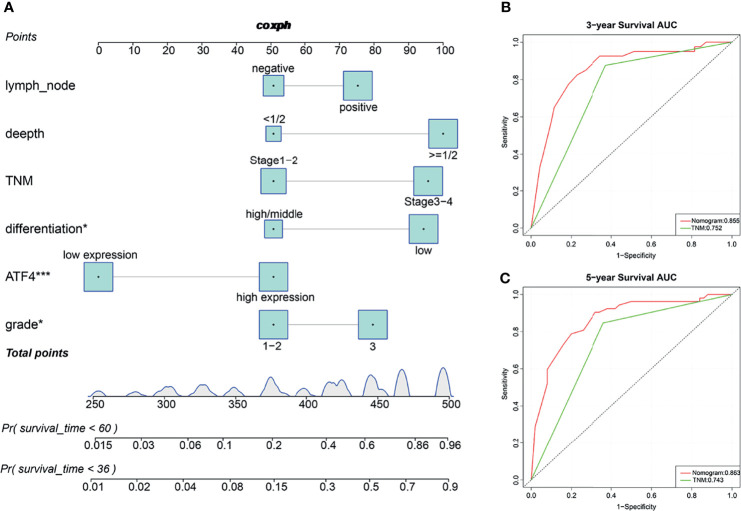
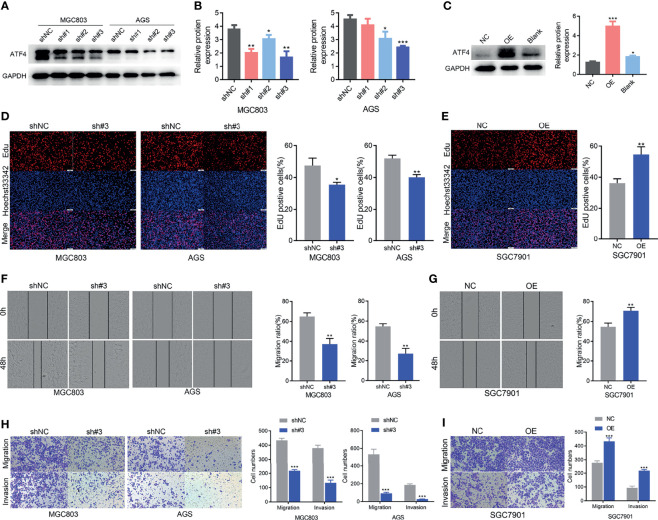
Methods: Expression of ATF4 was detected by quantitative PCR (qPCR), Western blotting, and immunohistochemistry. Cox regression was used for survival analysis and the construction of the nomogram. Immunofluorescence was used to identify the intracellular localization of ATF4. Knockdown and overexpression of ATF4 in GC cells followed by wound healing and Transwell assays, EdU and Calcein-AM/propidium iodide (PI) staining, and cell cycle detection were performed to examine its function in vitro. Transmission electron microscopy was performed to assess the autophagy levels upon ATF4 silencing. Kyoto Encyclopedia of Genes and Genomes (KEGG) analysis and gene set enrichment analysis (GSEA) were used to determine gene enrichment. SPSS 22.0 software, GraphPad Prism 7.0, and R version 3.6.1 were used for statistical analysis.

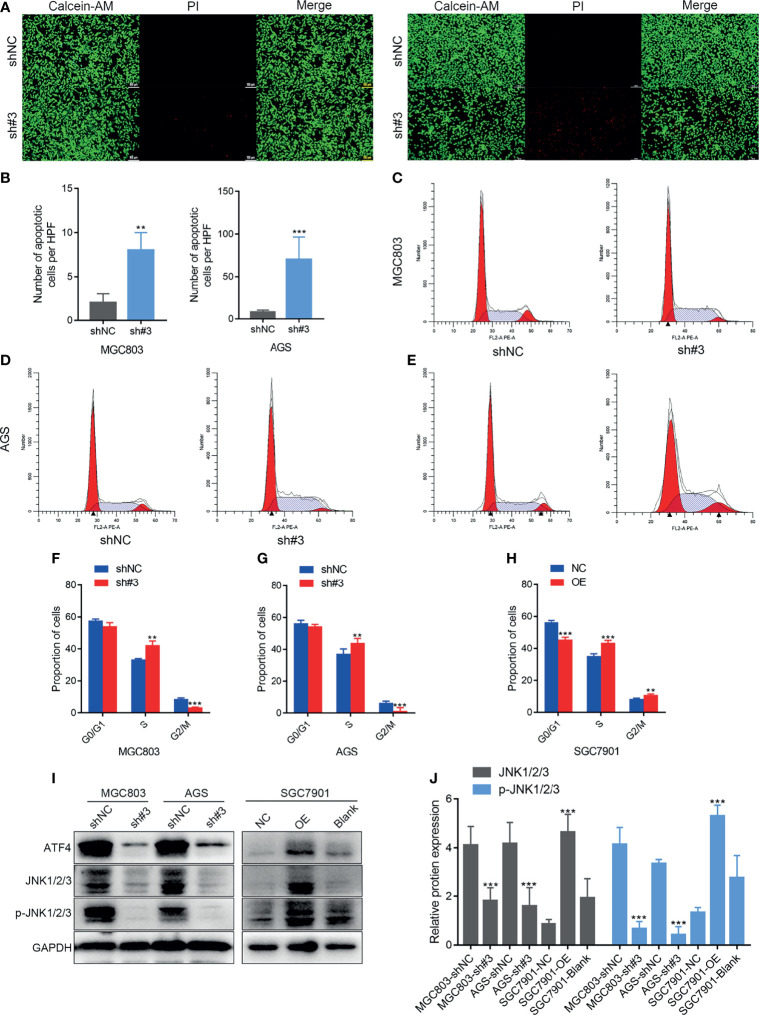
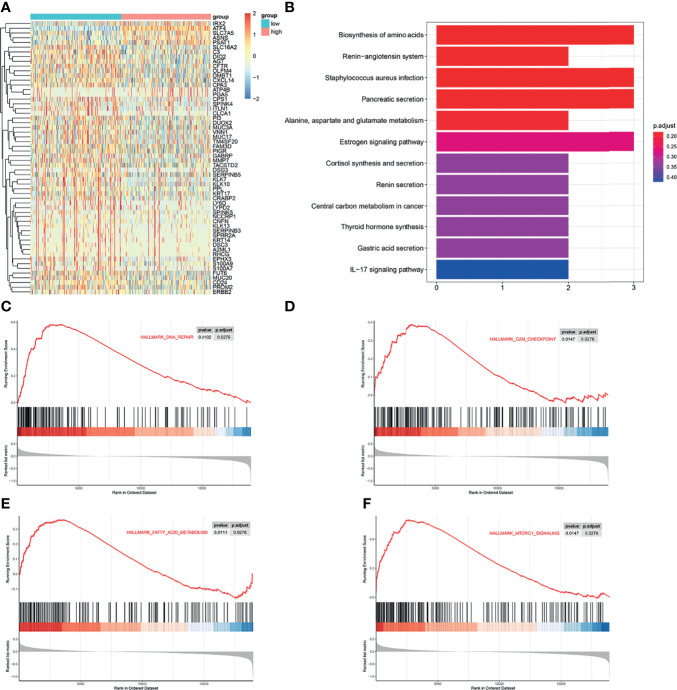
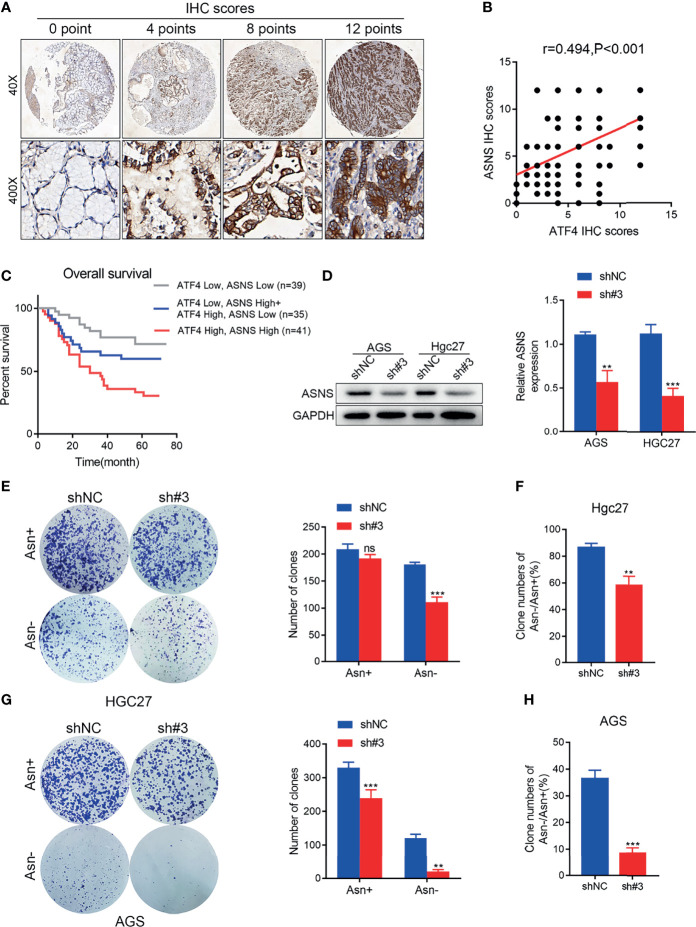
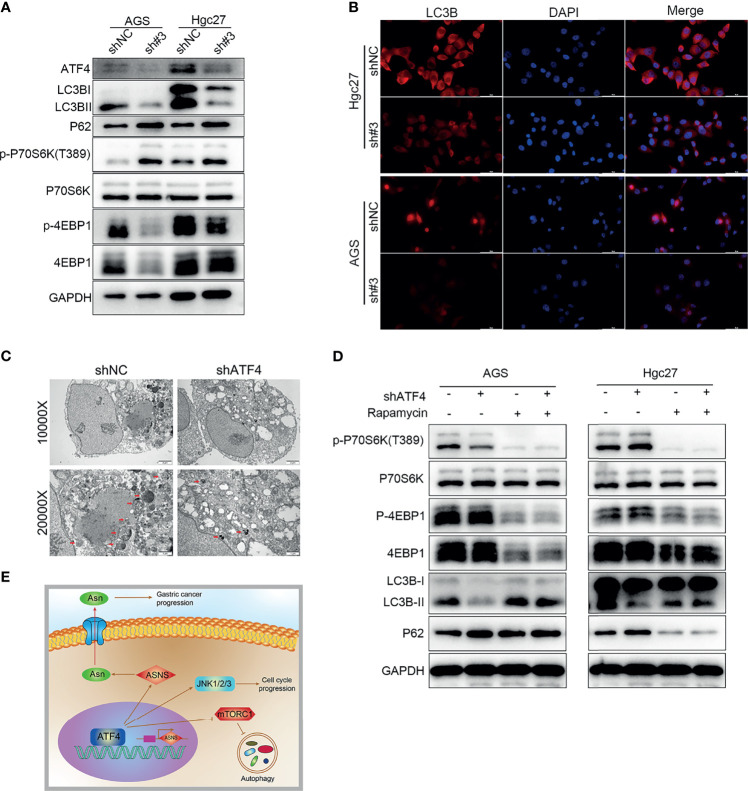
Results: ATF4 expression was upregulated in GC cells and tissues compared with corresponding normal tissues. Survival analysis suggested that a high ATF4 expression was strongly associated with worse overall survival (OS) of GC patients (p < 0.001). The nomogram and the receiver operating characteristic (ROC) curves demonstrated that ATF4 was a highly sensitive and specific prognostic marker of GC [C-index = 0.797, area under the ROC curve (AUC) of 3-year OS = 0.855, and AUC of 5-year OS = 0.863]. In addition, ATF4 knockdown inhibited the cell proliferation, migration, invasion, and cell cycle progression of GC cells in vitro, while overexpression of ATF4 exerted the opposite effects. Bioinformatics analysis showed that ATF4 could promote GC progression possibly by regulating asparagine (Asn) metabolism and autophagy pathways. Further experiments indicated that ATF4 expression was significantly positively correlated with ASNS expression. The inhibition of cell clone formation in Asn-deprived conditions was more significant in the shATF4 group. Finally, we found that ATF4 promoted autophagy through regulating the mTORC1 pathway in GC cells.

Conclusion: These findings suggested that ATF4 can significantly promote GC development and serve as an independent prognostic factor for GC.

Keywords: ATF4; activating transcription factor 4; autophagy; gastric cancer; metabolism; nomogram.


Conflict of interest statement

The authors declare that the research was conducted in the absence of any commercial or financial relationships that could be construed as a potential conflict of interest.

Figures

Figure 1
Figure 1
The expression of activating transcription factor 4 (ATF4) is elevated in gastric cancer (GC) cells and tissues and localizes to the nucleus. (A) Western blotting was used to measure the protein level of ATF4 in the GES-1 and GC cell lines. (B) Relative amount of ATF4 protein is presented as the mean ± SD of three experimental replicates (unpaired t-test: p < 0.05). (C, D) The ATF4 levels in tumor tissues (T) and corresponding nontumor tissues (N) from six GC patients were analyzed using immunoblotting and qRT-PCR (unpaired t-test: p = 0.0001). (E) Correlation analysis between the mRNA and protein expressions of ATF4 in six pairs of GC tissues (Pearson’s correlation analysis: r = 0.75, p = 0.005). (F) Immunofluorescence confirms the subcellular localization of ATF4 to the nucleus. **p < 0.01; ***p < 0.001.
Figure 2
Figure 2
High activating transcription factor 4 (ATF4) expression is strongly associated with tumor aggressiveness and overall survival in gastric cancer (GC). (A) Representative images of ATF4 expression in tissue arrays of GC patients (n = 115). The final immunohistochemical (IHC) score was determined as the product of the staining intensity and the staining area. (B) Overall survival of GC patients with high and low ATF4 expressions (log-rank test: p < 0.0001). (C–F) Correlation between ATF4 expression and tumor stage, tumor size, tumor depth, and lymph node metastasis (chi-square test: p < 0.05). *p < 0.05; **p < 0.01; ***p < 0.001.
Figure 3
Figure 3
Predictive nomograms and receiver operating characteristic (ROC) curves of the 3- and 5-year overall survival (OS) of gastric cancer (GC) patients. (A) Predictive nomograms of the 3- and 5-year OS in tissue arrays of GC patients (n = 115). (B) ROC curves based on the nomograms of the 3-year OS in tissue arrays of GC patients (AUC = 0.855). (C) ROC curves based on the nomograms of the 5-year OS in tissue arrays of GC patients (AUC = 0.863). AUC, area under the ROC curve. *p < 0.05; ***p < 0.001.
Figure 4
Figure 4
Activating transcription factor 4 (ATF4) promotes gastric cancer (GC) cell proliferation, migration, and invasion in vitro. (A, B) Western blotting was used to verify the efficiency of ATF4 knockdown. sh#3 showed a better knockdown efficiency. (C) Western blotting was used to verify the efficiency of ATF4 overexpression. (D, E) EdU assays for GC cells after ATF4 silencing and overexpression. The results suggested that cell growth was inhibited upon ATF4 knockdown in MGC803 (35.4% vs. 47.4%) and AGS cells (41.0% vs. 51.9%), while the overexpression of ATF4 exerted the opposite effects in SGC7901 cells (54.5% vs. 36.2%). (F, G) Cell migration in the MGC803, AGS, and SGC7901 cell lines after infection after scratch wound healing. Cell migration capacity was inhibited in MGC803 and AGS cells and was promoted in SGC7901 cells. (H) Transwell assays indicated that silencing ATF4 markedly decreases the invasion and vertical migration capacities of MGC803 (64.9% vs. 37.2%) and AGS cells (54.6% vs. 26.9%). (I) The invasion and vertical migration capacities in SGC7901 cells were improved after ATF4 overexpression (54.5% vs. 70.6%). Unpaired t-tests were used. *p < 0.05; **p < 0.01; ***p < 0.001.
Figure 5
Figure 5
Activating transcription factor 4 (ATF4) silencing promotes cell death and inhibits S phase progress in vitro. (A, B) Calcein-AM/propidium iodide (PI) staining after shATF4 stable polyclonal MGC803 and AGS cells were established, respectively. (C–H) Cell cycle analysis for shATF4 and ATF4-WT lentivirus-infected MGC803, AGS, and SGC7901 cells after antibiotic selection for 2 weeks. (C, D, F, G) The proportion of S phase cells was increased and the proportion of G2M phase cells was decreased after ATF4 knockdown in MGC803 and AGS cells. (E, H) The proportion of G0/G1 phase cells was decreased, while the proportions of S and G2M phase cells were increased after ATF4 overexpression. (I, J) Relative protein expressions of JNK1/2/3 and p-JNK1/2/3 after ATF4 knockdown and overexpression. Unpaired t-tests were used. **p < 0.01; ***p < 0.001.
Figure 6
Figure 6
Activating transcription factor 4 (ATF4) promotes gastric cancer (GC) progression possibly via regulating the amino acid metabolism and autophagy pathways. (A) Heatmap of the differentially expressed genes in GC patients with different expression levels of ATF4. (B) Kyoto Encyclopedia of Genes and Genomes (KEGG) analysis was used to identify the significantly enriched biological processes associated with the differentially expressed genes in GC patients. (C–F) Gene set enrichment analysis (GSEA) showed that ATF4 may be related to DNA repair, G2M checkpoint, mTORC1 pathway, and amino acid metabolism processes.
Figure 7
Figure 7
Activating transcription factor 4 (ATF4) may regulate asparagine (Asn) metabolism by promoting asparagine synthetase (ASNS) expression in gastric cancer (GC). (A) Representative images for ASNS expression in tissue arrays of GC patients (n = 115). The final immunohistochemical (IHC) score was determined as the product of the staining intensity and the staining area. (B) Pearson’s correlation analysis for the levels of ATF4 and ASNS proteins in patients with GC measured by IHC (r = 0.494, p < 0.001). (C) A combination of the expressions of ATF4 and ASNS can more accurately predict overall survival (OS) in GC patients. Patients with high expressions of both ATF4 and ASNS showed the worst survival status. (D) ATF4 silencing significantly inhibited the level of ASNS in AGS and HGC27 cells. (E, G) Clone formation assay in medium supplemented or deprived of Asn after ATF4 knockdown. The results confirmed that the inhibition of cell clone formation under Asn deprivation was more significant in the ATF4 interference group. (F, H) Statistical tests comparing the inhibition of colony forming ability in the control and ATF4 interference groups under Asn-deprived conditions. Unpaired t-tests were used. **p < 0.01; ***p < 0.001; ns, not significant.
Figure 8
Figure 8
Silencing activating transcription factor 4 (ATF4) inhibits autophagy through regulating the mTORC1 pathway in gastric cancer (GC) cells. (A) Changes in LC3B, P62, p-P70S6K, and p-4EBP1 protein levels after ATF4 knockdown. (B) LC3B is detected by immunofluorescence (IF) after inhibition of ATF4 expression, and the level of LC3B was significantly decreased upon ATF4 knockdown. (C) TEM images showing that autophagic vacuoles in AGS cells decreased markedly upon ATF4 silencing. (D) Differences in the autophagy levels disappeared between the shATF4 and shNC groups after inhibition of the mTORC1 pathway. (E) Schematic depicting the role of ATF4 in GC. ATF4 may upregulate asparagine (Asn) metabolism by promoting asparagine synthetase (ASNS) expression, thereby facilitating GC progression; moreover, ATF4 can inhibit the mTORC1 pathway and subsequently suppress the level of autophagy in GC cells.

Similar articles

Cited by

References

    1. Bray F, Ferlay J, Soerjomataram I, Siegel RL, Torre LA, Jemal A. Global Cancer Statistics 2018: GLOBOCAN Estimates of Incidence and Mortality Worldwide for 36 Cancers in 185 Countries. CA Cancer J Clin (2018) 68(6):394–424. doi: 10.3322/caac.21492 - DOI - PubMed
    1. Muro K, Van Cutsem E, Narita Y, Pentheroudakis G, Baba E, Li J, et al. . Pan-Asian Adapted ESMO Clinical Practice Guidelines for the Management of Patients With Metastatic Gastric Cancer: A JSMO-ESMO Initiative Endorsed by CSCO, KSMO, MOS, SSO and TOS. Ann Oncol (2019) 30(1):19–33. doi: 10.1093/annonc/mdy502 - DOI - PubMed
    1. Shitara K, Doi T, Dvorkin M, Mansoor W, Arkenau HT, Prokharau A, et al. . Trifluridine/tipiracil Versus Placebo in Patients With Heavily Pretreated Metastatic Gastric Cancer (TAGS): A Randomised, Double-Blind, Placebo-Controlled, Phase 3 Trial. Lancet Oncol (2018) 19(11):1437–48. doi: 10.1016/S1470-2045(18)30739-3 - DOI - PubMed
    1. Fuchs CS, Doi T, Jang RW, Muro K, Satoh T, Machado M, et al. . Safety and Efficacy of Pembrolizumab Monotherapy in Patients With Previously Treated Advanced Gastric and Gastroesophageal Junction Cancer: Phase 2 Clinical KEYNOTE-059 Trial. JAMA Oncol (2018) 4(5):e180013. doi: 10.1001/jamaoncol.2018.0013 - DOI - PMC - PubMed
    1. Digklia A, Wagner AD. Advanced Gastric Cancer: Current Treatment Landscape and Future Perspectives. World J Gastroenterol (2016) 22(8):2403–14. doi: 10.3748/wjg.v22.i8.2403 - DOI - PMC - PubMed