. 2021 Dec 16:9:786758.
doi: 10.3389/fcell.2021.786758. eCollection 2021.

The Tongue Squamous Carcinoma Cell Line Cal27 Primarily Employs Integrin α6β4-Containing Type II Hemidesmosomes for Adhesion Which Contribute to Anticancer Drug Sensitivity

Affiliations

The Tongue Squamous Carcinoma Cell Line Cal27 Primarily Employs Integrin α6β4-Containing Type II Hemidesmosomes for Adhesion Which Contribute to Anticancer Drug Sensitivity

Ana Tadijan et al. Front Cell Dev Biol. .

Abstract

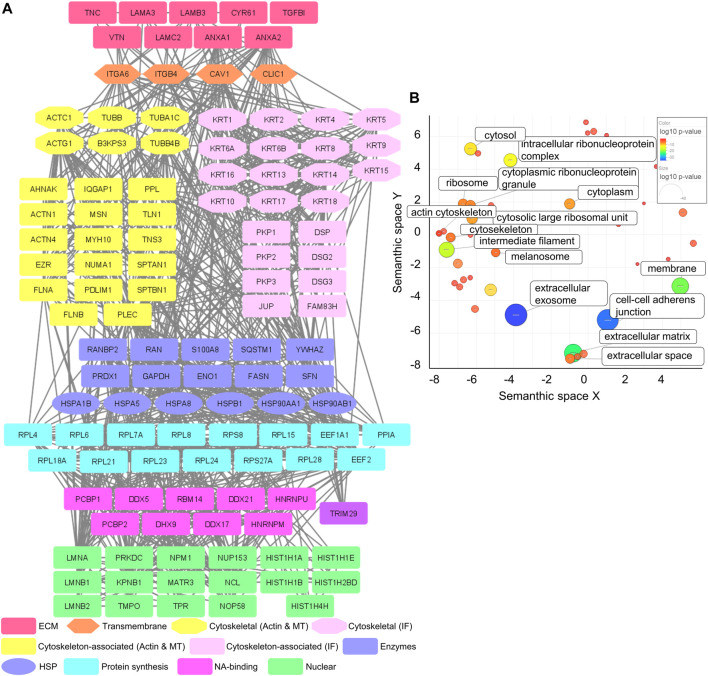
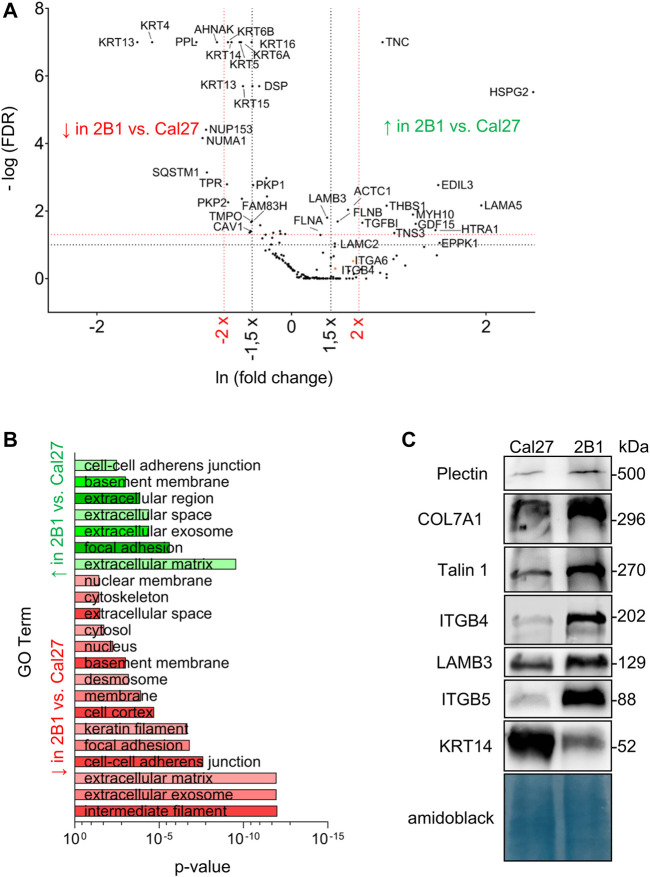
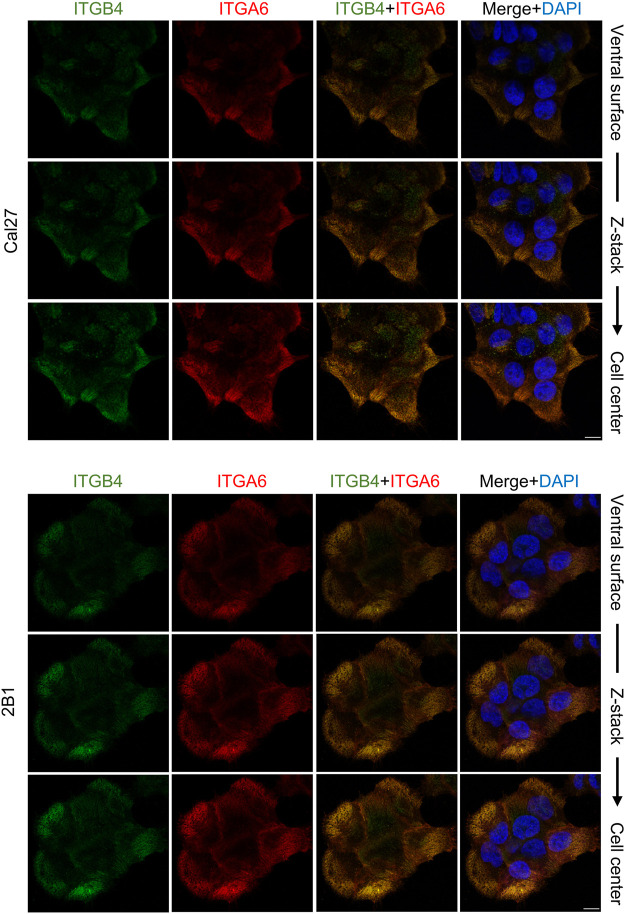
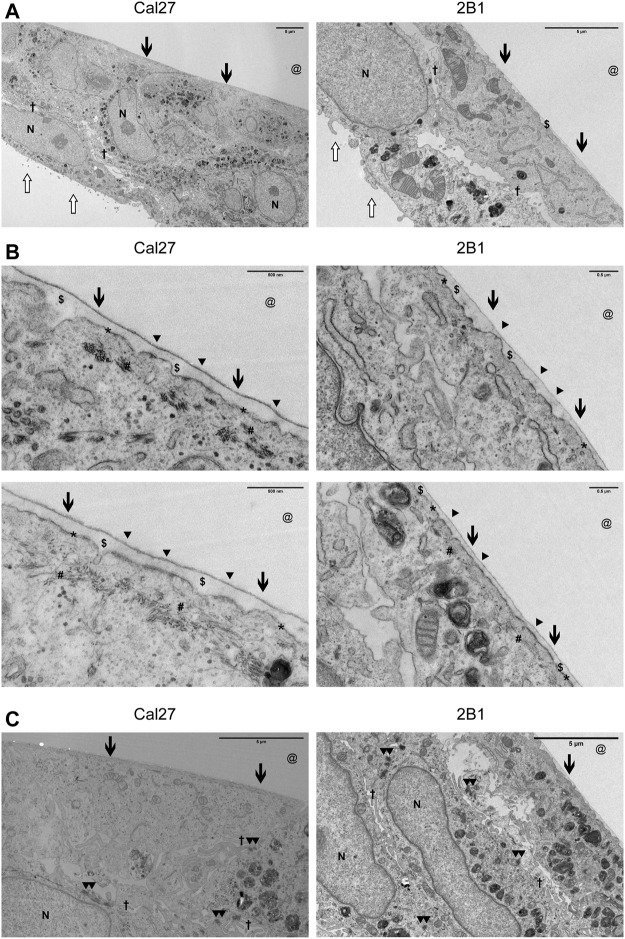
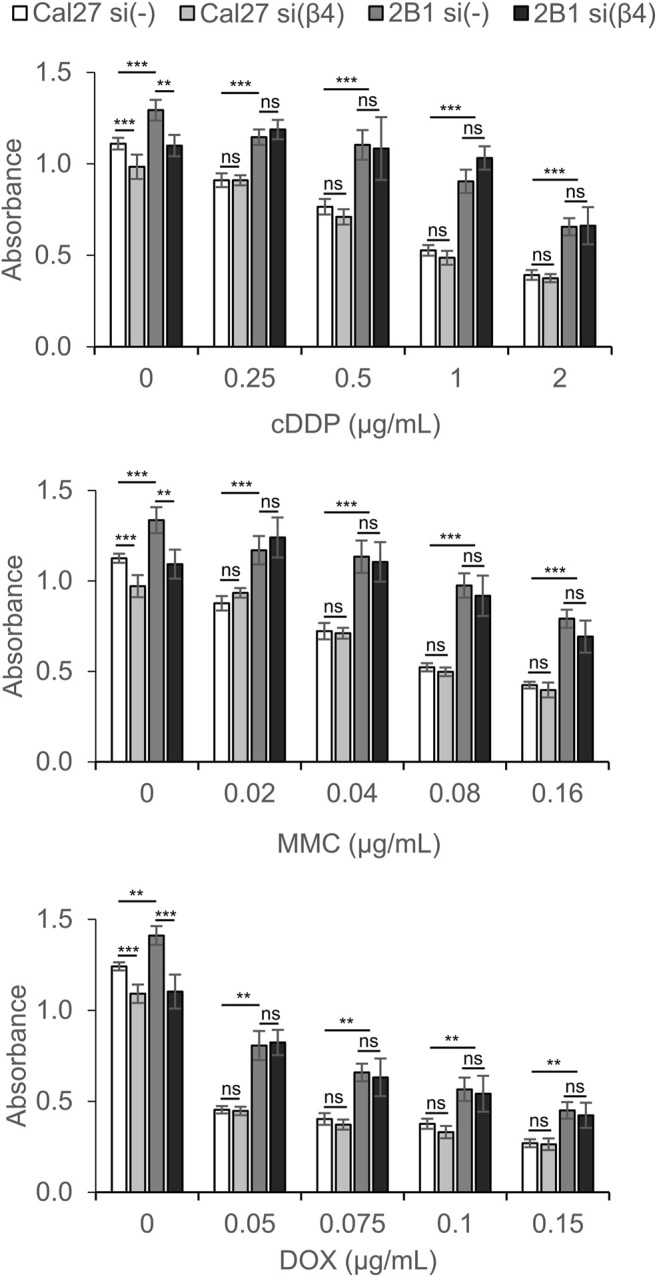
Integrins are heterodimeric cell surface glycoproteins used by cells to bind to the extracellular matrix (ECM) and regulate tumor cell proliferation, migration and survival. A causative relationship between integrin expression and resistance to anticancer drugs has been demonstrated in different tumors, including head and neck squamous cell carcinoma. Using a Cal27 tongue squamous cell carcinoma model, we have previously demonstrated that de novo expression of integrin αVβ3 confers resistance to several anticancer drugs (cisplatin, mitomycin C and doxorubicin) through a mechanism involving downregulation of active Src, increased cell migration and invasion. In the integrin αVβ3 expressing Cal27-derived cell clone 2B1, αVβ5 expression was also increased, but unrelated to drug resistance. To identify the integrin adhesion complex (IAC) components that contribute to the changes in Cal27 and 2B1 cell adhesion and anticancer drug resistance, we isolated IACs from both cell lines. Mass spectrometry (MS)-based proteomics analysis indicated that both cell lines preferentially, but not exclusively, use integrin α6β4, which is classically found in hemidesmosomes. The anticancer drug resistant cell clone 2B1 demonstrated an increased level of α6β4 accompanied with increased deposition of a laminin-332-containing ECM. Immunofluorescence and electron microscopy demonstrated the formation of type II hemidesmosomes by both cell types. Furthermore, suppression of α6β4 expression in both lines conferred resistance to anticancer drugs through a mechanism independent of αVβ3, which implies that the cell clone 2B1 would have been even more resistant had the upregulation of α6β4 not occurred. Taken together, our results identify a key role for α6β4-containing type II hemidesmosomes in regulating anticancer drug sensitivity.

Keywords: adhesome; anticancer drug sensitivity; hemidesmosome; integrin alpha 6 beta 4; integrin alpha v beta 3; integrin crosstalk; keratins 5/14; laminin-332.


Conflict of interest statement

The authors declare that the research was conducted in the absence of any commercial or financial relationships that could be construed as a potential conflict of interest.

Figures

FIGURE 1
FIGURE 1
Mass spectrometry analysis of IACs isolated from Cal27 cells. (A) Protein–protein interaction network of proteins identified in IACs isolated from Cal27 cells. Shapes represent proteins identified via MS and are labelled with gene symbols and manually grouped and assigned color according to their functional group, as indicated on the left. Only proteins identified with a minimal number of four spectral counts in at least three out of five analyzed biological replicates, FDR < 5%, probability for protein identification ≥ 99.9% were visualized. The network was generated with Cytoscape 3.7.2. (B) IACs isolated from Cal27 were enriched with proteins connected to the membrane, cytoskeleton and ECM components. Proteins from (A) were assigned to functional groups using the DAVID GO database (GOTERM_CC_DIRECT) and visualized using the REViGO tool, where p-values related to GO terms of cellular components were represented by the color bar and size of the circle. Statistically significant GO terms (p > 0.05) are presented.
FIGURE 2
FIGURE 2
Analysis and validation of IACs isolated from Cal27 cells and clone 2B1. (A) Volcano plot analysis of proteins detected in IACs isolated from Cal27 cells versus clone 2B1. IAC proteins from Cal27 and 2B1 cells are visualized as volcano plot after the analysis with QSpec/QProt to generate -Log (FDR) and fold change values. Cut off values of −Log (FDR) ≥ 1 (red horizontal dotted line) corresponding to FDR ≤ 0.05 and −Log (FDR) ≥ 1,3 (black horizontal dotted line) corresponding to FDR ≤ 0.1; and fold change ≥ 1.5 (black vertical dotted line) or 2 (red vertical dotted line) were used. Each dot on the plot represents 1 protein. Proteins with significantly different abundance between IACs of Cal27 and 2B1 cells, and of interest for this paper are marked with their gene name. Upper left quadrant–proteins detected with lower levels of spectra in 2B1, upper right quadrant–proteins detected with higher levels of spectra in 2B1, compared to Cal27. For this analysis, only proteins identified with a minimal number of spectral counts ≥ 4 in at least three out of five biological replicates in either of Cal27 or 2B1 set were used, FDR < 5%, probability for protein identification ≥ 99.9% were visualized. (B) DAVID GO analysis of proteins from (A) with FDR ≤ 0.1 and fold change ≥ or ≤ 1.5, detected with higher (green) and lower (red) abundances in 2B1 as compared to Cal27. Statistically significant GO terms were presented in reverse x-axis of p-value from lowest (top) to the highest significance (bottom). Green represents GO terms annotated to the proteins whose abundance is higher in 2B1 than Cal27, and red to reverse. The p-value represents Benjamini corrected p-value. (C) WB analysis of IAC proteins from Cal27 and 2B1 cells. Seventy-two hours after seeding, IACs were isolated and WB analysis was performed. The results presented are representative of two independent experiments yielding similar results. PLEC, plectin; COL7A1, collagen VII; TLN1, talin 1; ITGB4, integrin subunit β4; LAMB3, laminin subunit β3; ITGB5, integrin subunit β5; KRT-14, keratin 14.
FIGURE 3
FIGURE 3
Integrin subunits α6 and β4 co-localize in both Cal27 or 2B1 cells. Confocal z stack images of Cal27 and 2B1 cells. Forty-eight hours after seeding on coverslips, cells were fixed, permeabilized, incubated with antibodies against integrin anti-β4 (ITGB4) antibody followed by Alexa-Fluor 488-conjugated antibody (green) and integrin anti-α6 (ITGA6) antibody followed by Alexa-Fluor 555-conjugated antibody (red). Nuclei were stained with DAPI (blue). Analysis was performed using TCS SP8 Leica. Scale bar = 10 μm.
FIGURE 4
FIGURE 4
Cal27 and 2B1 cells form HD-like structures which are indicative as type II HDs. (A–C) Cal27 and 2B1 cells were cultured on Aclar for up to 7 days and transverse sections of the cell-ECM interface were prepared, imaged by TEM, and a range of magnifications shown. (A) Lower magnification images of cell monolayers that have formed a flattened basal surface with a thin layer of ECM ($) proximal to the area where the Aclar film (@) would have occupied. (B) Higher magnification images of the cell-ECM interface. Arrowheads () indicate the approximate position of some type II HDs (indicated from the extracellular side) which are located at the plasma membrane (*) and link to cytoplasmic cytokeratin filaments (#). (C) Areas of cells to illustrate the formation of desmosomes. All images are orientated with the cell-ECM interface towards the top of the images. Other symbols used are [N = nucleus; Open arrow = luminal side with microvilli; Filled arrow = basal surface next to ECM and aclar.; † = cell-cell junction where you can sometimes see electron dense desmosomes (▲▲) as shown in (C).
FIGURE 5
FIGURE 5
Cal27 and 2B1 cells demonstrate decreased sensitivity to CDDP, MMC or DOX upon knockdown of integrin β4 (si(β4)) as compared to control Cal27 and 2B1 cells transfected with control siRNA (si(-)). Twenty-four hours upon siRNA transfection, cells were seeded in 96-well plates and 24 h later treated with different concentrations of CDDP, MMC or DOX. Cytotoxicity was measured by MTT assay 72 h later. Average absorbance data ± S.D. indicating survival, are representative of at least three independent experiments yielding similar results. Data were analyzed by two-way ANOVA with Bonferroni post-test. ns, not significant; **p < 0.01; ***p < 0.001.

Similar articles

Cited by

References

    1. Ahmedah H., Patterson L., Shnyder S., Sheldrake H. (2017). RGD-Binding Integrins in Head and Neck Cancers. Cancers 9 (6), 56. 10.3390/cancers9060056 - DOI - PMC - PubMed
    1. Albiges-Rizo C., Destaing O., Fourcade B., Planus E., Block M. R. (2009). Actin Machinery and Mechanosensitivity in Invadopodia, Podosomes and Focal Adhesions. J. Cel Sci. 122, 3037–3049. 10.1242/jcs.052704 - DOI - PMC - PubMed
    1. Ambriović-Ristov A., Gabrilovac J., Čimbora-Zovko T., Osmak M. (2004). Increased Adenoviral Transduction Efficacy in Human Laryngeal Carcinoma Cells Resistant to Cisplatin Is Associated with Increased Expression of Integrin ?v?3 and coxsackie Adenovirus Receptor. Int. J. Cancer 110 (5), 660–667. 10.1002/ijc.20176 - DOI - PubMed
    1. Apweiler R., Bairoch A., Wu C. H., Barker W. C., Boeckmann B., Ferro S., et al. (2004). UniProt: The Universal Protein Knowledgebase. Nucleic Acids Res. 32 (DATABASE ISS.), D115–D119. Oxford Academic. 10.1093/nar/gky09210.1093/nar/gkh131 - DOI - PMC - PubMed
    1. Atanasova V. S., Russell R. J., Webster T. G., Cao Q., Agarwal P., Lim Y. Z., et al. (2019). Thrombospondin-1 Is a Major Activator of TGF-β Signaling in Recessive Dystrophic Epidermolysis Bullosa Fibroblasts. J. Invest. Dermatol. 139 (7), 1497–1505. Elsevier B.V.e5. 10.1016/j.jid.2019.01.011 - DOI - PubMed