. 2021 Dec 16:8:742458.
doi: 10.3389/fmed.2021.742458. eCollection 2021.

Interaction Between Arousals and Ventilation During Cheyne-Stokes Respiration in Heart Failure Patients: Insights From Breath-by-Breath Analysis

Affiliations

Interaction Between Arousals and Ventilation During Cheyne-Stokes Respiration in Heart Failure Patients: Insights From Breath-by-Breath Analysis

Gian Domenico Pinna et al. Front Med (Lausanne). .

Abstract

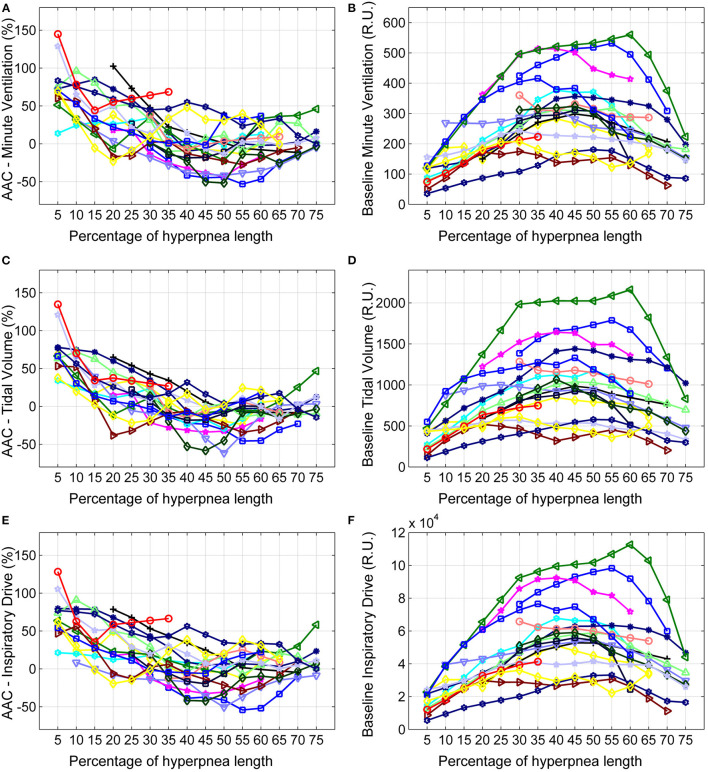
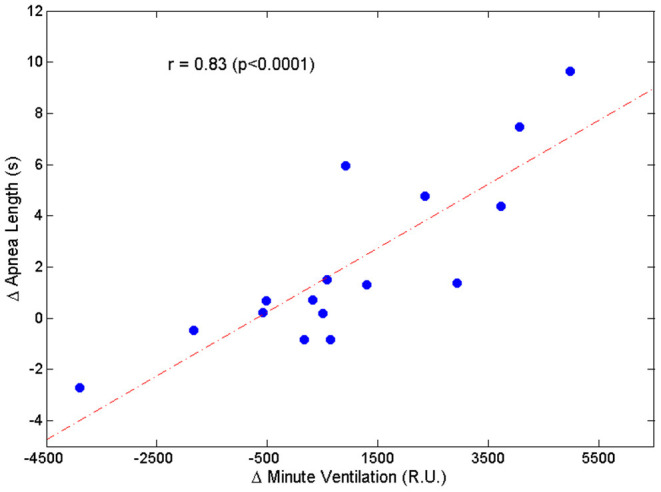
Study Objectives: Arousals from sleep during the hyperpneic phases of Cheyne-Stokes respiration with central sleep apnea (CSR-CSA) in patients with heart failure are thought to cause ventilatory overshoot and a consequent longer apnea, thereby sustaining and exacerbating ventilatory instability. However, data supporting this model are lacking. We investigated the relationship between arousals, hyperpnea and post-hyperpnea apnea length during CSR-CSA. Methods: Breath-by-breath changes in ventilation associated with the occurrence of arousal were evaluated in 18 heart failure patients with CSR-CSA, apnea-hypopnea index ≥15/h and central apnea index ≥5/h. The change in apnea length associated with the presence of arousal during the previous hyperpnea was also evaluated. Potential confounding variables (chemical drive, sleep stage) were controlled for. Results: Arousals were associated with a large increase in ventilation at the beginning of the hyperpnea (+76 ± 35%, p < 0.0001), that rapidly declined during its crescendo phase. Around peak hyperpnea, the change in ventilation was -8 ± 26% (p = 0.14). The presence of arousal during the hyperpnea was associated with a median increase in the length of the subsequent apnea of +4.6% (Q1, Q2: -0.7%, 20.5%; range: -8.5%, 36.2%) (p = 0.021). The incidence of arousals occurring at the beginning of hyperpnea and mean ventilation in the region around its peak were independent predictors of the change in apnea length (p = 0.004 and p = 0.015, respectively; R2 = 0.78). Conclusions: Arousals from sleep during CSR-CSA in heart failure patients are associated with a rapidly decreasing ventilatory overshoot at the beginning of the hyperpnea, followed by a tendency toward a slight ventilatory undershoot around its peak. On average, arousals are also associated with a modest increase in post-hyperpnea apnea length; however, large increases in apnea length (>20%) occur in about a quarter of the patients.

Keywords: apnea length; breathing instability; central apnea; hyperpnea; ventilatory overshoot.


Conflict of interest statement

The authors declare that the research was conducted in the absence of any commercial or financial relationships that could be construed as a potential conflict of interest.

Figures

Figure 1
Figure 1
Example of breath-by breath case-control matching in the assessment of the relationship between arousals and ventilation. Blue solid line: lung volume; red solid line: state-transition diagram providing continuous information (resolution: 250 ms) on the sleep-wake state of the subject [stage 1, 2 non-rapid eye movement (NREM) sleep or wakefulness (W)] (4); green solid line: estimated oxygen saturation (SpO2) at carotid chemoreceptors. (A) An arousal occurred during the hyperpneic phase of the 8th CSR-CSA cycle, potentially affecting several breaths (case breaths). A short (≈5 s) transition to NREM sleep during the arousal can also be noticed. (B) A matched control breath for the first case breath was found in the 19th CSR-CSA cycle (closest cycle). This case-control pair is indicated by an asterisk. By definition, the two breaths had similar mean SpO2 (84.5 vs. 85.0%), similar duration of the hyperpneic phase (48 vs. 51 s) and same sleep stage (N2). RU, relative units.
Figure 2
Figure 2
Example of estimation of the time course of the arousal-associated change (AAC) in minute ventilation. (A) Raw time course of the AAC. Red stars represent AAC estimates for each consecutive breath of the hyperpnea (first, second etc.) as a function of percentage of hyperpnea length. Percentages are reported up to 75% of hyperpnea length due to missing data in almost all patients (see details in the Results section). (B) Linear interpolation of AAC estimates. (C) The AAC was re-computed (blue dots) at predefined percentages of hyperpnea length (5, 10, 15%, ….) in order to compare the time course of the AAC among patients.
Figure 3
Figure 3
Example of estimation of the time course of baseline minute ventilation during hyperpneas. (A) Raw time course of minute ventilation in the absence of arousals (see text). Red stars represent minute ventilation estimates for each consecutive breath of the hyperpnea (first, second etc.) as a function of percentage of hyperpnea length. (B) Linear interpolation of the estimates. (C) Minute ventilation was re-computed (blue dots) at predefined percentages of hyperpnea length (5, 10, 15%, ….) in order to compare the time course among patients. RU, relative units.
Figure 4
Figure 4
Example of the procedure to estimate the time course of oxygen saturation at carotid chemoreceptors. (A) Lung volume (blue line) and oxygen saturation at the finger (SpO2, red line) during CSR-CSA. (B) Same as (A) but the lung volume signal is replaced by the corresponding instantaneous minute ventilation signal. This signal was obtained using a previously developed method (29). To estimate the SpO2 signal at carotid chemoreceptors, the SpO2 signal at the finger was backward shifted in time as indicated by arrows. (C) Backward shifting was continued until the antiphase condition between the two signals was met (maximum value of the non-linear correlation coefficient between SpO2 and minute ventilation excluding apneas). The red line shows the estimated SpO2 signal at carotid chemoreceptors. RU, relative units.
Figure 5
Figure 5
Left: individual time course of the arousal-associated change (AAC) in minute ventilation (A), tidal volume (C) and inspiratory drive (E) as a function of the percentage of hyperpnea length. The AAC is expressed as a percentage of the average value of these parameters in the absence of arousals during hyperpneas (see equation 1). Right: individual time course of baseline values of minute ventilation (B), tidal volume (D) and inspiratory drive (F) during hyperpneas. RU, relative units.
Figure 6
Figure 6
Left: descriptive statistics of the time course of the arousal-associated change (AAC) in minute ventilation (A), tidal volume (C) and inspiratory drive (E) as a function of the percentage of hyperpnea length (middle point of each box: mean; box: mean ± SE; whiskers: mean ± 95% confidence interval). The AAC is expressed as a percentage of the average value of these parameters in the absence of arousals during hyperpneas (see equation 1). Whiskers not crossing the zero line indicate that the corresponding mean is significantly different from zero. Red solid lines are 4th-order polynomial fittings of mean values. Right: descriptive statistics of the time course of baseline values of minute ventilation (B), tidal volume (D) and inspiratory drive (F) during hyperpneas. The blue dashed-dotted line is the mean normalization factor used for the estimation of the AAC in each patient (i.e., the denominator of equation 1). The numbers at the bottom of left and right panels indicate in how many patients the AAC could be estimated (at least 5 case-control pairs were required for each breath). RU, relative units.
Figure 7
Figure 7
Relationship between the change in apnea length (Δ Apnea Length = average difference between the length of apneas preceded by a hyperpnea with arousal and the length of apneas preceded by a hyperpnea without arousal) and the corresponding change in mean ventilation (Δ Minute Ventilation = average difference between mean ventilation of hyperpneas with arousal and mean ventilation of hyperpneas without arousal).

References

    1. Bitter T, Westerheide N, Prinz C, Hossain MS, Vogt J, Langer C, et al. . Cheyne-Stokes respiration and obstructive sleep apnoea are independent risk factors for malignant ventricular arrhythmias requiring appropriate cardioverter-defibrillator therapies in patients with congestive heart failure. Eur Heart J. (2011) 32:61–74. 10.1093/eurheartj/ehq327 - DOI - PubMed
    1. Oldenburg O, Wellmann B, Buchholz A, Bitter T, Fox H, Thiem U, et al. . Nocturnal hypoxaemia is associated with increased mortality in stable heart failure patients. Eur Heart J. (2016) 37:1695–703. 10.1093/eurheartj/ehv624 - DOI - PubMed
    1. Hanly PJ, Millar TW, Steljes DG, Baert R, Frais MA, Kryger MH. Respiration and abnormal sleep in patients with congestive heart failure. Chest. (1989) 96:480–8. 10.1378/chest.96.3.480 - DOI - PubMed
    1. Pinna GD, Robbi E, Terzaghi M, Corbellini D, La Rovere MT, Maestri R. Temporal relationship between arousals and Cheyne-Stokes respiration with central sleep apnea in heart failure patients. Clin Neurophysiol. (2018) 129:1955–63. 10.1016/j.clinph.2018.05.029 - DOI - PubMed
    1. Javaheri S, Dempsey JA. Mechanisms of sleep apnea and periodic breathing in systolic heart failure. Sleep Med Clin. (2007) 2:623–30. 10.1016/j.jsmc.2007.07.005 - DOI

LinkOut - more resources