. 2021 Dec 1;25(1):103541.
doi: 10.1016/j.isci.2021.103541. eCollection 2022 Jan 21.

β-catenin links cell seeding density to global gene expression during mouse embryonic stem cell differentiation

Affiliations

β-catenin links cell seeding density to global gene expression during mouse embryonic stem cell differentiation

Lucy LeBlanc et al. iScience. .

Abstract

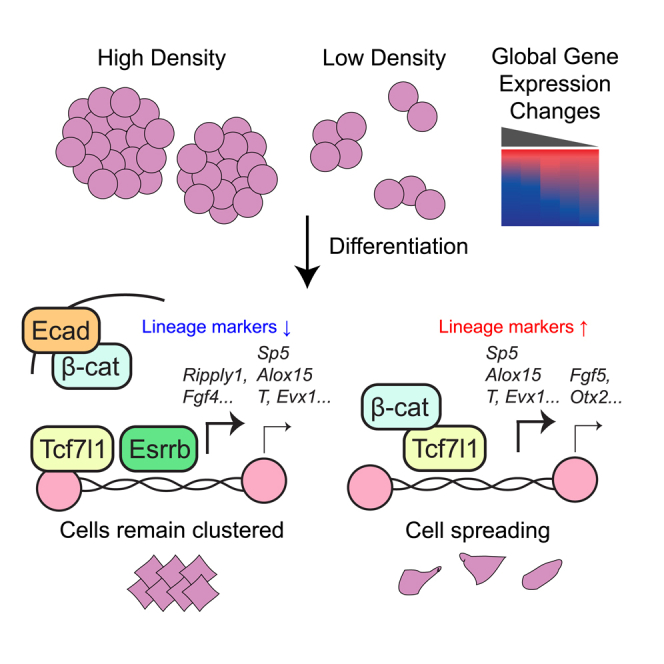
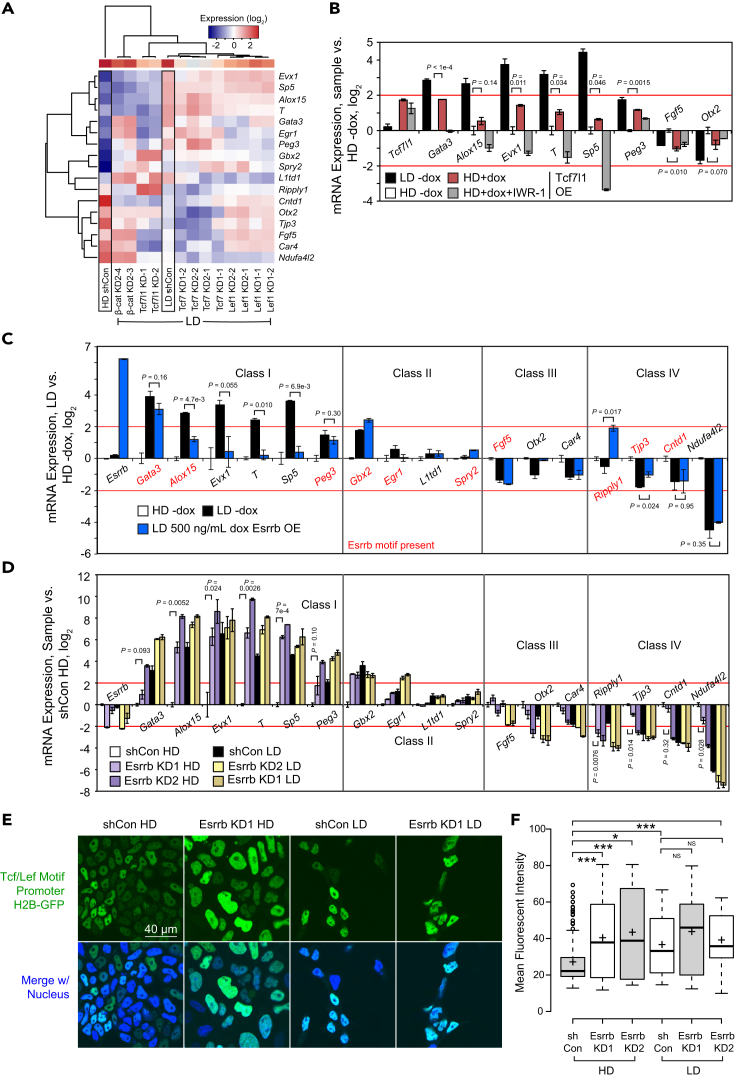
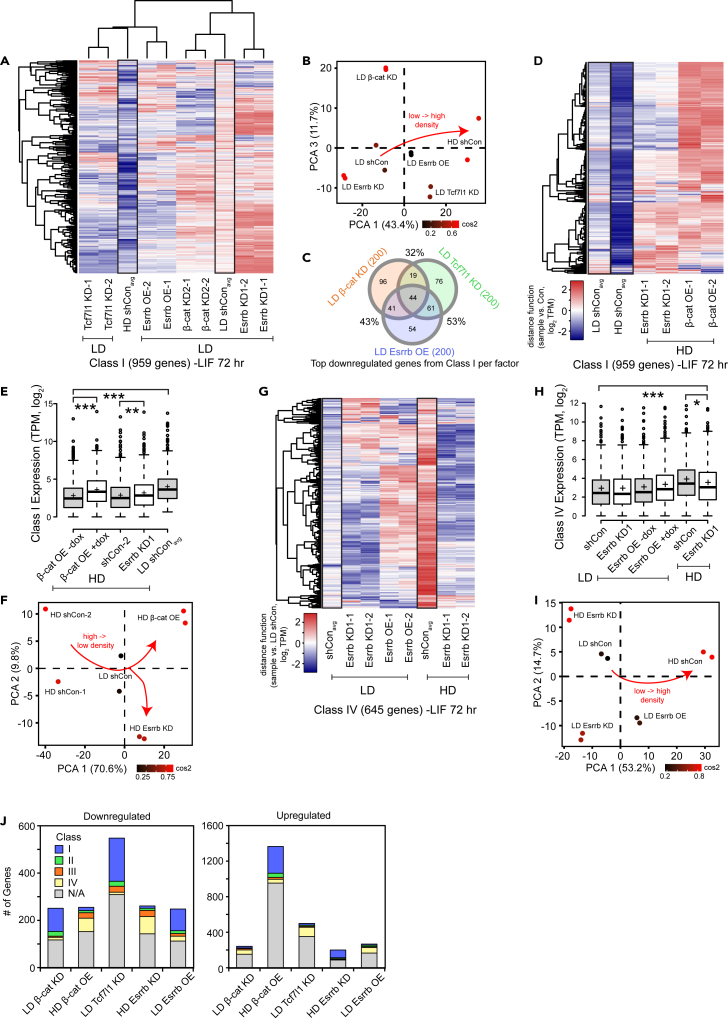
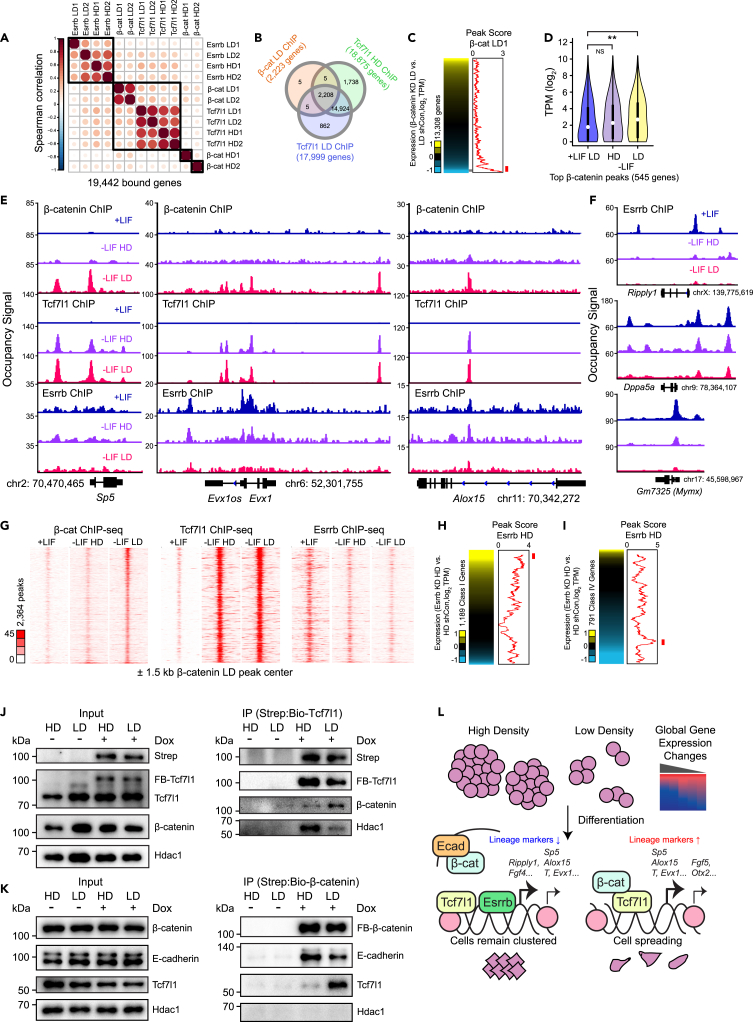
Although cell density is known to affect numerous biological processes including gene expression and cell fate specification, mechanistic understanding of what factors link cell density to global gene regulation is lacking. Here, we reveal that the expression of thousands of genes in mouse embryonic stem cells (mESCs) is affected by cell seeding density and that low cell density enhances the efficiency of differentiation. Mechanistically, β-catenin is localized primarily to adherens junctions during both self-renewal and differentiation at high density. However, when mESCs differentiate at low density, β-catenin translocates to the nucleus and associates with Tcf7l1, inducing co-occupied lineage markers. Meanwhile, Esrrb sustains the expression of pluripotency-associated genes while repressing lineage markers at high density, and its association with DNA decreases at low density. Our results provide new insights into the previously neglected but pervasive phenomenon of density-dependent gene regulation.

Keywords: Cell biology; Stem cells research; Transcriptomics.


Conflict of interest statement

The authors declare no competing interests.

Figures

None
Graphical abstract
Figure 1
Figure 1
Seeding density influences the expression of numerous genes in mouse embryonic stem cells but does not perturb self-renewal (A) Heatmap of RNA-seq performed on J1 mESCs seeded with serial dilutions starting at a concentration of 2.63 × 105 cells/cm2 and ending at a concentration of 4.11 × 103 cells/cm2 and grown in +LIF for 96 h. Transcripts per million (TPM) was calculated using kallisto and transcripts were consolidated into genes. After normalizing expression to the average (log2TPM+1 to avoid undefined results when TPM in any sample = 0, hereafter simply stated as log2), only genes showing a range of 1.5 log2 difference in TPM across samples are shown. Line graphs depict median gene expression ± interquartile range. (B) Volcano plot depicting sleuth differential gene expression analysis of mESC RNA-seq samples corresponding to the three highest vs. three lowest seeding densities in +LIF. The TPM ratio of low density vs. high density (log2) is depicted on the x-axis, whereas -log(q-value) is shown on the y-axis. Red - upregulated, blue - downregulated genes. (C) Scatterplots of select LDA and HDA genes with seeding density on the x-axis and TPM on the y-axis. (D and E) RT-qPCR of (D) LDA genes or (E) HDA genes. mESCs were cultured in +LIF media for 48 h at high density (HD, 1.88 × 105 cells/cm2, black bars) or low density (LD, 2.34 × 104 cells/cm2, gray bars). Data were normalized using the 2–ΔΔCt method relative to Tcp1 expression and HD samples (fold change). Error bars indicate standard deviations (n = 3 biological replicates). (F) Western blot of several proteins whose expression is impacted by seeding density in +LIF. mESCs were cultured in +LIF media for 48 h at HD or LD before whole-cell lysates were harvested in the Laemmli buffer. Antibodies were used specific to the proteins indicated using Gapdh as a loading control. (G) Western blot of core factors in +LIF. mESCs were cultured in +LIF media for 48 h at HD, ½ HD, ¼ HD, or LD. (H) Box plots depicting TPM of genes involved in stem cell maintenance (GO:0019827) in +LIF RNA-seq samples. Expression in the four lowest density samples was normalized to the third highest density sample. p value is derived from single factor ANOVA. (I) Western blot of proteins involved in maintenance of stemness whose expression may be impacted by seeding density 96 h of differentiation in -LIF at HD or LD compared to their expression in +LIF at HD. Text color indicates whether the protein is known to be involved in naive (blue), primed (red), or core/general (black) pluripotency.
Figure 2
Figure 2
Low seeding density enables efficient mESC differentiation (A) Heatmap of RNA-seq performed on J1 mESCs seeded with serial dilutions starting at a concentration of 2.63 × 105 cells/cm2 and ending at a concentration of 4.11 × 103 cells/cm2 and grown in -LIF for 96 h. Transcripts per million (TPM) was calculated using kallisto and transcripts were consolidated into genes. After normalizing expression to the average (log2TPM+1 to avoid undefined results when TPM in any sample = 0, hereafter simply stated as log2), only genes showing a range of 1.5 log2 difference in TPM across samples are shown. Line graphs depict median gene expression ± interquartile range. (B) Boxplots depicting expression of genes involved in naive and primed pluripotency as well as primary gene layer formation. (C) Venn diagram showing overlap of dHDA, dLDA, and differentiation-induced or differentiation-down genes using top 1000 differentially expressed genes (based on TPM compared to control). (D) Scatter plot of 13,797 transcripts depicting log2 TPM ratio of low vs. high density in -LIF (x-axis) and -LIF and +LIF (y-axis) showing a positive correlation between low density and successful induction of the -LIF transcriptional program. Only transcripts where at least one of their q-values (associated with either LD vs. HD or -LIF vs. +LIF) was below 0.05 were included. Color indicates the -log of the higher (worse) q-value. (E) Western blot of proteins whose expression is impacted by seeding density after 72 h of differentiation in -LIF at HD or LD. For Gata3, FL = full length, SV = splice variant. (F) RT-qPCR of lineage markers corresponding to trophectoderm, ectoderm, endoderm, and mesoderm. mESCs were differentiated in LIF HD or LD for 72 h or maintained at LD in +LIF for 48 h. Data were normalized using the 2–ΔΔCt method relative to Tcp1 expression and +LIF LD samples (log2). Error bars indicate standard deviations (n = 3 biological replicates for -LIF, 2 for +LIF). (G and H) RT-qPCR of Class I, II, III, and IV density-sensitive genes after 72 h of differentiation in -LIF, either (G) LD normalized to HD or (H) -LIF relative to +LIF. Data were normalized using the 2–ΔΔCt method relative to Tcp1 expression and HD samples (log2). Error bars indicate standard deviations (n = 4 biological replicates for (G), and 3 for (H)). Significance stars indicate p values from two-tailed t tests of LD vs. HD (G) or -LIF LD vs. +LIF LD (H). ∗ is 0.05 > p value > 0.01. ∗∗ is 0.01 > p value > 0.001. ∗∗∗ is 0.001 ≥ p value.
Figure 3
Figure 3
β-catenin regulates Class I and III genes during mESC differentiation downstream of seeding density (A) Representative confocal images (63× oil objective) of Tcf/Lef reporter mESCs cultured in either self-renewing (left, middle left) or differentiating (middle right, right) conditions at the densities indicated. Green indicates H2B-GFP. Nuclei were counterstained with NucBlue (Hoechst 33,342). Scale bar: 40 μm. (B) Quantification of fluorescent intensity of H2B-GFP in (A). Individual nuclei were traced and quantified in ImageJ. For +LIF at HD, n = 84 nuclei; for -LIF, n = 121 nuclei for HD and 77 for LD. Significance stars indicate p values from the Kruskal-Wallis test for difference among all samples as well as the t test with Bonferroni-corrected p values between samples. ∗ is 0.05 > p value > 0.01. ∗∗ is 0.01 > p value > 0.001. ∗∗∗ is 0.001 ≥ p value. (C) Representative confocal images (63× oil objective) of immunocytochemistry of mESCs grown in +LIF at HD or -LIF at HD or LD. Green represents β-catenin, blue represents the nucleus. White box represents the zoom in area. Scale bar: 40 μm. (D) Boxplots showing weighted colocalization coefficients between nuclei and β-catenin in mESCs for several fields of view quantified using ZEISS ZEN. n = 5 for +LIF, 11 for -LIF LD, and 12 for -LIF LD. Significance stars indicate p values from the Kruskal-Wallis test for difference among all samples as well as the t test with Bonferroni-corrected p values between samples. ∗ is 0.05 > p value > 0.01. ∗∗ is 0.01 > p value > 0.001. ∗∗∗ is 0.001 ≥ p value. (E) RT-qPCR of Classes I-IV density-sensitive genes after 72 h differentiation in -LIF at high or low density upon KD of β-catenin (Ctnnb1) or control KD. All samples were normalized using the 2–ΔΔCt method relative to Tcp1 expression and HD shCon (log2). Error bars indicate standard deviations (n = 2 biological replicates). Red text indicates presence of the Tcf7l1 motif ±10 kb of the TSS, determined using TFmotifView (http://bardet.u-strasbg.fr/tfmotifview/). Significance stars indicate p values from two-tailed t test of KD vs. shCon. ∗ is 0.05 > p value > 0.01. ∗∗ is 0.01 > p value > 0.001. ∗∗∗ is 0.001 ≥ p value. (F) RT-qPCR of Class I-IV density-sensitive genes after 72 h differentiation in -LIF at high or low density upon 48 h dox-induced OE at 125 or 500 ng/mL of 4A β-catenin or no induction. All samples were normalized to no induction at HD (log2). Error bars indicate standard deviations (n = 2 biological replicates). Red text indicates presence of the Tcf7l1 motif ±10 kb of the TSS, determined using TFmotifView (http://bardet.u-strasbg.fr/tfmotifview/).
Figure 4
Figure 4
Tcf7l1 and Esrrb regulate density-sensitive genes during differentiation (A) Heatmap of RT-qPCR of Class I-IV density-sensitive genes after 72 h differentiation in -LIF at high or low density upon KD of β-catenin, Tcf3 (Tcf7l1), Tcf7, or Lef1. All samples were normalized using the 2–ΔΔCt method relative to Tcp1 expression and HD shCon (log2). LD shCon is an average of n = 3 biological replicates. (B) RT-qPCR of Class I and III density-sensitive genes after 72 h differentiation in -LIF at high density, low density, or high density upon dox-induced OE of Tcf7l1 (250 ng/mL dox) with or without 48 h treatment with 2.5 μM IWR-1, a β-catenin inhibitor. All samples were normalized to no induction at HD (log2). Error bars indicate standard deviations (n = 2 biological replicates). (C) RT-qPCR of Classes I-IV density-sensitive genes after 72 h differentiation in -LIF at high or low density upon dox-induced OE of Esrrb (500 ng/mL dox for 48 h). All samples were normalized to no induction at HD (log2). Error bars indicate standard deviations (n = 2 biological replicates). Red text indicates presence of the Esrrb motif ±10 kb of the TSS, determined using TFmotifView (http://bardet.u-strasbg.fr/tfmotifview/). (D) RT-qPCR of Classes I-IV density-sensitive genes after 72 h differentiation in -LIF at high or low density upon KD of Esrrb or control KD. All samples were normalized to HD shCon (log2). Error bars indicate standard deviations (n = 2 biological replicates). (E) Representative confocal images (63× oil objective) of Tcf/Lef reporter mESCs after differentiation (-LIF, 72 h) upon either KD of Esrrb or control KD. Green indicates H2B-GFP. Nuclei were counterstained with NucBlue (Hoechst 33,342). Scale bar: 40 μm. (F) Quantification of fluorescent intensity of H2B-GFP in (E). For HD: shCon, n = 179 nuclei; KD1, n = 108 nuclei; KD2, n = 118 nuclei. For LD: shCon, n = 58 nuclei; KD1, n = 41 nuclei; KD2, n = 26 nuclei. Significance stars indicate p values from the ANOVA test for difference among all samples as well as the t test with Bonferroni-corrected p values between samples. ∗ is 0.05 > p value > 0.01. ∗∗ is 0.01 > p value > 0.001. ∗∗∗ is 0.001 ≥ p value.
Figure 5
Figure 5
Transcriptomic analysis of the roles of β-catenin, Esrrb, and Tcf7l1 in regulating Class I and IV genes (A) Heatmap of Class I gene expression after RNA-seq was performed on mESCs differentiating in -LIF for 72 h at LD upon indicated perturbation of β-catenin, Tcf7l1, or Esrrb. shRNA controls, both LD (left) and HD (right), are depicted outlined in black boxes. Each sample was normalized to its respective LD control (for example, Esrrb OE is +dox vs. -dox, both at LD). (B) Principal component analysis (PCA) of RNA-seq samples shown in (A). (C) Venn diagram showing overlap of the top 200 downregulated (by fold change, compared to shCon) Class I genes upon KD of the indicated factors. (D) Heatmap of Class I gene expression after RNA-seq was performed on mESCs differentiating in -LIF for 72 h at LD upon indicated perturbation of β-catenin or Esrrb. shRNA controls, both LD (left) and HD (right), are outlined in black boxes. Each sample was normalized to its respective LD control. (E) Boxplot of Class I gene expression (log2 TPM, n = 951 genes) upon perturbation of β-catenin or Esrrb at HD. Significance stars indicate p values from the one-way ANOVA test for difference among all samples as well as the t test with Bonferroni-corrected p values between samples. ∗ is 0.05 > p value > 0.01. ∗∗ is 0.01 > p value > 0.001. ∗∗∗ is 0.001 ≥ p value. (F) PCA of RNA-seq samples shown in (D) using the same gene set. (G) Heatmap of Class IV gene expression after RNA-seq was performed on mESCs in -LIF for 72 h at LD upon indicated perturbation of Esrrb. shRNA controls, both LD (left) and HD (right), are depicted outlined in black boxes. Each sample was normalized to its respective LD control (for example, Esrrb is +dox vs. -dox, either at LD or HD). shRNA controls, both LD (left) and HD (right), are depicted outlined in black boxes. Each sample was normalized to its respective LD control (for example, Esrrb is +dox vs. -dox, either at LD or HD). (H) Boxplot of Class IV gene expression (log2 TPM, n = 642 genes) upon perturbation of Esrrb at LD or HD. Significance stars indicate p values from the one-way ANOVA test for difference among all samples as well as the t test with Bonferroni-corrected p values between samples. ∗ is 0.05 > p value > 0.01. ∗∗ is 0.01 > p value > 0.001. ∗∗∗ is 0.001 ≥ p value. (I) PCA of RNA-seq samples shown in (G) using the same gene set. (J) Stacked bar charts depicting the number of downregulated (left) and upregulated (right) genes upon each perturbation. Threshold was set at 1 log2 difference compared to control. Proportion of dysregulated genes belonging to Class I, II, III, IV, or none of the above is indicated by color.
Figure 6
Figure 6
Genomic occupancy of β-catenin, Esrrb, and Tcf7l1 during differentiation at low and high density (A) Correlogram of mESC ChIP-seq data after 72 h differentiation at LD. Genes that were not bound by any factor were filtered out, and the peak score calculated by Homer after peaks were called with MACS2 was used as input (q-value cutoff of peaks = 0.05). Color of the circles is relative to both sign and magnitude of Spearman correlation (blue for negative correlation, dark red for positive) whereas size is proportional to the absolute value of the coefficients. (B) Venn diagram showing overlap of genes bound by β-catenin at LD, Tcf7l1 at HD, or Tcf7l1 at LD, all in -LIF. (C) Integration of RNA-seq data (heatmap, left) and ChIP-seq data (line graph, right) comparing changes in expression upon β-catenin KD to peak score of β-catenin, both at LD. For the heatmap, yellow indicates upregulation upon KD whereas blue indicates downregulation. For the line graph, the line represents a moving window average of 150 genes. (D) Violin plots showing TPM of top β-catenin-occupied genes in +LIF (blue), -LIF at HD (purple), and -LIF at LD (yellow) using RNA-seq data. Top 750 genes were first taken as input, and then any genes that were not expressed in any sample were removed, leaving 545 genes. (E and F) Signal tracks of Class I (E) and Class IV (F) genes comparing occupancy of β-catenin, Tcf7l1, and Esrrb (or exclusively Esrrb for Class IV) during self-renewal (blue), HD -LIF (purple), and LD -LIF (pink). (G) Peak-centric heatmaps showing tag density in β-catenin, Tcf7l1, and Esrrb ChIP-seq at HD and LD ± 1.5 kb of β-catenin LD peak centers. Scale bar indicates signal pileup after MACS2 peak calling. (H) Integration of RNA-seq data (heatmap, left) and ChIP-seq data (line graph, right) comparing changes in expression of Class I genes upon Esrrb KD to peak score of β-catenin, both at HD. Line represents a moving window average of 50 genes. (I) Integration of RNA-seq data (heatmap, left) and ChIP-seq data (line graph, right) comparing changes in expression of Class IV genes upon Esrrb KD to peak score of β-catenin, both at HD. Line represents a moving window average of 35 genes. (J) Western blot after co-IP of biotinylated Tcf7l1 after differentiation (72 h) and dox treatment (48 h) at HD or LD. Input (0.2% of total protein extract) and dox untreated cells are provided as controls. FB = FLAG-Biotinylated. (K) Western blot after co-IP of biotinylated β-catenin after differentiation (72 h) and dox treatment (48 h) at HD or LD. Input (0.2% of total protein extract) and dox untreated cells are provided as controls. FB = FLAG-Biotinylated. (L) Model showing factors implicated density-sensitive gene regulation during mESC differentiation.

Similar articles

Cited by

References

    1. Adhikari S., Moran J., Weddle C., Hinczewski M. Unraveling the mechanism of the cadherin-catenin-actin catch bond. PLoS Comput. Biol. 2018;14:e1006399. - PMC - PubMed
    1. Bao Q., Morshedi A., Wang F., Bhargy S., Pervushin K., Yu W.-P., Dröge P. Utf1 contributes to intergenerational epigenetic inheritance of pluripotency. Sci. Rep. 2017;7:14612. - PMC - PubMed
    1. Beck S., Lee B.-K., Kim J. Multi-layered global gene regulation in mouse embryonic stem cells. Cell Mol. Life Sci. 2015;72:199–216. - PMC - PubMed
    1. Bray N.L., Pimentel H., Melsted P., Pachter L. Near-optimal probabilistic RNA-seq quantification. Nat. Biotechnol. 2016;34:525–527. - PubMed
    1. Cao Z., Carey T.S., Ganguly A., Wilson C.A., Paul S., Knott J.G. Transcription factor AP-2γ induces early Cdx2 expression and represses HIPPO signaling to specify the trophectoderm lineage. Development (Cambridge, England) 2015;142:1606–1615. - PMC - PubMed