. 2021 Jul 7:3:100089.
doi: 10.1016/j.ijpx.2021.100089. eCollection 2021 Dec.

Oral etoposide and zosuquidar bioavailability in rats: Effect of co-administration and in vitro- in vivo correlation of P-glycoprotein inhibition

Affiliations

Oral etoposide and zosuquidar bioavailability in rats: Effect of co-administration and in vitro- in vivo correlation of P-glycoprotein inhibition

Rasmus Blaaholm Nielsen et al. Int J Pharm X. .

Abstract

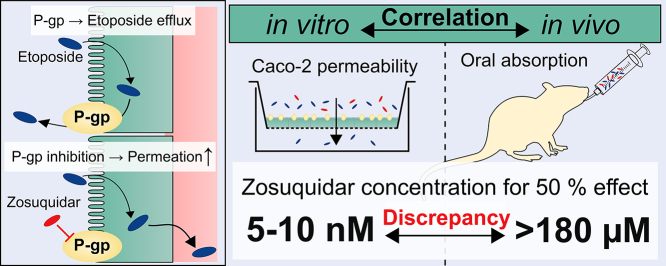
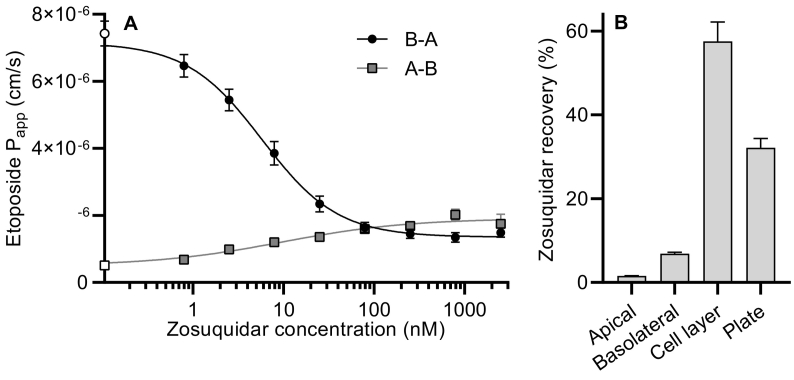
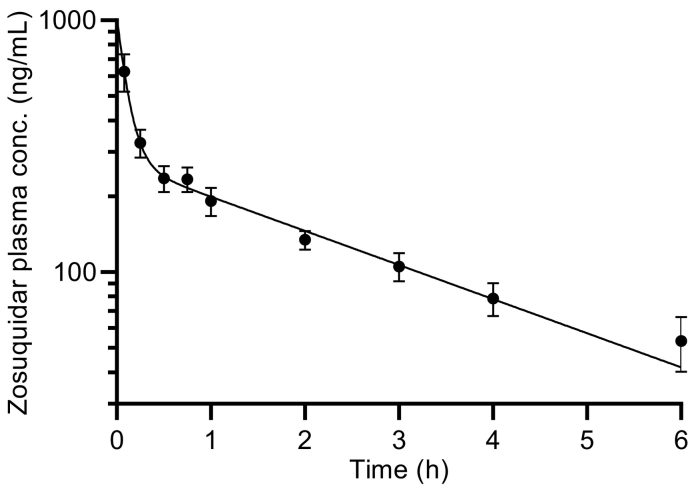
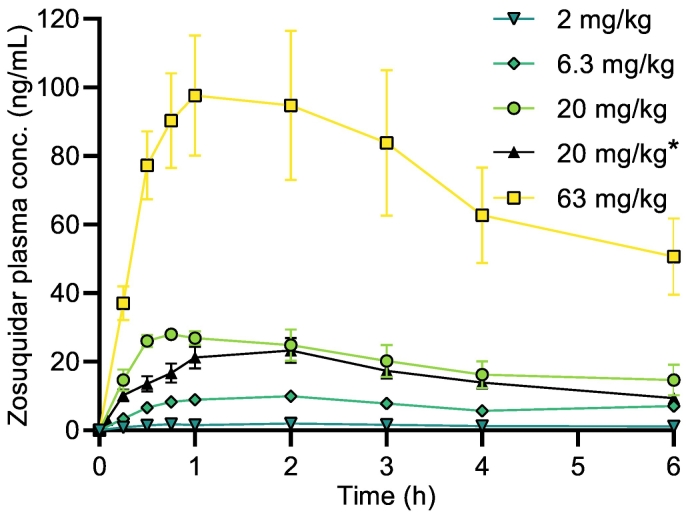
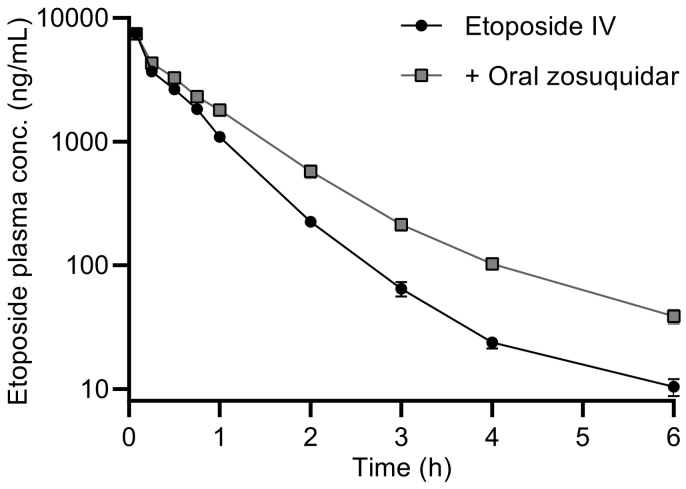
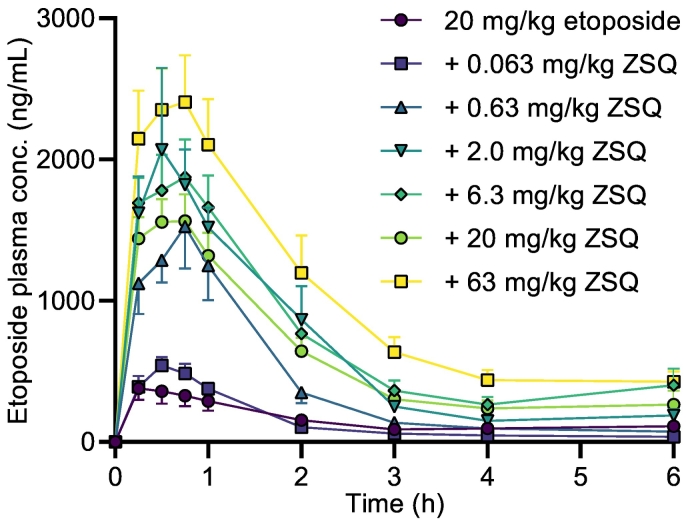
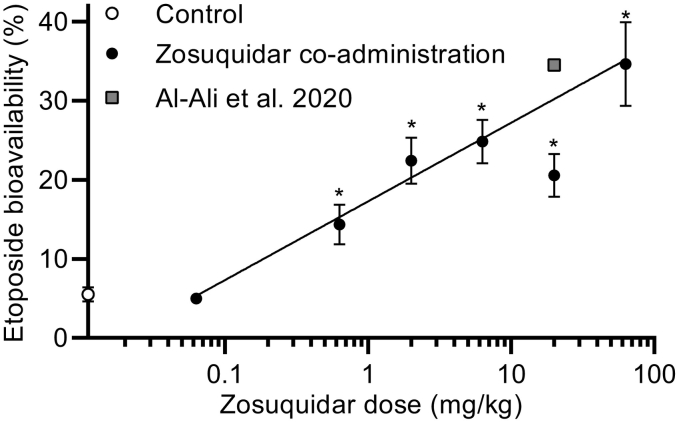
P-glycoprotein inhibitors, like zosuquidar, have widely been used to study the role of P-glycoprotein in oral absorption. Still, systematic studies on the inhibitor dose-response relationship on intestinal drug permeation are lacking. In the present study, we investigated the effect of 0.79 nM-2.5 μM zosuquidar on etoposide permeability across Caco-2 cell monolayers. We also investigated etoposide pharmacokinetics after oral or IV administration to Sprague Dawley rats with co-administration of 0.063-63 mg/kg zosuquidar, as well as the pharmacokinetics of zosuquidar itself. Oral zosuquidar bioavailability was 2.6-4.2%, while oral etoposide bioavailability was 5.5 ± 0.9%, which increased with increasing zosuquidar doses to 35 ± 5%. The intestinal zosuquidar concentration required to induce a half-maximal increase in bioavailability was estimated to 180 μM. In contrast, the IC50 of zosuquidar on etoposide permeability in vitro was only 5-10 nM, and a substantial in vitro-in vivo discrepancy of at least four orders of magnitude was thereby identified. Overall, the present study provides valuable insights for future formulation development that applies fixed dose combinations of P-glycoprotein inhibitors to increase the absorption of poorly permeable P-glycoprotein substrate drugs.

Keywords: Caco-2; Efflux transport; Etoposide; Oral absorption; P-glycoprotein; Zosuquidar; in vitro-in vivo correlation.


Conflict of interest statement

The authors declare that they have no known competing financial og personal interests.

Figures

Unlabelled Image
Graphical abstract
Fig. 1
Fig. 1
A) Apparent permeability of 50 μM etoposide across Caco-2 cells in the apical-to-basolateral (A-B) and the basolateral-to-apical (B-A) direction at a zosuquidar concentration of 0.79 nM-2.5 μM. The permeability of etoposide without zosuquidar (control) is plotted on the y-axis for comparison (open symbols). The lines depict non-linear dose response regression (Eq. 1). Shown as mean ± SEM, n = 4 for B-A and 3 for A-B, SEMs smaller than the symbol size are not shown. B) Recovery of zosuquidar in solution in the apical or basolateral compartment, in the cell monolayer, or in the cell culture plate at 120 min. Expressed as % of added zosuquidar, corrected for sampling and replacement during the experiment. Pooled data shown for A-B and B-A studies with an apparent zosuquidar concentration of 79, 250, 790 nM or 2.5 μM over three independent cell passages. Expressed as mean ± SEM, n = 3 cell passages × 4 concentrations × 2 (A-B + B-A) = 24.
Fig. 2
Fig. 2
Etoposide solubility in ethanol-water mixtures at ~22 °C. Shown as mean ± SD (n = 3), SDs smaller than the symbol size are not shown.
Fig. 3
Fig. 3
Pharmacokinetic profile of zosuquidar after administration of 5 mg/kg zosuquidar IV bolus. Logarithmic y-axis. Shown as mean ± SEM, n = 3. The line represents a two-compartment model fit (Eq. 2).
Fig. 4
Fig. 4
Pharmacokinetic profiles of zosuquidar in male Sprague-Dawley rats after zosuquidar was co-administered alongside oral (20 mg/kg) or IV* (5 mg/kg) etoposide. Zosuquidar doses of 2.0, 6.3, 20, or 63 mg/kg. Shown as mean ± SEM, n = 6, SEMs smaller than the symbol size are not shown, straight connecting lines for illustrative purposes.
Fig. 5
Fig. 5
Pharmacokinetic profile of etoposide after administration of 5 mg/kg etoposide IV and after co-administration of 5 mg/kg etoposide IV and 20 mg/kg zosuquidar orally. Logarithmic y-axis. Shown as mean ± SEM (n = 6), SEMs smaller than the symbol size are not shown, straight connecting lines for illustrative purposes.
Fig. 6
Fig. 6
Pharmacokinetic profiles of etoposide in male Sprague-Dawley rats after oral administration of 20 mg/kg etoposide and oral co-administration of 0.063, 0.63, 2.0, 6.3, 20, or 63 mg/kg zosuquidar (ZSQ). Shown as mean + or - SEM, n = 6, SEMs smaller than the symbol size are not shown, straight connecting lines for illustrative purposes.
Fig. 7
Fig. 7
Absolute etoposide bioavailability in male Sprague-Dawley rats after oral administration of 20 mg/kg etoposide as a function of the dose of orally co-administered zosuquidar. The control group dosed with 20 mg/kg etoposide without zosuquidar is plotted on the y-axis for comparison. Significantly different from 20 mg/kg etoposide (*, p < 0.05) according to one-way ANOVA followed by a Dunnett's test. The line represents log-linear regression (Eq. 5), where 20 mg/kg zosuquidar was not included (R2 = 0.656). Etoposide bioavailability after oral co-administration of 20 mg/kg etoposide and 20 mg/kg zosuquidar from Al-Ali et al., 2020 reprinted for comparison. Shown as mean ± SEM, n = 6, SEMs smaller than the symbol size are not shown.

Similar articles

Cited by

References

    1. Adane E.D., Liu Z., Xiang T.-X., Anderson B.D., Leggas M. Pharmacokinetic modeling to assess factors affecting the oral bioavailability of the lactone and carboxylate forms of the lipophilic camptothecin analogue AR-67 in rats. Pharm. Res. 2012;29:1722–1736. doi: 10.1007/s11095-011-0617-0. - DOI - PubMed
    1. Al-Ali A.A.A., Quach J.R.C., Bundgaard C., Steffansen B., Holm R., Nielsen C.U. Polysorbate 20 alters the oral bioavailability of etoposide in wild type and mdr1a deficient Sprague-Dawley rats. Int. J. Pharm. 2018;543:352–360. doi: 10.1016/j.ijpharm.2018.04.006. - DOI - PubMed
    1. Al-Ali A.A.A., Steffansen B., Holm R., Nielsen C.U. Nonionic surfactants increase digoxin absorption in Caco-2 and MDCKII MDR1 cells: impact on P-glycoprotein inhibition, barrier function, and repeated cellular exposure. Int. J. Pharm. 2018;551:270–280. doi: 10.1016/j.ijpharm.2018.09.039. - DOI - PubMed
    1. Al-Ali A.A.A., Sandra L., Versweyveld D., Pijpers I., Dillen L., Vermeulen A., Snoeys J., Holm R., Nielsen C.U. High-dose etoposide formulations do not saturate intestinal P-glycoprotein: development, stability, and pharmacokinetics in Sprague-Dawley rats. Int. J. Pharm. 2020;583:119399. doi: 10.1016/j.ijpharm.2020.119399. - DOI - PubMed
    1. Alam A., Kung R., Kowal J., McLeod R.A., Tremp N., Broude E.V., Roninson I.B., Stahlberg H., Locher K.P. Structure of a zosuquidar and UIC2-bound human-mouse chimeric ABCB1. Proc. Natl. Acad. Sci. U. S. A. 2018;115:E1973–E1982. doi: 10.1073/pnas.1717044115. - DOI - PMC - PubMed

LinkOut - more resources