. 2021 Dec 15;3(1):101034.
doi: 10.1016/j.xpro.2021.101034. eCollection 2022 Mar 18.

MATISSE: An analysis protocol for combining imaging mass cytometry with fluorescence microscopy to generate single-cell data

Affiliations

MATISSE: An analysis protocol for combining imaging mass cytometry with fluorescence microscopy to generate single-cell data

Daniëlle Krijgsman et al. STAR Protoc. .

Abstract

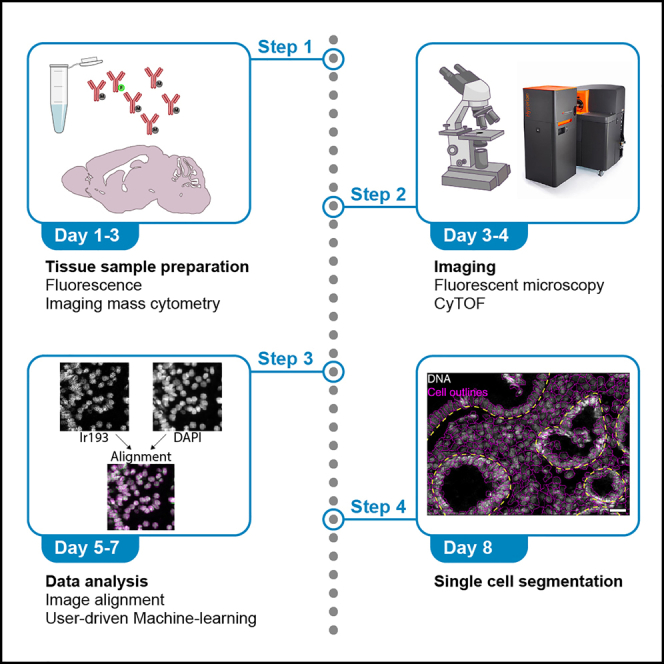
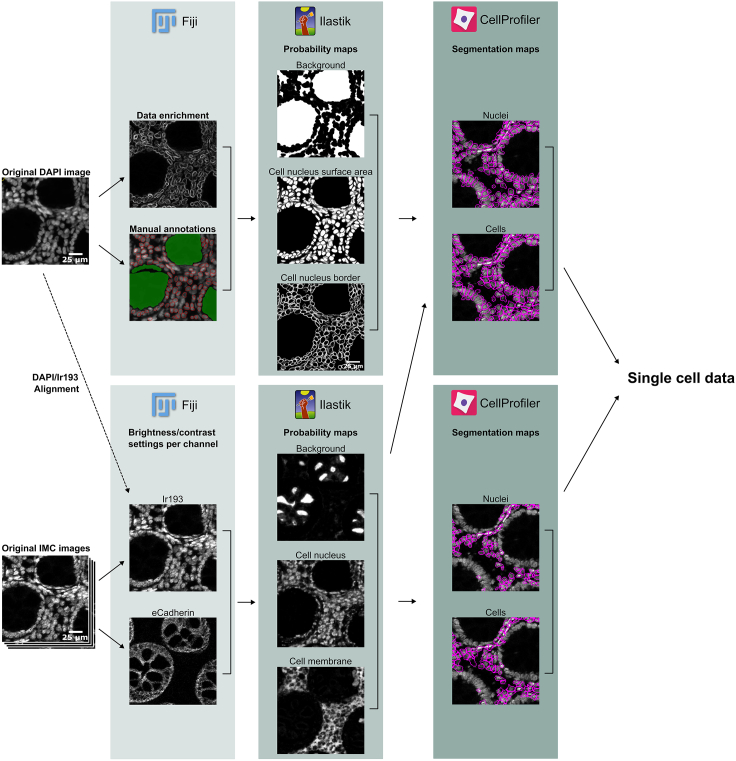
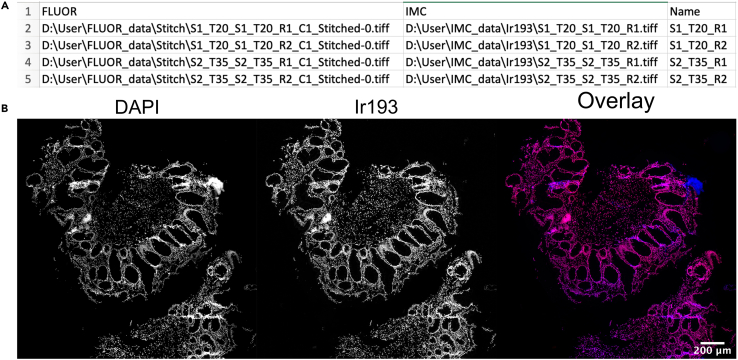
Exploring tissue heterogeneity on a single-cell level by imaging mass cytometry (IMC) remains challenging because of its limiting resolution. We previously demonstrated that combining higher resolution fluorescence with IMC data in the analysis pipeline resulted in high-quality single-cell segmentation. Here, we provide a step-by-step workflow of this MATISSE pipeline, including instructions regarding the staining procedure, and the analysis route to generate single-cell data. For complete details on the use and execution of this protocol, please refer to Baars et al., 2021.

Keywords: Antibody; Bioinformatics; Biotechnology and bioengineering; Cell Biology; Flow Cytometry/Mass Cytometry; Microscopy; Single Cell.


Conflict of interest statement

Y.V. receives funding through a Public-private partnership grant (TKI-Health Holland) with TigaTx B.V.

Figures

None
Graphical abstract
Figure 1
Figure 1
MATISSE workflow
Figure 2
Figure 2
Schematic overview of DAPI and IMC tissue region selection Blue: tissue selection for DAPI tile-region scanning. Red: tissue selection for IMC ablation. Please note that the tissue region selection for DAPI scanning is always bigger than the IMC region selection. We propose the following naming pattern for DAPI and IMC images: [Slide ID]_[Patient/Tumor ID]_[Tile Region].
Figure 3
Figure 3
Antibody incubation (A) Correct and incorrect example of surrounded tissue by PAP. The incorrect example shows spillover of fluid between different tissue samples on the same glass slide. Additionally, leakage of fluid can also happen when tissues are correctly surrounded by PAP. This can be prevented by decreasing the buffer volume. (B) Humidified staining tray containing tissue sections incubating with blocking buffer.
Figure 4
Figure 4
Tile-region scanning settings Zeiss Z1 imager
Figure 5
Figure 5
Generating tile-region scan Tile settings used on the Zeiss Z1 imager for scanning tile-regions. (1) Starting position of the cursor after X/Y position calibration. (2) Selection of a region on the glass slide for preview scanning. (3) Selection of a region of interest for 20× scanning on the preview scan.
Figure 6
Figure 6
Setting focus points (A and B) Settings used on the Zeiss Z1 imager for (A) adding focus points to tile scans, and (B) setting Z-stacks. (C) Representative image of a selected region of interest for 20× scanning projected on the preview scan. The yellow circles indicate the set focus points. (D) Pop-up window for verification of tile regions/positions.
Figure 7
Figure 7
Export settings Zeiss Z1 imager
Figure 9
Figure 9
DAPI and Ir193 image registration (A) Example of the table (.csv file) for image matching and subsequent registration. (B) Overlay (right) of DAPI (left image) and Ir193 (center image) images after registration. Blue: DAPI; Red: Ir193. Scale bar indicates 200 μm.
Figure 8
Figure 8
Brightness and contrast settings for IMC images Examples are shown of correct and incorrect brightness and contrast settings of Ir193 IMC images. The original Ir193 images are shown, as well as images with HiLo display settings (blue: low-end saturated pixels; red: high-end saturated pixels). The brightness/contrast window indicates the used threshold for each image. Scale bar indicates 200 μm.
Figure 10
Figure 10
Generation of training and validation subsets Training and validation subsets are generated from the original fluorescent and IMC data. (A) Two random crops consisting of 10% of the total tissue area are suggested within the original DAPI image. Scale bar indicates 50 μm. (B) IMC image stacks are cropped with identical coordinates as defined in the DAPI images in (A). Scale bars indicate 25 μm.
Figure 11
Figure 11
Manual annotations Nuclei (red) and background (green) are manually annotated in the training images. Scale bar indicates 20 μm.
Figure 12
Figure 12
IMC annotations and probability maps IMC images are used for machine learning to create membrane and nucleus probability maps. (A) different channels are used for annotating membranes (red) and nuclei (blue). Scale bars indicate 10 μm (top rows), 25 μm (bottom row). (B) Exported probability maps of the example shown in (A). Scale bar indicates 25 μm.
Figure 13
Figure 13
Screenshots CellProfiler interface The CellProfiler pipeline panel is divided into three sections: the "Modules Image Input" in which to specify information about the images to be processed, the "Modules Analysis" which are executed sequentially to process the images, collect the measurements, and write the output. The "Module Settings Panel" provides the customizable settings for each selected module in the Pipeline panel.
Figure 14
Figure 14
Identification of primary and secondary objects (A and B) (A) Identification of primary object and (B) Identification of secondary objects of a particular tissue region in CellProfiler. Image axes are pixels. Image resolution is 0.65 μm/pixel.
Figure 15
Figure 15
Single-cell segmentation map Display of regions of interest (ROI) showing an overlay of DAPI (white), and the predicted cell outlines for nuclear segmentation (magenta). Scale bar indicates 200 μm (left) and 25 μm (right).
Figure 16
Figure 16
Extraction of single-cell data Matrix showing single-cell data generation in RStudio (right) from the CellProfiler segmentation map (left). Scale bar indicates 200 μm.
Figure 17
Figure 17
Troubleshooting 2, incorrect image alignment Example of incorrect and correct image alignment of DAPI (blue) and Ir193 (red) images. Overlay of these colors is shown in magenta. Scale bar indicates 100 μm (top) or 25 μm (lower panels).
Figure 18
Figure 18
Troubleshooting 3, incorrect DAPI probability maps Yellow arrows show examples of incorrect nucleus identification in DAPI probability maps. In the original DAPI image it is clear that no nuclei are present in these locations. Red arrows show examples of merged nuclear surface prediction and absence of edge detection in the DAPI probability maps. Scale bar indicates 25 μm.

References

    1. Baars M.J.D., Sinha N., Amini M., Pieterman-Bos A., van Dam S., Ganpat M.M.P., Laclé M.M., Oldenburg B., Vercoulen Y. MATISSE: a method for improved single cell segmentation in imaging mass cytometry. BMC Biol. 2021;19:99. doi: 10.1186/s12915-021-01043-y. - DOI - PMC - PubMed
    1. Brown M., Szeliski R., Winder S. IEEE; 2005. Multi-image matching using multi-scale oriented Patches; pp. 510–517. (2005 IEEE Computer Society Conference on Computer Vision and Pattern Recognition (CVPR’05)). - DOI
    1. Carpenter A.E., Jones T.R., Lamprecht M.R., Clarke C., Kang I.H., Friman O., Guertin D.A., Chang J.H., Lindquist R.A., Moffat J., et al. CellProfiler: image analysis software for identifying and quantifying cell phenotypes. Genome Biol. 2006;7:R100. doi: 10.1186/gb-2006-7-10-r100. - DOI - PMC - PubMed
    1. Chalfoun J., Majurski M., Blattner T., Bhadrijaju K., Keyrouz W., Bajcsy P., Brady M. MIST: accurate and scalable microscopy image stitching tool with stage modeling and error minimization. Sci. Rep. 2017;7:4988. doi: 10.1038/s41598-017-04567-y. - DOI - PMC - PubMed
    1. Forster B., van de Ville D., Berent J., Sage D., Unser M. Complex wavelets for extended depth-of-field: a new method for the fusion of multichannel microscopy images. Microsc. Res. Tech. 2004;65:33–42. doi: 10.1002/jemt.20092. - DOI - PubMed

Publication types

LinkOut - more resources