. 2021 Nov 11;1(12):2261-2270.
doi: 10.1021/jacsau.1c00393. eCollection 2021 Dec 27.

Identification of Lipid Heterogeneity and Diversity in the Developing Human Brain

Affiliations

Identification of Lipid Heterogeneity and Diversity in the Developing Human Brain

Aparna Bhaduri et al. JACS Au. .

Abstract

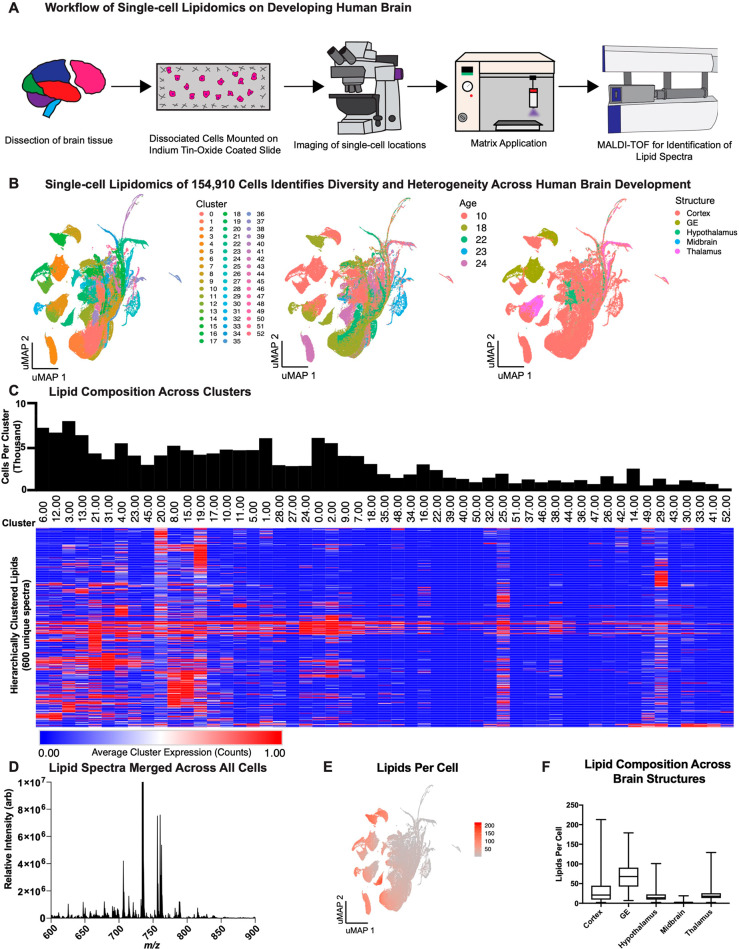
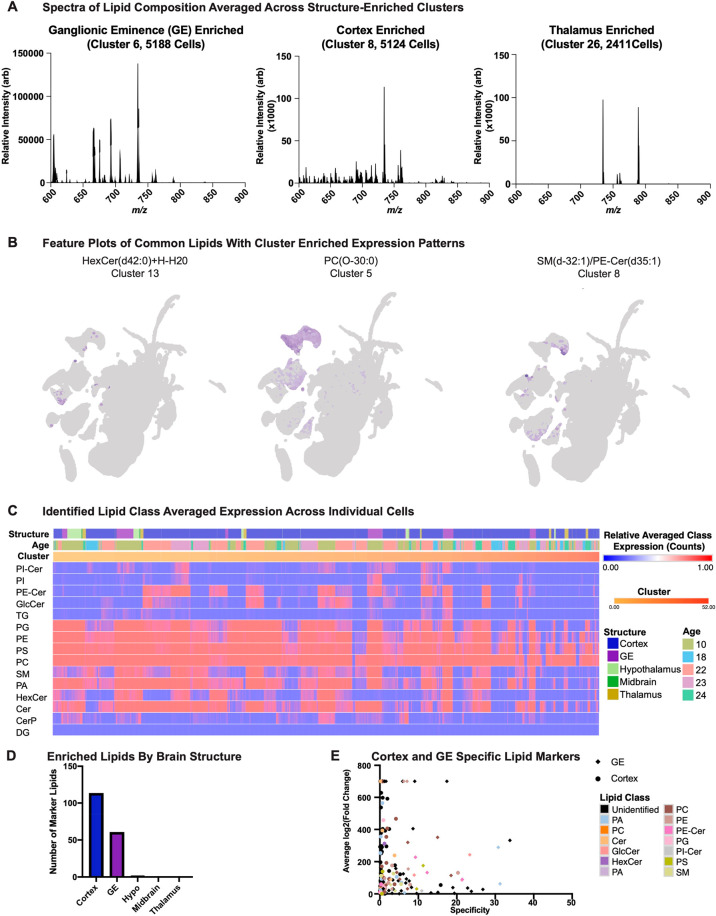
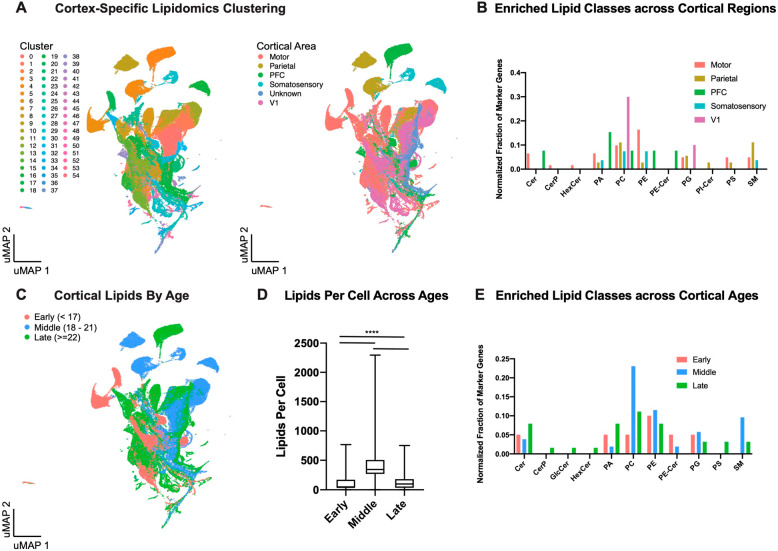
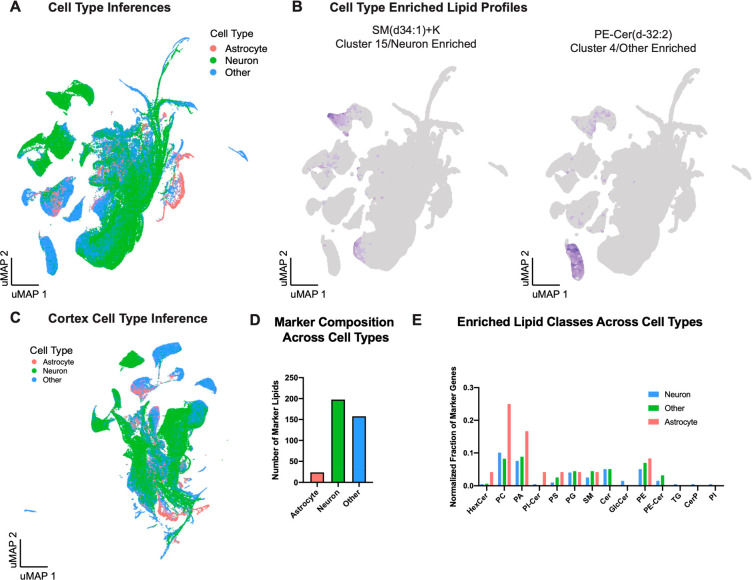
The lipidome is currently understudied but fundamental to life. Within the brain, little is known about cell-type lipid heterogeneity, and even less is known about cell-to-cell lipid diversity because it is difficult to study the lipids within individual cells. Here, we used single-cell mass spectrometry-based protocols to profile the lipidomes of 154 910 single cells across ten individuals consisting of five developmental ages and five brain regions, resulting in a unique lipid atlas available via a web browser of the developing human brain. From these data, we identify differentially expressed lipids across brain structures, cortical areas, and developmental ages. We inferred lipid profiles of several major cell types from this data set and additionally detected putative cell-type specific lipids. This data set will enable further interrogation of the developing human brain lipidome.


Conflict of interest statement

The authors declare no competing financial interest.

Figures

Figure 1
Figure 1
Single-cell mass spectrometry identifies lipid diversity in the developing human brain. (A) Single-cell lipidomics was performed on the cortex, ganglionic eminences (GE), hypothalamus, midbrain, and thalamus of the developing human brain between gestational weeks (GW) 10–23. In brief, brain regions were dissected and dissociated into single cells. These slides were then processed using MALDI-TOF to identify lipid spectra for 154 910 cells. (B) Fifty-three unique lipidomic clusters (left) visualized by uniform manifold approximation and projection (UMAP) were identified via Louvain clustering. Some of these clusters were enriched by specific ages in gestational weeks that were sampled (middle) or brain structures (right), while other clusters were intermixed across stages or regions. (C) Hierarchical clustering shows the average abundance of each detected lipid within a cluster. On average, there were 2923 cells per cluster ranging from 184 to 9153. (D) Summed mass spectra from all cells, demonstrating how bulk analysis is insufficient for assaying lipid diversity. (E) The UMAP recolored by number of cells. (F) The distribution of lipids per cell for each sampled brain structure.
Figure 2
Figure 2
Lipid heterogeneity in the developing human brain. (A) Averaged lipid spectra from 3 clusters, where clusters 6, 8, and 26, are GE, cortex, and thalamus enriched, respectively, highlight that there many different lipids detected in the brain and there are unique lipid combinations across brain structures. (B) Three commonly detected lipids with cluster level enrichments as feature plots in the UMAP space, with more purple signal indicating greater detection of that lipid in a cell. (C) The hierarchically clustered (using rows) heat map shows each cell in the data set in the columns with summed signal across each lipid class, with a high abundance of PC and PE coverage, as expected. (PI-Cer: phosphoinositol ceramide; PI: phosphoinositol; PE-Cer: phosphoethanolamine ceramide; GlcCer: glucosylceramide; TG: triglyceride; PG: phosphoglyceride; PE: phosphoethanolamine; PS: phosphotidylserine; PC: phosphatidylcholine; SM: sphingomyelin; PA: phosphatidic acid; HexCer: hexosylceramide; Cer: ceramide; GalCer: galactosylceramide; CerP: ceramide phosphate; DG: diglyceride) (D) Differential expression analysis was performed across all cells based upon their brain structure. The number of lipid markers per structure is depicted here. Full list of differential lipids is presented in Table S6. (E) For the cortex and GE lipid markers, they are plotted based upon their average fold change and specificity (calculated as percent of cells in the structures in which the lipid was detected divided by percent of cells in all other structures in which the lipid was detected). Points are colored by lipid class, if the lipid was identified, otherwise the point is black. Cortex lipids are indicated by a circular point, GE by a diamond point.
Figure 3
Figure 3
Cortex lipidome analysis. (A) Single-cell lipidomics was used as the input for cell clustering of the cells derived from the cortex alone, resulting in 55 clusters (left) and included some cortical area-specific clusters (middle). (B) Lipid markers were calculated across cortical regions. The number of identified lipids in each class were counted, and normalized by dividing by the total number of marker lipids for that area, creating the plotted normalized fraction of marker genes. Each represented lipid class is shown in groups on the x-axis, with bars colored by the cortical area being represented. (C) The UMAP plot of the cortex analysis is colored by the age of the samples, shown in the legend by GW. (D) Box and whisker plots show the number of lipids per cell for each age range in the cortex data. (E) Lipid markers were calculated across cortical stages of development. The number of identified lipids in each class were counted, and normalized by dividing by the total number of marker lipids for that area, creating the plotted normalized fraction of marker genes. Each represented lipid class is shown in groups on the x-axis, with bars colored by the cortical age range being represented.
Figure 4
Figure 4
Lipid-based classification of cell class. (A) Using known cell-type specific lipids, we classified each cell in our data as either neuron, astrocyte, or other, as shown in the recolored UMAP diagram. (B) Feature plots of two lipids that are strongly cluster and cell type enriched suggest that lipids may have strong cell type correspondence. (C) Cortical cells could also be presumptively assigned a cell class, and we observe some cell class and cortical area specific cluster assignments (right). (E) Lipid markers were calculated across inferred cell types. The number of identified lipids in each class were counted, and normalized by dividing by the total number of marker lipids for that area, creating the plotted normalized fraction of marker genes. Each represented lipid class is shown in groups on the x-axis, with bars colored by the cell type being represented.

Similar articles

Cited by

References

    1. Janmey P. A.; Kinnunen P. K. Biophysical properties of lipids and dynamic membranes. Trends Cell Biol. 2006, 16 (10), 538–46. 10.1016/j.tcb.2006.08.009. - DOI - PubMed
    1. Simons K.; Vaz W. L. Model systems, lipid rafts, and cell membranes. Annu. Rev. Biophys. Biomol. Struct. 2004, 33, 269–95. 10.1146/annurev.biophys.32.110601.141803. - DOI - PubMed
    1. van Meer G.; Voelker D. R.; Feigenson G. W. Membrane lipids: where they are and how they behave. Nat. Rev. Mol. Cell Biol. 2008, 9 (2), 112–24. 10.1038/nrm2330. - DOI - PMC - PubMed
    1. Marsh D.; Horvath L. I.; Swamy M. J.; Mantripragada S.; Kleinschmidt J. H. Interaction of membrane-spanning proteins with peripheral and lipid-anchored membrane proteins: perspectives from protein-lipid interactions (Review). Mol. Membr. Biol. 2002, 19 (4), 247–55. 10.1080/09687680210162419. - DOI - PubMed
    1. Tracey T. J.; Steyn F. J.; Wolvetang E. J.; Ngo S. T. Neuronal Lipid Metabolism: Multiple Pathways Driving Functional Outcomes in Health and Disease. Front. Mol. Neurosci. 2018, 11, 10.10.3389/fnmol.2018.00010. - DOI - PMC - PubMed