. 2022 Jan;36(1):11-24.
doi: 10.1007/s10822-021-00434-1. Epub 2022 Jan 1.

Binding site identification of G protein-coupled receptors through a 3D Zernike polynomials-based method: application to C. elegans olfactory receptors

Affiliations

Binding site identification of G protein-coupled receptors through a 3D Zernike polynomials-based method: application to C. elegans olfactory receptors

Lorenzo Di Rienzo et al. J Comput Aided Mol Des. 2022 Jan.

Abstract

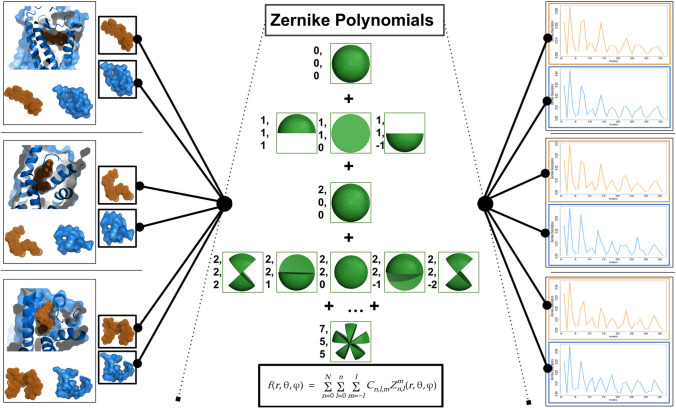
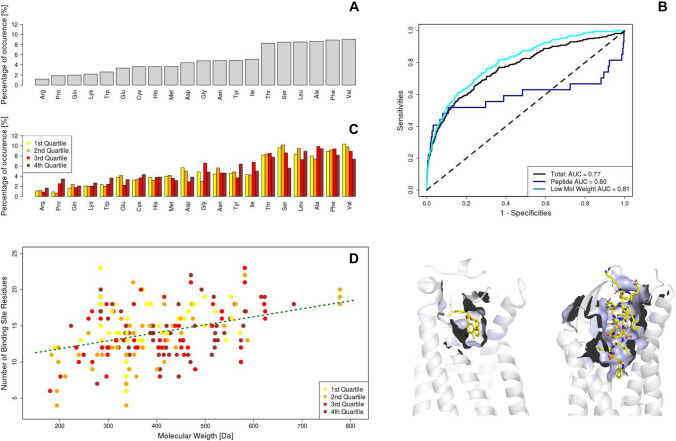
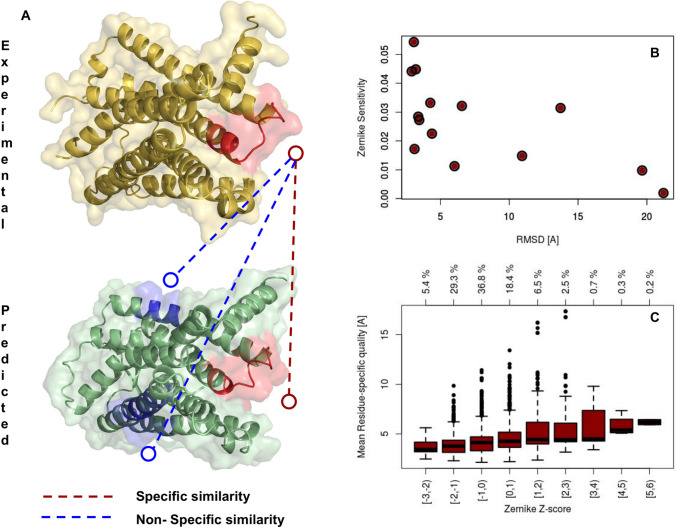
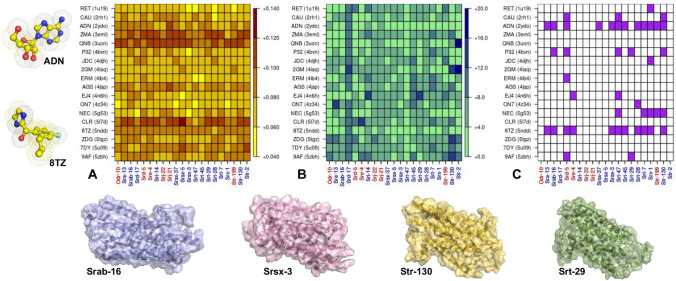
Studying the binding processes of G protein-coupled receptors (GPCRs) proteins is of particular interest both to better understand the molecular mechanisms that regulate the signaling between the extracellular and intracellular environment and for drug design purposes. In this study, we propose a new computational approach for the identification of the binding site for a specific ligand on a GPCR. The method is based on the Zernike polynomials and performs the ligand-GPCR association through a shape complementarity analysis of the local molecular surfaces. The method is parameter-free and it can distinguish, working on hundreds of experimentally GPCR-ligand complexes, binding pockets from randomly sampled regions on the receptor surface, obtaining an Area Under ROC curve of 0.77. Given its importance both as a model organism and in terms of applications, we thus investigated the olfactory receptors of the C. elegans, building a list of associations between 21 GPCRs belonging to its olfactory neurons and a set of possible ligands. Thus, we can not only carry out rapid and efficient screenings of drugs proposed for GPCRs, key targets in many pathologies, but also we laid the groundwork for computational mutagenesis processes, aimed at increasing or decreasing the binding affinity between ligands and receptors.

Keywords: Binding site prediction; GPCR; Protein structure; Protein-ligand interaction.


Figures

Fig. 1
Fig. 1
Schematic Representation of the various step in our computational protocol. Starting from experimental structures of GPCR-ligand complexes, we extracted the molecular surfaces of the protein binding regions and the ligands (left panels). These molecular surfaces can be expanded on the basis of 3D Zernike polynomials (central panel). The norm of the coefficients of this expansion constitute a set of rotationally invariant descriptors, summarizing the shape of the extracted surface (right panels). To compute the complementarity between two interacting surfaces, we compute a distance between their corresponding set of Zernike descriptors
Fig. 2
Fig. 2
Analysis of the interaction between ligands and GPCRs binding sites: application of the Zernike formalism. A The amino acid distribution regarding the amino acids involved in binding. B ROC curves obtained using the Zernike Descriptors. The green line (AUC = 0.77) regards all the dataset, the red line (AUC = 0.60) consider only the interaction between GPCR protein and peptide ligand, while the blue line is related to the ligands with a molecular weight lower than 500 Da (AUC = 0.81). The molecular images represent an example of GPCR-small molecule and GPCR-peptide recognition, respectively on the left and the right. C The same as in A, but the results are grouped according to the membership of each GPCR-ligand complex to one of the quartiles of Zernike accuracy (Cyan = 1st quartile means high complementarity while Brown = 4st quartile means low complementarity.) D The number of Binding site residues as a function of the molecular weight of the ligand. The points are colored according to the membership to one of the quartiles of Zernike accuracy (Cyan = 1st quartile means high complementarity while Brown = 4th quartile means low complementarity.)
Fig. 3
Fig. 3
Evaluation of shape complementarity between different ligand conformations and cognate GPCRs. A Density distribution of the molecular weights of the ligand in our dataset. The area corresponding to each decile of the distribution is colored with a different color. We selected one small ì-molecule from each decile to study their flexibility with molecular dynamics simulation. In the colored boxes we report the molecular representation of three selected molecules, i.e. RET (PDB code: 3pxo), J9P (PDB code: 6m9t), ERM (PDB code :4ib4). B For each ligand selected, we report in blue the Zernike descriptors distances between the experimental ligand conformations and all the molecular dynamics frames, and in red the distances between all the explored frames in the simulation. C The Z-score computed for each frame of each molecular dynamics as a function of the distance between each frame with the corresponding ligand bound conformation. D The Area Under ROC curve we obtained as a function of the frames considered. In the blue curve, we consider ligand conformations progressively less similar to the bound one. In the red curve, we consider ligand conformations progressively more similar to the bound one. The performance we obtained is better when ligand structures similar to the bound state are considered
Fig. 4
Fig. 4
Comparison between experimental and predicted GPCR structures. A Molecular representation of an experimental and predicted structure of a GPCR (pdb:41ar). The similarity between the red regions in these 2 proteins, centered on the same residues on both structures, constitutes the specific similarities ( see Eq. 1), while the comparisons between unrelated regions, depicted in blue and red in this representation, constitute the non specific similarities ( see Eq. 2). B The Sensitivity of the Zernike method, defined as Sns-Ss, as a function of the RMSD between experimental and predicted structures. C Boxplot representing the Mean L-score of the residues constituting a pocket as a function of the difference between specific and non-specific similarities calculated and normalized on a single pocket. On the top are reported the percentage of pockets in each interval: it results than over 70% has a Z-score lower than 0, highlighting a specific similarity statistically better than non-specific ones
Fig. 5
Fig. 5
Summary of the associations between ligands and C. elegans GPCRs. A The distances, computed in terms of their Zernike descriptors, between each putative ligand and the most suitable pocket on each protein structure. It is important to note that when the distance is low (yellow pixel) the complementarity is high. B For each GPCR, the mean L-score of the residues constituting the pocket characterized by the best complementarity with each ligand is reported. C The hypothesized associations between protein and ligands are colored. On x-axis of A), B and, C the GPCRs highlighted in blue print refers to models with a C-score higher than − 1.5, those highlighted in red print to models with a C-score lower than − 1.5. In addition we reported the molecular representation of the two ligands characterized by the highest number of possible GPCR associations and four GPCR proteins

References

    1. Chan HS, et al. Exploring a new ligand binding site of g protein-coupled receptors. Chem Sci. 2018;9:6480–6489. - PMC - PubMed
    1. Couvineau A, Tan Y-V, Ceraudo E, Laburthe M (2013) Strategies for studying the ligand binding site of gpcrs: photoaffinity labeling of the vpac1 receptor, a prototype of class b gpcrs. In Methods in enzymology. Elsevier, vol 520, 219–237 - PubMed
    1. Hauser AS, et al. Pharmacogenomics of gpcr drug targets. Cell. 2018;172:41–54. - PMC - PubMed
    1. Rosenbaum DM, Rasmussen SG, Kobilka BK. The structure and function of g-protein-coupled receptors. Nature. 2009;459:356–363. - PMC - PubMed
    1. Wheatley M, et al. Lifting the lid on gpcrs: the role of extracellular loops. Br J Pharmacol. 2012;165:1688–1703. - PMC - PubMed

Publication types

LinkOut - more resources