. 2022 Mar;21(1):ar7.
doi: 10.1187/cbe.21-04-0105.

A Course-Based Teaching Experience for STEM Undergraduates Improves Student Perceptions of Teaching Self-Efficacy and Attitudes Toward Teaching Careers

Affiliations

A Course-Based Teaching Experience for STEM Undergraduates Improves Student Perceptions of Teaching Self-Efficacy and Attitudes Toward Teaching Careers

Seth Bush et al. CBE Life Sci Educ. 2022 Mar.

Abstract

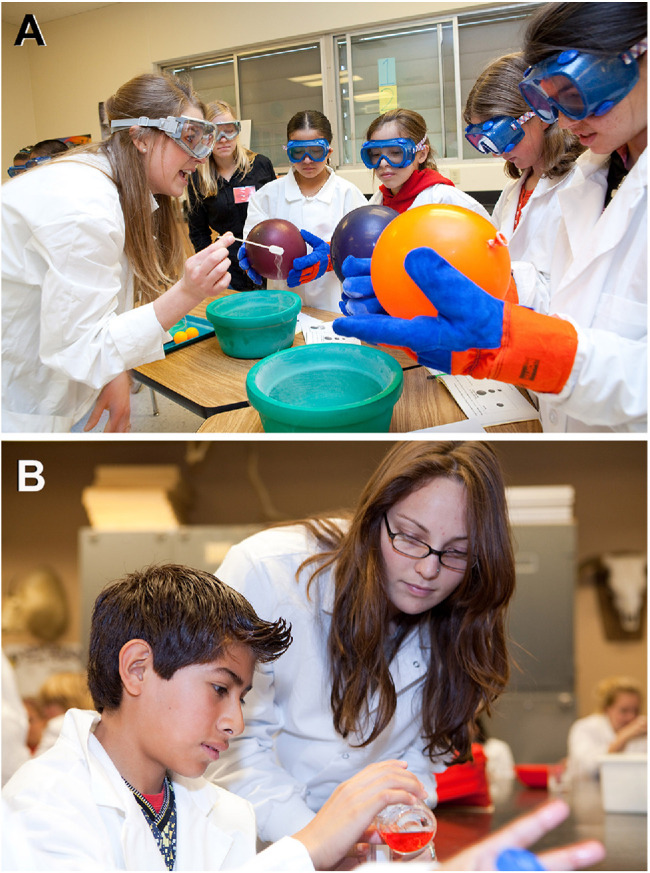
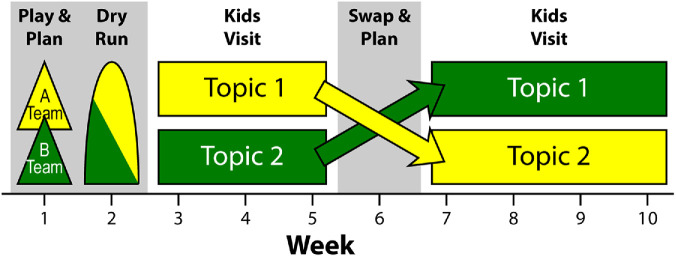
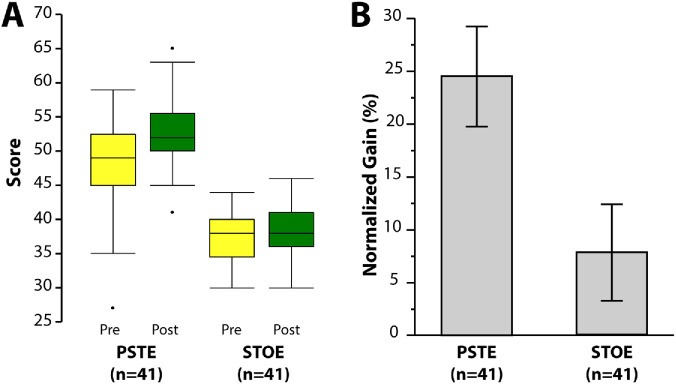
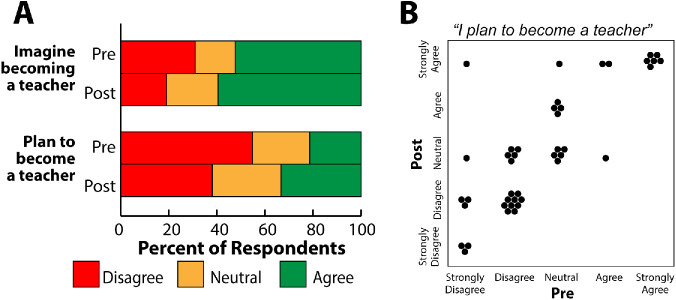
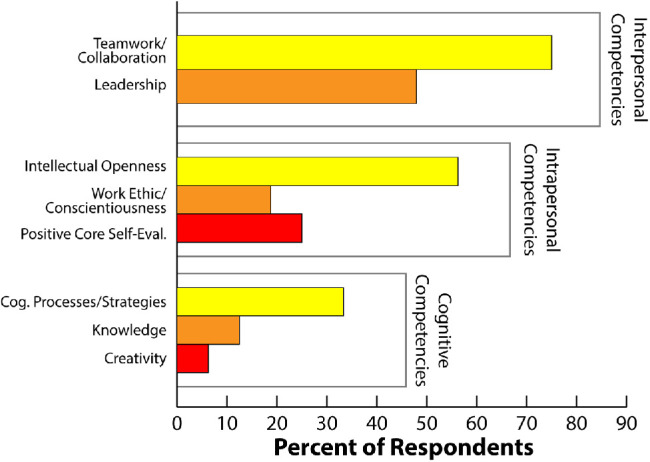
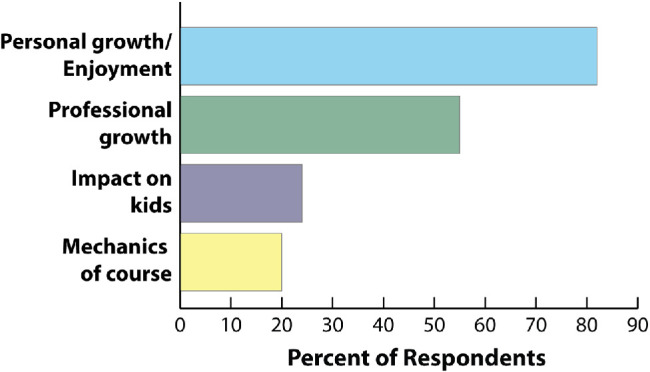
There is a national need to recruit more science teachers. Enhancing pathways to teaching for science, technology, engineering, and mathematics (STEM) majors could help to address this need. The Learn By Doing Lab is a course in which STEM undergraduates teach hands-on life science and physical science to local third- through eighth-grade schoolchildren visiting the campus. To measure the impacts of this teaching experience on the undergraduate participants, we administered a version of the Science Teaching Efficacy Belief Instrument-Preservice survey at the start and end of the course. Significant gains were observed in the students' belief in their personal ability to effectively teach science (self-efficacy). Furthermore, qualitative and quantitative analysis of student reflections revealed that they perceived the Learn By Doing Lab experience to have helped them develop 21st-century competencies, particularly in the areas of collaboration, communication, and adaptability. Finally, the students' overall awareness and positive perception of science teaching careers increased. This indicates that providing a low-barrier course-based teaching experience for STEM undergraduates is a promising strategy to help recruit pre-service teachers, and a step toward alleviating the national STEM teacher shortage.


Figures

FIGURE 1.
FIGURE 1.
Inside the Learn By Doing Lab. SIs leading students in physical science and life science activities in the LBDL. Each year, more than 1400 local schoolchildren visit the LBDL and about 100 Cal Poly STEM majors enroll to teach hands-on science. (A) Visiting students explore temperature/volume relationships with balloons and liquid nitrogen. (B) Strawberry DNA is extracted as part of the genetics curriculum. (Credit: Chris Leschinsky. Photo release was granted by all participants.)
FIGURE 2.
FIGURE 2.
Timeline of the LBDL. The LBDL takes place during a 10-week quarter. Twenty to 30 enrolled students are initially sorted into two teaching cohorts (A team, yellow; B team, green), each of which will teach different content. The first 2 weeks are dedicated to preparation and planning with a “dry run” of the teaching activities in week 2 in which SIs present to their peers and receive feedback. In weeks 3–5, approximately 100 local schoolchildren visit, and the SIs teach the activities. The two cohorts of SIs switch content in week 6 and use that week to prepare to teach a new set of activities. Weeks 7–10 resemble weeks 3–5, with SIs teaching local schoolchildren.
FIGURE 3.
FIGURE 3.
Demographics of the 2019 LBDL cohort. (A) Self-identified gender of LBDL students. (B) Major degree of LBDL students. Degrees represented by only one student are inset. (C) Class standing (level) of LBDL students. (D) First-generation college students (i.e., the first in their families to attend college) among LBDL students. (E) Ethnicity of LBDL students. Represents response to the prompt, “Hispanic/Latino; Not Hispanic/Latino.” (F) Self-identified race of LBDL students.
FIGURE 4.
FIGURE 4.
Perceptions of science teaching and self-efficacy. (A) Box-plot comparison of PSTE and STOE scores for LBDL SIs sampled at the beginning of the quarter (pre, yellow boxes) and at the end (post, green boxes) of LBDL enrollment. (B) Normalized gains for PSTE And STOE scores. Error bars represent ±1 SE around the mean.
FIGURE 5.
FIGURE 5.
Perceptions about becoming a teacher. (A) comparisons of SI responses concerning their relationship to the teaching profession sampled at the beginning (pre) and end (post) of LBDL enrollment. Question prompts are shown to the left of the chart. (B) Shifts in individual respondents’ plans to become a teacher. Each point plots the pre–post relationship of a single student in response to the prompt “I plan to become a teacher.”
FIGURE 6.
FIGURE 6.
SI perception of competencies developed through the LBDL. SI responses to the open-ended prompt “What skills do you feel you developed or used in the LBDL that might help you in ANY career?” were analyzed for emergent themes. Classification of skills presented by the NRC were used. Competencies fall into three domains: interpersonal competencies, intrapersonal competencies, and cognitive competencies. Within each domain, there are two or three clusters each representing a group of related competencies; these are listed along the y-axis. The percent of respondents identifying a competency within each cluster was determined.
FIGURE 7.
FIGURE 7.
Reasons for recommending the LBDL to a friend. More than 90% of respondents indicated that they would recommend registering for the LBDL to a friend. Those replying positively were asked in an open-ended prompt to provide justification. The four most common responses are summarized in the figure.

References

    1. Bandura, A. (1977). Self-efficacy: Toward a unifying theory of behavioral change. Psychological Review, 84, 191–215. - PubMed
    1. Bleicher, R. E. (2004). Revisiting the STEBI-B: Measuring self-efficacy in preservice elementary teachers. School Science and Mathematics, 104, 383–391. 10.1111/j.1949-8594.2004.tb18004.x - DOI
    1. Briggs, S. (2013). How peer teaching improves student learning and 10 ways to encourage it. InformEd. Retrieved May 3, 2021, from www.opencolleges.edu.au/informed/features/peer-teaching/
    1. Bruno, P. A., Love Green, J. K., Illerbrun, S. L., Holness, D. A., Illerbrun, S. J., Haus, K. A., ... & Sveinson, K. L. (2016). Students helping students: Evaluating a pilot program of peer teaching for an undergraduate course in human anatomy. Anatomical Sciences Education, 9(2), 132–142. 10.1002/ase.1543 - DOI - PMC - PubMed
    1. Chrispeels, H. E., Klosterman, M. L., Martin, J. B., Lundy, S. R., Watkins, J. M., Gibson, C. L., Muday, G. K. (2014). Undergraduates achieve learning gains in plant genetics through peer teaching of secondary students. CBE—Life Sciences Education, 13(4), 641–652. - PMC - PubMed

LinkOut - more resources