. 2022 Feb;21(2):100192.
doi: 10.1016/j.mcpro.2021.100192. Epub 2021 Dec 31.

Multidimensional Dynamics of the Proteome in the Neurodegenerative and Aging Mammalian Brain

Affiliations

Multidimensional Dynamics of the Proteome in the Neurodegenerative and Aging Mammalian Brain

Byron Andrews et al. Mol Cell Proteomics. 2022 Feb.

Abstract

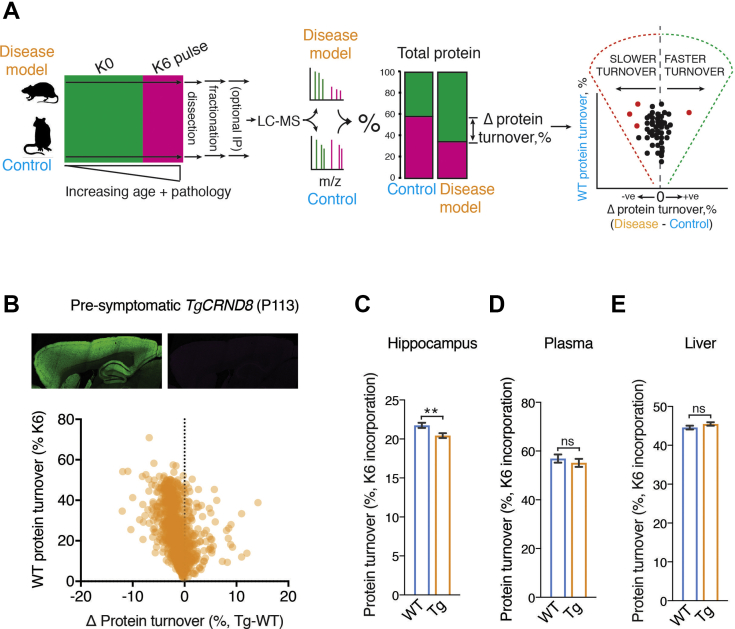
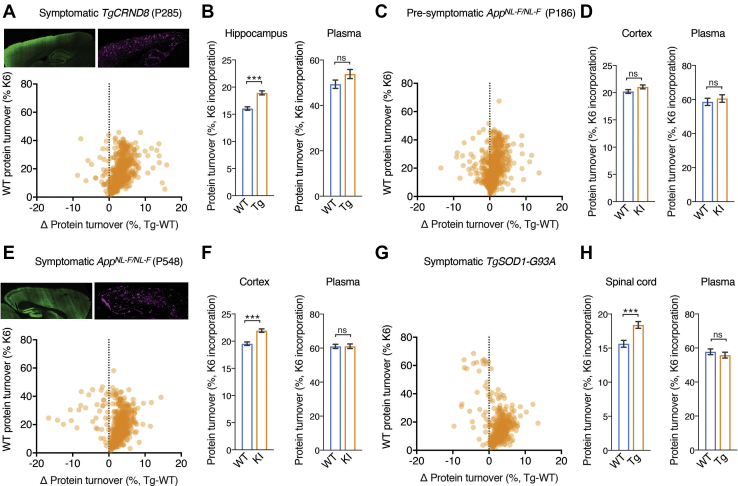
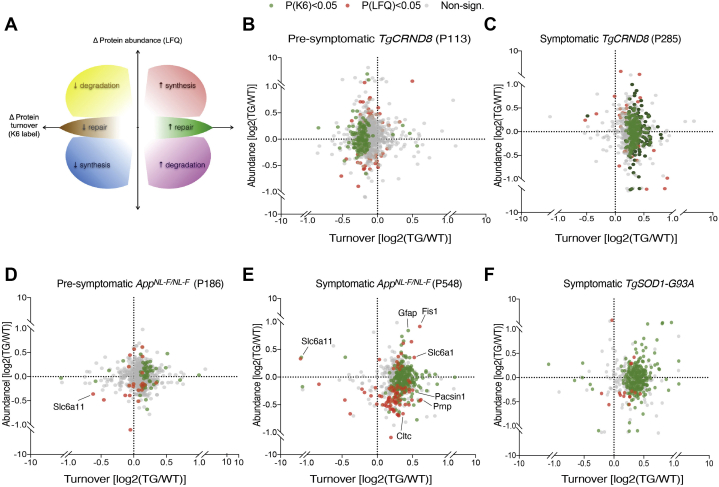
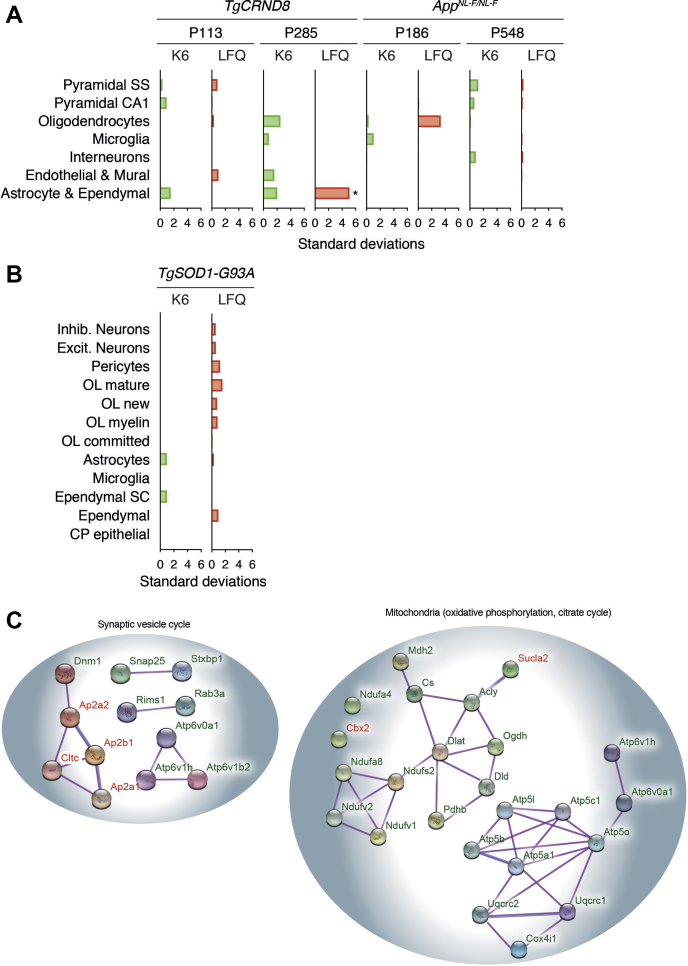
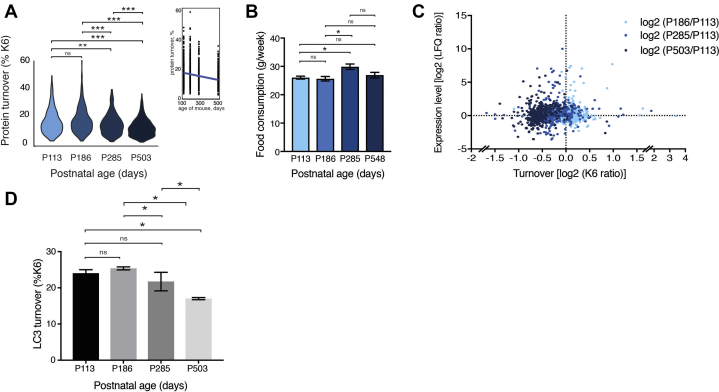
The amount of any given protein in the brain is determined by the rates of its synthesis and destruction, which are regulated by different cellular mechanisms. Here, we combine metabolic labeling in live mice with global proteomic profiling to simultaneously quantify both the flux and amount of proteins in mouse models of neurodegeneration. In multiple models, protein turnover increases were associated with increasing pathology. This method distinguishes changes in protein expression mediated by synthesis from those mediated by degradation. In the AppNL-F knockin mouse model of Alzheimer's disease, increased turnover resulted from imbalances in both synthesis and degradation, converging on proteins associated with synaptic vesicle recycling (Dnm1, Cltc, Rims1) and mitochondria (Fis1, Ndufv1). In contrast to disease models, aging in wild-type mice caused a widespread decrease in protein recycling associated with a decrease in autophagic flux. Overall, this simple multidimensional approach enables a comprehensive mapping of proteome dynamics and identifies affected proteins in mouse models of disease and other live animal test settings.

Keywords: Alzheimer's disease; SILAM; aging; neurodegeneration; protein turnover; proteomics.


Conflict of interest statement

Conflict of interest The authors declare no competing interests.

Figures

None
Graphical abstract
Fig. 1
Fig. 1
Metabolic labeling of live mice to measure changes in protein turnover.A, left, schematic summarizing the 13C heavy lysine (K6) labeling method for measuring changes in protein turnover in mice. Cohorts of genetically and age-matched mice were maintained on regular food until the desired labeling window. The groups of mice are then switched to K6 diet for an identical period before tissues were processed for orbitrap LC-MS/MS. Middle, ion pairs with a 6 Da difference in mass were detected and sequenced, corresponding to peptides with and without K6. The relative incorporation of K6 was calculated in disease and wild-type mice. Right, the mean difference in K6 incorporation is calculated for each protein and plotted (x-axis) to highlight slowdown or increases in protein turnover versus whether a protein has fast or slow turnover (WT K6 incorporation, y-axis). B, top, immunohistochemical detection of synaptic marker, left, Psd95 and right, β-amyloid pathology in sagittal sections of presymptomatic TgCRND8 (P113) mouse brain. Bottom, scatter plot showing protein turnover changes in the hippocampus of presymptomatic (P113) TgCRND8 mice (see supplemental Table S1). In total, 1392 proteins were quantified in both diseased and healthy cohorts of mice (2–3 mice in each cohort). The mean difference of K6 incorporation for each protein (x-axis, Tg - WT) was plotted against the incorporation in WT (y-axis). Three TgCRND8 and three age-, sex-, and background-matched WT mice were K6 labeled for 6 days. These data indicate a global decrease in protein turnover for hippocampal proteins with both a slow and fast turnover. C, bar chart showing average protein turnover of 1392 proteins in the hippocampus of TgCRND8 and WT mice. An overall 6.1% slowdown in turnover was recorded in the hippocampus (p = 0.0037). Error bars indicate SEM. ∗∗p < 0.01. D, bar chart showing average plasma protein turnover in TgCRND8 and WT mice. No significant difference was detected (p = 0.128, n = 118). Error bars indicate SEM. ns, not significant. E, bar chart showing average liver protein turnover in TgCRND8 and WT mice. No significant difference was detected (p = 0.17, n = 590). ns, not significant.
Fig. 2
Fig. 2
Differences in protein turnover in transgenic and knock-in models of AD and a transgenic model of ALS.A, top, immunohistochemical detection of synaptic marker, left, Psd95 and right, β-amyloid pathology in sagittal sections of symptomatic TgCRND8 (P285) mouse brain. Bottom, scatter plot showing protein turnover changes in the hippocampus of symptomatic (P285) TgCRND8 mice (see supplemental Table S1). In total, 847 proteins were quantified, and the difference in turnover characteristics between proteins in diseased and healthy animals was plotted as described in Figure 1B (2–3 mice in each cohort). B, left bar chart showing the average hippocampal protein turnover of 847 proteins in TgCRND8 and WT mice. An overall 18.0% increase in protein turnover was detected (p < 0.0001). Error bars indicate SEM. ∗∗∗p < 0.0001. Right bar chart showing average plasma protein turnover in TgCRND8 and WT mice (2–3 mice in each cohort). No significant difference was detected (p = 0.102, n = 74). Error bars indicate SEM. ns, not significant. C, scatter plot showing protein turnover changes in the cortex of presymptomatic (P186) AppNL-F/NL-F mice (see supplemental Table S1). In total, 721 proteins were quantified, and the difference in turnover characteristics between proteins in diseased and healthy animals was plotted as described in Figure 1B (2–3 mice in each cohort). D, left bar chart showing the average cortex protein turnover of 721 proteins in AppNL-F/NL-F and WT mice (2–3 mice in each cohort). No change in protein turnover was detected (p < 0.0735). Error bars indicate SEM. ns, not significant. Right bar chart showing average plasma protein turnover in AppNL-F/NL-F and WT mice (2–3 mice in each cohort). No significant difference was detected (p = 0.534, n = 48). Error bars indicate SEM. ns, not significant. E, top, immunohistochemical detection of synaptic marker, left, Psd95 and right, β-amyloid pathology in sagittal sections of symptomatic AppNL-F/NL-F (P500) mouse brain. Bottom, scatter plot showing protein turnover changes in the cortex of symptomatic (P548) AppNL-F/NL-F mice from (see supplemental Table S1). In total, 721 proteins were quantified, and the difference in turnover characteristics between proteins in diseased and healthy animals was plotted as described in Figure 1B (2–3 mice in each cohort). F, left bar chart showing the average cortex protein turnover of 847 proteins in AppNL-F/NL-F and WT mice (2–3 mice in each cohort). An overall 15.7% increase in protein turnover was detected (p < 0.0001). Error bars indicate SEM. ∗∗∗p < 0.0001. Right bar chart showing average plasma protein turnover in AppNL-F/NL-F and WT mice (2–3 mice in each cohort). No significant difference was detected (p = 0.961, n = 95). Error bars indicate SEM. ns, not significant. G, scatter plot showing protein turnover changes in the spinal cord of acutely symptomatic (P120) TgSOD1-G93A mice (see supplemental Table S1). In total, 496 proteins were quantified, and the difference in turnover characteristics between proteins in diseased and healthy animals was plotted as described in Figure 1B (2–3 mice in each cohort). H, left bar chart showing the average protein turnover of 496 proteins in the spinal cord of TgSOD1-G93A and WT mice (2–3 mice in each cohort). An overall 17.6% increase in protein turnover was detected (p < 0.0001). Error bars indicate SEM. ∗∗∗p < 0.0001. Right bar chart showing average plasma protein turnover in TgSOD1-G93A and WT mice (2–3 mice in each cohort). No significant difference was detected (p = 0.417, n = 89). Error bars indicate SEM. ns, not significant.
Fig. 3
Fig. 3
Multidimensional measurement of proteome dynamics in live mice.A, schematic of a dynaplot showing the change in protein turnover (x-axis, K6 label) plotted against the change in protein abundance (y-axis, LFQ). The coordinate space of the plot reflect dynamics of a protein that can be attributed to a net increase (red) or decrease (blue) in the rate of synthesis; net increase (magenta) or decrease (yellow) in degradation. Change in turnover that does not result in a change in steady-state expression indicate change in flux of increasing (green) or decreasing repair (brown). B, dynaplot of hippocampal proteins in presymptomatic (P113) TgCRND8 mice, as compared with healthy, matched control mice (2–3 mice in each cohort). Proteins that were significantly different in turnover (p < 0.01) are highlighted in green, while those that were significantly different in steady-state amount (p < 0.01) are highlighted in red. C, dynaplot of hippocampal proteins in acutely symptomatic (P285) TgCRND8 mice, as compared with healthy, matched control mice. D, dynaplot of cortex proteins in presymptomatic (P186) AppNL-F/NL-F mice, as compared with healthy, matched control mice. E, dynaplot of cortex proteins in symptomatic (P548) AppNL-F/NL-F mice, as compared with healthy, matched control mice. F, dynaplot of hippocampal proteins in acutely symptomatic (P120) TgSOD1-G93A mice, as compared with healthy, matched control mice. See supplemental Table S4.
Fig. 4
Fig. 4
Cell type enrichment and proteins with perturbed dynamics converge on presynaptic functions in mouse model of Alzheimer’s disease.A, cell type enrichment of the top 1% of differentially expressed genes from each experiment (P113 and P285 TgCRND8; P186 and P548 APPNL-F/NL-F) for both protein turnover (K6) and label-free protein quantification levels (LFQ). Cell type enrichment was produced using Expression Weighted Cell Type Enrichment (EWCE) with bootstrap sampling repeated 10,000 times. y-axis, cell type. x-axis, standard deviations from the mean specificity in that cell type. ∗, corrected p < 0.05 (Benjamini and Hochberg). B, same as A but for TgSOD1-G93A using spinal cord EWCE dataset. Inhib. and Excit., spinal cord inhibitory and excitatory neurons, respectively. OL, oligodendrocytes. Ependymal SC, spinal cord ependymal cells. CP epithelial, chorid plexus epithelial cells. C, gene ontology enrichment using KEGG database (see Experimental Procedures) identified left, synaptic vesicle recycling, and right, mitochondrial pathways enriched with the proteins whose turnover (green) or steady-state amount (red) has significantly changed in symptomatic (P548) AppNL-F/NL-F cortex. Purple and blue edges indicate empirically determined protein–protein interactions and protein homology, respectively.
Fig. 5
Fig. 5
Proteome dynamics associated with aging in healthy mice.A, average protein turnover in healthy mouse cortex at various ages. In total, 360 proteins were used to compare turnover across all ages (n = 3 at each postnatal age). p values for the comparisons (descending from top): 1.063e−06, 4.557e−14, 1.220e−05, 6.799e−14, 0.003, 0.175. B, average food consumption of mice at different ages: P113 (n = 4), P186 (n = 2), P285 (n = 4), P548 (n = 11). No significant change in appetite associated with aging was detected. p values for the comparisons (descending from top) = 0.127, 0.675, 0.047, 0.694, 0.011, 0.692. C, dynaplot of mouse cortex proteins depicting the change in proteome dynamics in healthy control mice from P113 to P186 (sky blue), to P285 (blue), and to P548 (dark blue). These data are expressed ratiometrically to allow simpler visualization between different ages of mice. D, bar graph showing apparent decrease in turnover of LC3, marker of autophagy, as mice age. Turnover was estimated by percentage heavy lysine incorporation (P6) in mice at postnatal days 113, 186, 285, and 503. ∗p < 0.05. n.s., non-significant.

References

    1. Dwyer B.E., Fando J.L., Wasterlain C.G. Rat brain protein synthesis declines during postdevelopmental aging. J. Neurochem. 1980;35:746–749. - PubMed
    1. Fornasiero E.F., Mandad S., Wildhagen H., Alevra M., Rammner B., Keihani S., Opazo F., Urban I., Ischebeck T., Sakib M.S., Fard M.K., Kirli K., Centeno T.P., Vidal R.O., Rahman R.-U., et al. Precisely measured protein lifetimes in the mouse brain reveal differences across tissues and subcellular fractions. Nat. Commun. 2018;9:4230. - PMC - PubMed
    1. Price J.C., Guan S., Burlingame A., Prusiner S.B., Ghaemmaghami S. Analysis of proteome dynamics in the mouse brain. Proc. Natl. Acad. Sci. U. S. A. 2010;107:14508–14513. - PMC - PubMed
    1. Savas J.N., Toyama B.H., Xu T., Yates J.R., Hetzer M.W. Extremely long-lived nuclear pore proteins in the rat brain. Science. 2012;335:942. - PMC - PubMed
    1. Toyama B.H., Hetzer M.W. Protein homeostasis: Live long, won't prosper. Nat. Rev. Mol. Cell Biol. 2013;14:55–61. - PMC - PubMed

Publication types