Review
. 2022 Apr 1:249:118870.
doi: 10.1016/j.neuroimage.2021.118870. Epub 2022 Jan 1.

Quantitative mapping of the brain's structural connectivity using diffusion MRI tractography: A review

Affiliations
Review

Quantitative mapping of the brain's structural connectivity using diffusion MRI tractography: A review

Fan Zhang et al. Neuroimage. .

Abstract

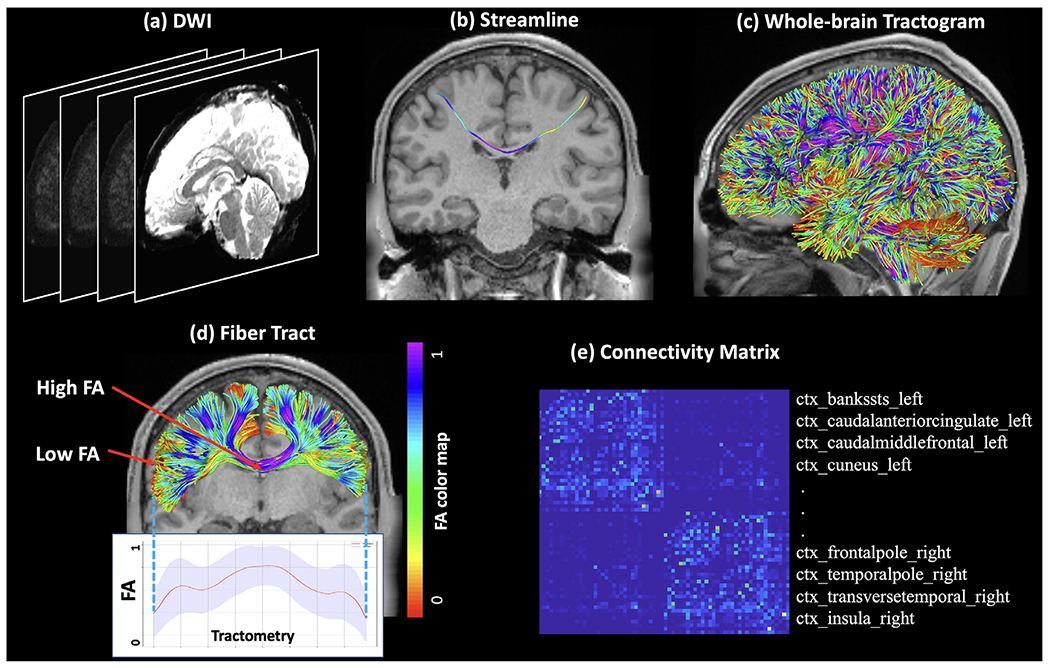
Diffusion magnetic resonance imaging (dMRI) tractography is an advanced imaging technique that enables in vivo reconstruction of the brain's white matter connections at macro scale. It provides an important tool for quantitative mapping of the brain's structural connectivity using measures of connectivity or tissue microstructure. Over the last two decades, the study of brain connectivity using dMRI tractography has played a prominent role in the neuroimaging research landscape. In this paper, we provide a high-level overview of how tractography is used to enable quantitative analysis of the brain's structural connectivity in health and disease. We focus on two types of quantitative analyses of tractography, including: 1) tract-specific analysis that refers to research that is typically hypothesis-driven and studies particular anatomical fiber tracts, and 2) connectome-based analysis that refers to research that is more data-driven and generally studies the structural connectivity of the entire brain. We first provide a review of methodology involved in three main processing steps that are common across most approaches for quantitative analysis of tractography, including methods for tractography correction, segmentation and quantification. For each step, we aim to describe methodological choices, their popularity, and potential pros and cons. We then review studies that have used quantitative tractography approaches to study the brain's white matter, focusing on applications in neurodevelopment, aging, neurological disorders, mental disorders, and neurosurgery. We conclude that, while there have been considerable advancements in methodological technologies and breadth of applications, there nevertheless remains no consensus about the "best" methodology in quantitative analysis of tractography, and researchers should remain cautious when interpreting results in research and clinical applications.


Figures

Fig. 1.
Fig. 1.
Graphic illustration of tractography. (a) Example dMRI data, also known as diffusion weighted imaging (DWI) data. (b) An individual streamline computed after performing tractography. (c) An example whole-brain tractogram that consists of streamlines covering the entire white matter. (d) A fiber bundle that consists of a set of streamlines, representing an anatomical fiber tract named the corpus callosum. The streamlines are colored by a microstructural measure, i.e., fractional anisotropy (FA) that measures the anisotropy of water diffusion. The distribution of FA along the fiber tract is provided to show the tractometry of the tract. A low FA can be seen at the endpoint region of the streamlines (near the cortex) and a high FA can be seen in the middle of the streamlines (in the deep white matter). (e) An example brain structural connectivity matrix, which is constructed based on white matter tractography from the whole brain. Each row (and column) represents a brain gray matter ROI (See Fig. 3(c) for an example brain gray matter parcellation), and the value in an element of the matrix is the strength of the white matter connection between the two corresponding ROIs (quantified as the number of streamlines in this case).
Fig. 2.
Fig. 2.
Demonstrations of various forms of errors and biases in tractography, as described in Section 3. Images are exemplars only; therefore there exist many other possible manifestations of such biases and errors. 1. Low-order integration methods under-estimate bundle curvature, leading to reconstructed paths overshooting the underlying curved trajectory. 2. In the absence of tailored constraints, streamlines may terminate in locations other than those known to contain axon synapses. 3. The number of streamlines generated within a bundle may not be proportional to the underlying axonal density of that bundle. 4. Because of the low resolution of diffusion MRI relative to the complexity of gyral folding, streamline termination may accumulate at gyral crowns rather than being distributed uniformly across the cortical ribbon. 5. Where macroscopic WM bundles intersect, streamlines may erroneously traverse part of one bundle and part of another, producing trajectories that are not present in the underlying structure (Schilling et al., 2021).
Fig. 3.
Fig. 3.
Tractography segmentation: (a) Example whole-brain tractogram computed by performing tractography in DWI data; (b) Example anatomical tracts extracted from the tractogram; and (c) Example structural connectivity matrix constructed by performing whole brain tractography segmentation between all pairs of FreeSurfer cortical regions.
Fig. 4.
Fig. 4.
Graph theoretical analysis of the human connectome. (a) Network diagram of structural connectivity, where nodes represent gray matter ROIs and connections depict white matter fiber bundles. (b) Schematics of key graph theory concepts applied to the analysis of structural connectivity. The thickness of connections indicates the strength of structural connectivity between two ROIs (e.g., NOS or integrated FA). Region-level graph measures such as degree, strength, and centrality identify ROI B as an important hub in the network. At the mesocale, two modules or communities are observed. Intra-module connectivity is dense and inter-module connectivity in sparse. At the global scale, communication paths delineate multi-step sequences linking anatomically unconnected ROIs. Two possible paths connecting ROIs A and C are highlighted in green (shortest path) and orange (alternative path).

References

    1. Abdolalizadeh A, Ostadrahimi H, Mohajer B, Darvishi A, Sattarian M, Ershadi ASB, Abbasi N, 2020. White matter microstructural properties associated with impaired attention in chronic schizophrenia: a multi-center study. Psychiatry Res. Neuroimaging 302, 111105. - PubMed
    1. Abhinav K, Yeh FC, Mansouri A, Zadeh G, Fernandez-Miranda JC, 2015. High-definition fiber tractography for the evaluation of perilesional white matter tracts in high-grade glioma surgery. Neuro. Oncol 17, 1199–1209. - PMC - PubMed
    1. Aerts H, Schirner M, Jeurissen B, Van Roost D, Achten E, Ritter P, Marinazzo D, 2018. Modeling brain dynamics in brain tumor patients using the virtual brain. eNeuro 5. - PMC - PubMed
    1. Afzali M, Pieciak T, Newman S, Garifallidis E, Özarslan E, Cheng H, Jones DK, 2020. The sensitivity of diffusion MRI to microstructural properties and experimental factors. J. Neurosci. Methods 108951. - PMC - PubMed
    1. Akram H, Sotiropoulos SN, Jbabdi S, Georgiev D, Mahlknecht P, Hyam J, Foltynie T, Limousin P, De Vita E, Jahanshahi M, et al. , 2017. Subthalamic deep brain stimulation sweet spots and hyperdirect cortical connectivity in Parkinson’s disease. Neuroimage 158, 332–345. - PMC - PubMed

Publication types

MeSH terms