. 2022 Oct 1;146(10):1273-1280.
doi: 10.5858/arpa.2021-0197-OA.

Efficient Visualization of Whole Slide Images in Web-based Viewers for Digital Pathology

Affiliations

Efficient Visualization of Whole Slide Images in Web-based Viewers for Digital Pathology

Peter J Schüffler et al. Arch Pathol Lab Med. .

Abstract

Context.—: Wide adoption of digital pathology requires efficient visualization and navigation in Web-based digital slide viewers, which is poorly defined.

Objective.—: To define and quantify relevant performance metrics for efficient visualization of cases and slides in digital slide viewers.

Design.—: With a universal slide viewer used in clinical routine diagnostics, we evaluated the impact of slide caching, compression type, tile, and block size of whole slide images generated from Philips, Leica, and 3DHistech scanners on streaming performance on case, slide, and field of view levels.

Results.—: Two hundred thirty-nine pathologists routinely reviewed 60 080 whole slide images over 3 months. The median time to open a case's slides from the laboratory information system was less than 4 seconds, the time to change to a slide within the case was less than 1 second, and the time to render the adjacent field of view when navigating the slide was less than one-quarter of a second. A whole slide image's block size and a viewer tile size of 1024 pixels showed best performance to display a field of view and was preferrable over smaller tiles due to fewer mosaic effects. For Philips, fastest median slide streaming pace was 238 ms per field of view and for 3DHistech, 125 ms. For Leica, the fastest pace of 108 ms per field of view was established with block serving without decompression.

Conclusions.—: This is the first study to systematically assess user-centric slide visualization performance metrics for digital viewers, including time to open a case, time to change a slide, and time to change a field of view. These metrics help to improve the viewer's configuration, leading to an efficient visualization baseline that is widely accepted among pathologists using routine digital pathology.


Figures

Figure 1.
Figure 1.
Time to open a case (TOC), time to change a slide (TCS), time to show a field of view (TFOV), and time per tile (TPT) with and without caching of whole slide images (WSIs). Red line: Median time of event with caching of WSI. Gray vertical line: We switched off caching of WSI on September 18, 2020. Green line: Median time of event without caching of WSI. A, TOC. Every case opened by a pathologist in the viewer from the laboratory information system is represented by a black dot (n = 5691). B, TCS. Every slide changed to in the viewer is represented by a black dot (n = 12 165). C, TFOV. Every slide navigation in the viewer queries a new FOV represented by a black dot (n = 88 217). D, TPT. Every tile queried in the viewer is represented by a black dot (n = 35 049). The performance gain to open a case by 2.4 seconds and to change a slide by 1.0 second when not caching the WSI outweighs the loss of slower retrieval of subsequent FOVs by 44 ms and tiles by 86 ms. Therefore, we do not cache WSIs going forward.
Figure 2.
Figure 2.
Compression of whole slide images (WSIs) influences field of view (FOV) loading speed (time to show an FOV [TFOV]) and file size. A, JPEG2000-compressed WSIs need significantly longer to load an FOV (median 515 ms) than JPEG-compressed WSIs (median 446 ms) (N = 15 663 measured FOV). B, JPEG2000 compression leads to smaller files with a median of 36 kB per block compared with JPEG with a median of 60 kB per block (N = 2255 WSIs). All WSIs use a block size of 512 pixels and a compression quality factor of Q = 70. P value: 2-sample t-test.
Figure 3.
Figure 3.
Viewer performance for different vendors’ whole slide images (WSIs). A, Time to change a slide (TCS). In all cases, we can differentiate between first-time access of a WSI (darker color) and consecutive access (lighter color). While the first-time accesses need in the median 333 ms (Philips-SDK), 439 ms (Leica-OS), 562 ms (Leica-Own), or 568 ms (3DHistech-SDK) for the change to that slide, returning to those slides greatly improves their loading time to 93 ms (Philips-SDK), 78 ms (Leica-OS), 81 ms (Leica-Own), or 101 ms (3DHistech-SDK) as their slide objects are already instantiated. B, Time to show a field of view (TFOV). Median times to display a new FOV are 318 ms (Philips-SDK), 256 ms (Leica-OS), 156 ms (Leica-Own), and 204 ms (3DHistech-SDK).
Figure 4.
Figure 4.
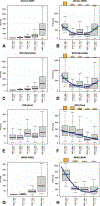
Relationship between tile size and time per tile (TPT, left column) or time to show a field of view (TFOV, right column). Tile sizes are given as width × height, and are typically quadratic, except for our own SVS byte reader. As expected, larger tiles need more time to be generated and transferred over the network, consistently throughout all tested file formats. Still, the FOV generation profits from larger tiles up to a size of 1024 pixels, because fewer tiles have to be loaded to display the FOV. A and B, Philips iSyntax files (accessed with Philips’ software development kit [SDK]). C and D, Leica SVS files (accessed with our own byte reader). E and F, Leica SVS files (accessed with OpenSlide). G and H, 3DHistech MRXS files (accessed with 3DHistech’s SDK). Blue: polynomial regression line. Orange: median number of tiles loaded per FOV as measured in the viewer. Abbreviation: N, number of measured FOV events.
Figure 5.
Figure 5.
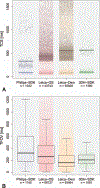
Time to show a field of view (TFOV), stratified by slides of Philips (software development kit [SDK], blue, NWSI = 209), Leica (OS, red, NWSI = 9018), Leica (Own, yellow, NWSI = 12 846), and 3DHistech (SDK, green, NWSI = 272) and by tile size in the viewer and block size in the whole slide image (WSI). WSIs were streamed with a random tile size per WSI. Leica scanners had been configured to use different block sizes. Philips and 3DHistech scanners could not be configured and used fixed block sizes. All measured FOVs were 1920 × 915 pixels. Abbreviation: N, number of relevant FOV events (total 163 017).

References

    1. Pantanowitz L. Digital images and the future of digital pathology. J Pathol Inform. 2010;1(1):15. doi:10.4103/2153-3539.68332 - DOI - PMC - PubMed
    1. Hanna MG, Reuter VE, Hameed MR, et al. Whole slide imaging equivalency and efficiency study: experience at a large academic center. Mod Pathol. 2019;32(7):916–928. doi:10.1038/s41379-019-0205-0 - DOI - PubMed
    1. Hanna MG, Reuter VE, Ardon O, et al. Validation of a digital pathology system including remote review during the COVID-19 pandemic. Mod Pathol. 2020;33(11):2115–2127. doi:10.1038/s41379-020-0601-5 - DOI - PMC - PubMed
    1. Buck TP, Dilorio R, Havrilla L, O’Neill DG. Validation of a whole slide imaging system for primary diagnosis in surgical pathology: a community hospital experience. J Pathol Inform. 2014;5(1):43. doi:10.4103/2153-3539.145731 - DOI - PMC - PubMed
    1. Bauer TW, Schoenfield L, Slaw RJ, Yerian L, Sun Z, Henricks WH. Validation of whole slide imaging for primary diagnosis in surgical pathology. Arch Pathol Lab Med. 2013;137(4):518–524. doi:10.5858/arpa.2011-0678-OA - DOI - PubMed