

Metabolomic and transcriptomic analysis of Lycium chinese and L. ruthenicum under salinity stress
- PMID: 34979910
- PMCID: PMC8722043
- DOI: 10.1186/s12870-021-03375-x
Metabolomic and transcriptomic analysis of Lycium chinese and L. ruthenicum under salinity stress
Erratum in
-
Correction to: Metabolomic and transcriptomic analysis of Lycium chinese and L. ruthenicum under salinity stress.BMC Plant Biol. 2022 Jan 24;22(1):50. doi: 10.1186/s12870-022-03436-9. BMC Plant Biol. 2022. PMID: 35073875 Free PMC article. No abstract available.
Abstract
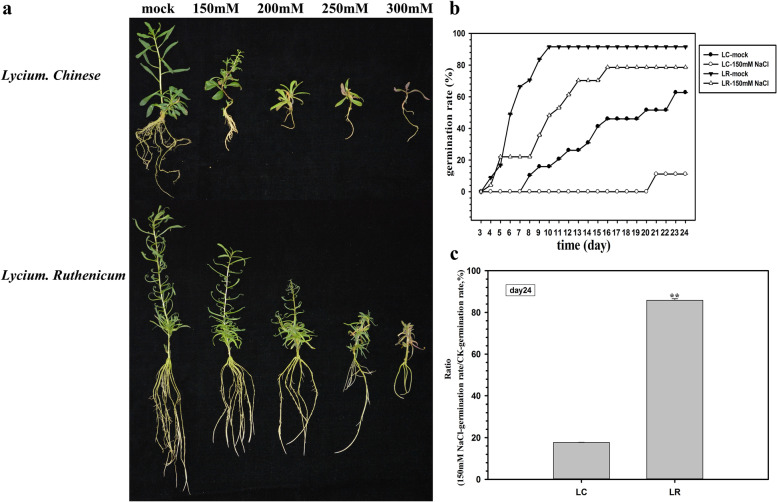
Background: High soil salinity often adversely affects plant physiology and agricultural productivity of almost all crops worldwide, such as the crude drug known as wolfberry. However, the mechanism of this action in wolfberry is not fully understood yet.
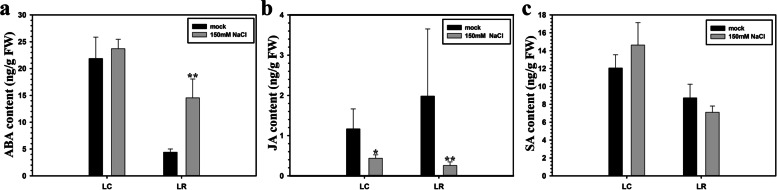
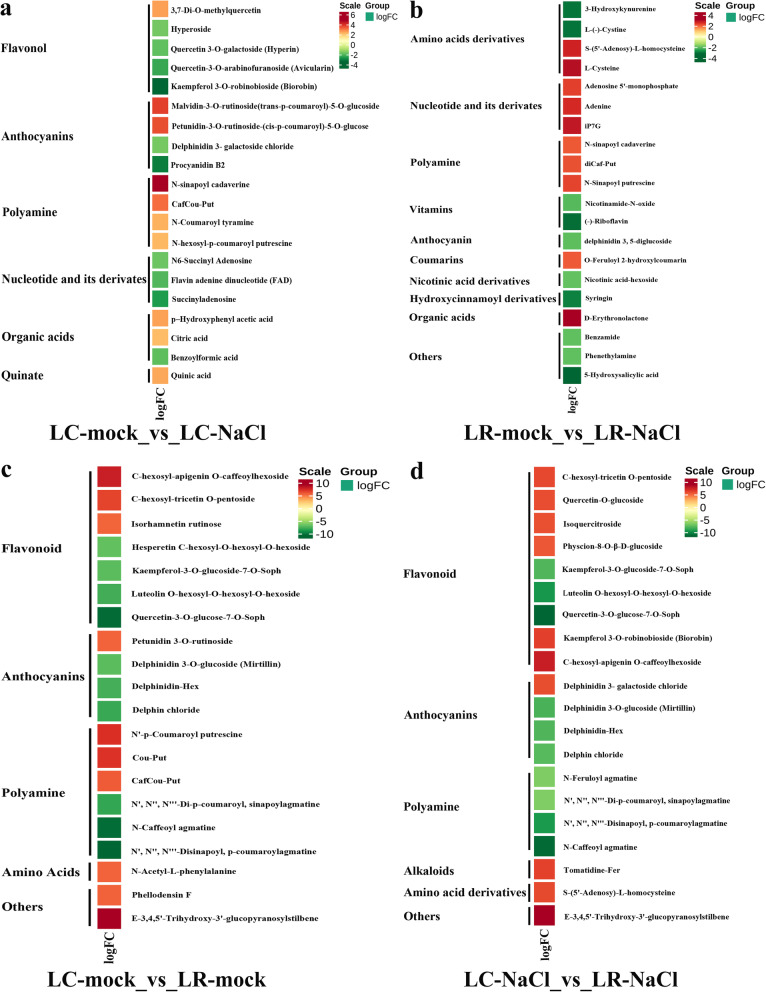
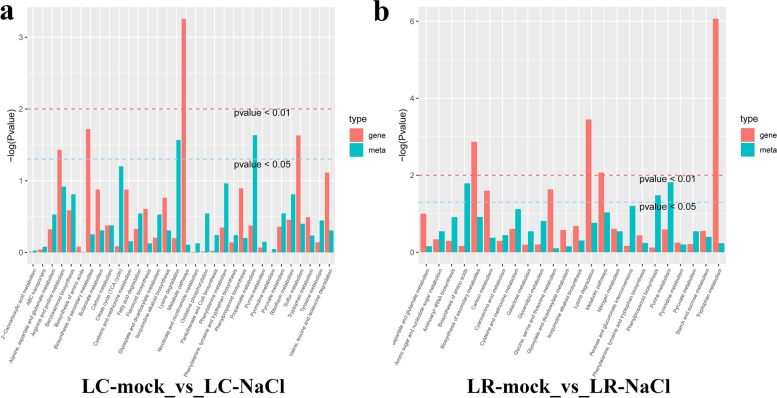
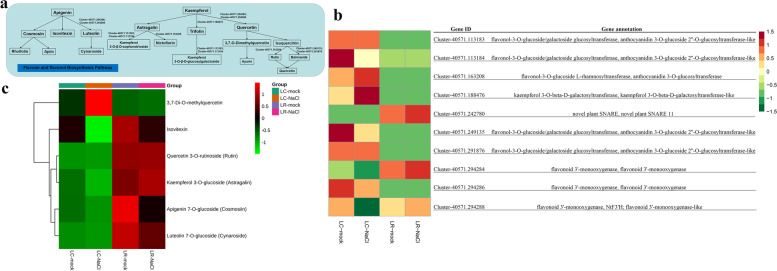
Results: Here in this study, we studied different mechanisms potentially in Chinese wolfberry (Lycium chinese, LC) and black wolfberry (L. ruthenicum, LR) under salinity stress, by analyzing their transcriptome, metabolome, and hormone changes. The hormone detection analysis revealed that the ABA content was significantly lower in LR than LC under normal condition, and increased sharply under salinity stress in LR but not in LC. The transcriptome analysis showed that the salinity-responsive genes in wolfberry were mainly enriched in MAPK signaling, amino sugar and nucleotide sugar metabolism, carbon metabolism, and plant hormone signal transduction pathways in LC, while mainly related to carbon metabolism and protein processing in endoplasmic reticulum in LR. Metabolome results indicated that LR harbored higher flavone and flavonoid contents than LC under normal condition. However, the flavone and flavonoid contents were hardly changed in LR, but increased substantially in LC when exposed to salinity stress.
Conclusions: Our results adds ABA and flavone to mechanism understanding of salinity tolerance in wolfberry. In addition, flavone plays a positive role in resistance to salinity stress in wolfberry.
Keywords: Abscisic acid; Flavone; Flavonoid; Lycium. Chinese; Lycium. Ruthenicum; Salinity stress; Wolfberry.
© 2021. The Author(s).
Conflict of interest statement
The authors declare that they have no competing interests.
Figures


Similar articles
-
Transcriptomic and metabolomic analyses of Lycium ruthenicum and Lycium barbarum fruits during ripening.Sci Rep. 2020 Mar 9;10(1):4354. doi: 10.1038/s41598-020-61064-5. Sci Rep. 2020. PMID: 32152358 Free PMC article.
-
Integrated Metabolome and Transcriptome during Fruit Development Reveal Metabolic Differences and Molecular Basis between Lycium barbarum and Lycium ruthenicum.Metabolites. 2023 May 23;13(6):680. doi: 10.3390/metabo13060680. Metabolites. 2023. PMID: 37367839 Free PMC article.
-
Comparative transcriptome analysis of two contrasting wolfberry genotypes during fruit development and ripening and characterization of the LrMYB1 transcription factor that regulates flavonoid biosynthesis.BMC Genomics. 2020 Apr 10;21(1):295. doi: 10.1186/s12864-020-6663-4. BMC Genomics. 2020. PMID: 32272876 Free PMC article.
-
Isolation, structure and biological activity of polysaccharides from the fruits of Lycium ruthenicum Murr: A review.Carbohydr Polym. 2022 Sep 1;291:119618. doi: 10.1016/j.carbpol.2022.119618. Epub 2022 May 13. Carbohydr Polym. 2022. PMID: 35698413 Review.
-
Biomolecular and Clinical Aspects of Chinese Wolfberry.In: Benzie IFF, Wachtel-Galor S, editors. Herbal Medicine: Biomolecular and Clinical Aspects. 2nd edition. Boca Raton (FL): CRC Press/Taylor & Francis; 2011. Chapter 14. In: Benzie IFF, Wachtel-Galor S, editors. Herbal Medicine: Biomolecular and Clinical Aspects. 2nd edition. Boca Raton (FL): CRC Press/Taylor & Francis; 2011. Chapter 14. PMID: 22593925 Free Books & Documents. Review.
Cited by
-
Combined analysis of inorganic elements and flavonoid metabolites reveals the relationship between flower quality and maturity of Sophora japonica L.Front Plant Sci. 2023 Nov 17;14:1255637. doi: 10.3389/fpls.2023.1255637. eCollection 2023. Front Plant Sci. 2023. PMID: 38046598 Free PMC article.
-
Physiological, biochemical, and transcriptomic analyses reveal potential candidate genes of Platostoma palustre in response to salt stress.BMC Plant Biol. 2025 Jul 3;25(1):848. doi: 10.1186/s12870-025-06858-3. BMC Plant Biol. 2025. PMID: 40610913 Free PMC article.
-
High-quality genome of black wolfberry (Lycium ruthenicum Murr.) provides insights into the genetics of anthocyanin biosynthesis regulation.Hortic Res. 2024 Oct 23;12(2):uhae298. doi: 10.1093/hr/uhae298. eCollection 2025 Feb. Hortic Res. 2024. PMID: 39949881 Free PMC article.
-
The chromosome-scale genome of black wolfberry (Lycium ruthenicum) provides useful genomic resources for identifying genes related to anthocyanin biosynthesis and disease resistance.Plant Divers. 2025 Jan 6;47(2):201-213. doi: 10.1016/j.pld.2025.01.001. eCollection 2025 Mar. Plant Divers. 2025. PMID: 40182488 Free PMC article.
-
Correction to: Metabolomic and transcriptomic analysis of Lycium chinese and L. ruthenicum under salinity stress.BMC Plant Biol. 2022 Jan 24;22(1):50. doi: 10.1186/s12870-022-03436-9. BMC Plant Biol. 2022. PMID: 35073875 Free PMC article. No abstract available.
References
-
- FAO. The state of the world’s land and water resources for food and agriculture (SOLAW)—managing systems at risk. Food and Agriculture Organization of the United Nations and Earthscan. London: Rome and Earthscan; 2011. http://www.fao.org/ag/agl/agll/spush.
-
- Wegner LH, Stefano G, Shabala L, Rossi M, Mancuso S, Shabala S. Sequential depolarization of root cortical and stelar cells induced by an acute salt shock implications for Na+ and K+ transport into xylem vessels. Plant Cell Environ. 2011;34:859–869. - PubMed
-
- Cheeseman JM. The integration of activity in saline environments: problems and perspectives. Funct Plant Biol. 2013;40:759–774. - PubMed
-
- Benito B, Haro R, Amtmann A, Cuin TA, Dreyer I. The twins K+ and Na+ in plants. J Plant Physiol. 2014;171:723–731. - PubMed
-
- Wu HH, Zhang XC, Giraldo JP, Shabala S. It is not all about sodium: revealing tissue specificity and signalling roles of potassium in plant responses to salt stress. Plant Soil. 2018;431:1–17.
MeSH terms
LinkOut - more resources
Full Text Sources
