Sweep imaging with Fourier transform as a tool with MRI for evaluating the effect of teriparatide on cortical bone formation in an ovariectomized rat model
- PMID: 34980094
- PMCID: PMC8725572
- DOI: 10.1186/s12891-021-04970-7
Sweep imaging with Fourier transform as a tool with MRI for evaluating the effect of teriparatide on cortical bone formation in an ovariectomized rat model
Abstract
Background: Teriparatide (TPTD) is a drug for osteoporosis that promotes bone formation and improves bone quality. However, the effects of TPTD on cortical bone are not well understood. Sweep imaging with Fourier transform (SWIFT) has been reported as a useful tool for evaluating bound water of cortical bone, but it has yet to be used to investigate the effects of TPTD on cortical bone. This study aimed to evaluate the consequences of the effect of TPTD on cortical bone formation using SWIFT.
Methods: Twelve-week-old female Sprague-Dawley rats (n = 36) were reared after ovariectomy to create a postmenopausal osteoporosis model. They were divided into two groups: the TPTD and non-TPTD groups. Rats were euthanized at 4, 12, and 24 weeks after initiating TPTD treatment. Tibial bones were evaluated using magnetic resonance imaging (MRI) and bone histomorphometry. In MRI, proton density-weighted imaging (PDWI) and SWIFT imaging were performed. The signal-to-noise ratio (SNR) was calculated for each method. The same area evaluated by MRI was then used to calculate the bone formation rate by bone histomorphometry. Measurements were compared using the Mann-Whitney U-test, and a P-value of < 0.05 was considered significant.
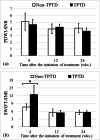
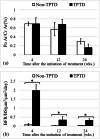
Results: PDWI-SNR was not significantly different between the two groups at any time point (P = 0.589, 0.394, and 0.394 at 4, 12, and 24 weeks, respectively). Contrarily, SWIFT-SNR was significantly higher in the TPTD group than in the non-TPTD group at 4 weeks after initiating treatment, but it was not significantly different at 12 and 24 weeks (P = 0.009, 0.937, and 0.818 at 4, 12, and 24 weeks, respectively). The bone formation rate assessed by histomorphometry was significantly higher in the TPTD group than in the non-TPTD group at all timepoints (P < 0.05, all weeks). In particular, at 4 weeks, the bone formation rate was markedly higher in the TPTD group than in the non-TPTD group (P = 0.028, 1.98 ± 0.33 vs. 0.09 ± 0.05 μm3/μm2/day).
Conclusions: SWIFT could detect increased signals of bound water, reflecting the effect of TPTD on the cortical bone. The signal detected by SWIFT reflects a marked increase in the cortical bone formation rate.
Keywords: Osteoporosis; Sweep imaging with Fourier transform; Teriparatide.
© 2021. The Author(s).
Conflict of interest statement
The authors declare that they have no competing interests.
Figures


References
-
- NIH Consensus Development Panel on Osteoporosis Prevention, Diagnosis, and Therapy. Osteoporosis prevention, diagnosis, and therapy. JAMA. 2001;285(6):785-95. - PubMed
-
- Fujita T, Inoue T, Morii H, Morita R, Norimatsu H, Orimo H, et al. Effect of an intermittent weekly dose of human parathyroid hormone (1-34) on osteoporosis: a randomized double-masked prospective study using three dose levels. Osteoporos Int. 1999;9:296–306. doi: 10.1007/s001980050151. - DOI - PubMed
MeSH terms
Substances
LinkOut - more resources
Full Text Sources

