. 2022 Jan 3;23(1):2.
doi: 10.1186/s13059-021-02569-8.

Assessing reproducibility of inherited variants detected with short-read whole genome sequencing

Affiliations

Assessing reproducibility of inherited variants detected with short-read whole genome sequencing

Bohu Pan et al. Genome Biol. .

Abstract

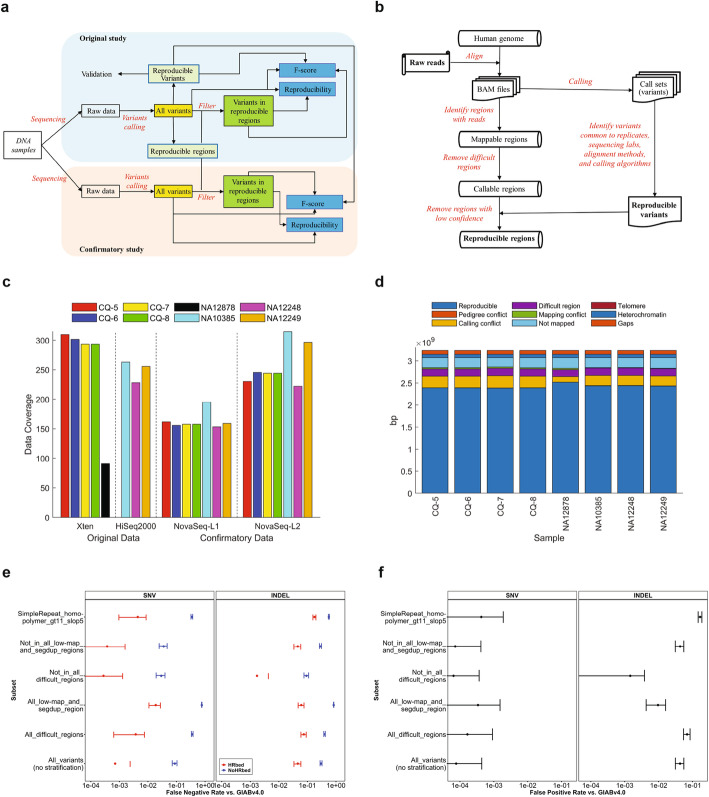
Background: Reproducible detection of inherited variants with whole genome sequencing (WGS) is vital for the implementation of precision medicine and is a complicated process in which each step affects variant call quality. Systematically assessing reproducibility of inherited variants with WGS and impact of each step in the process is needed for understanding and improving quality of inherited variants from WGS.

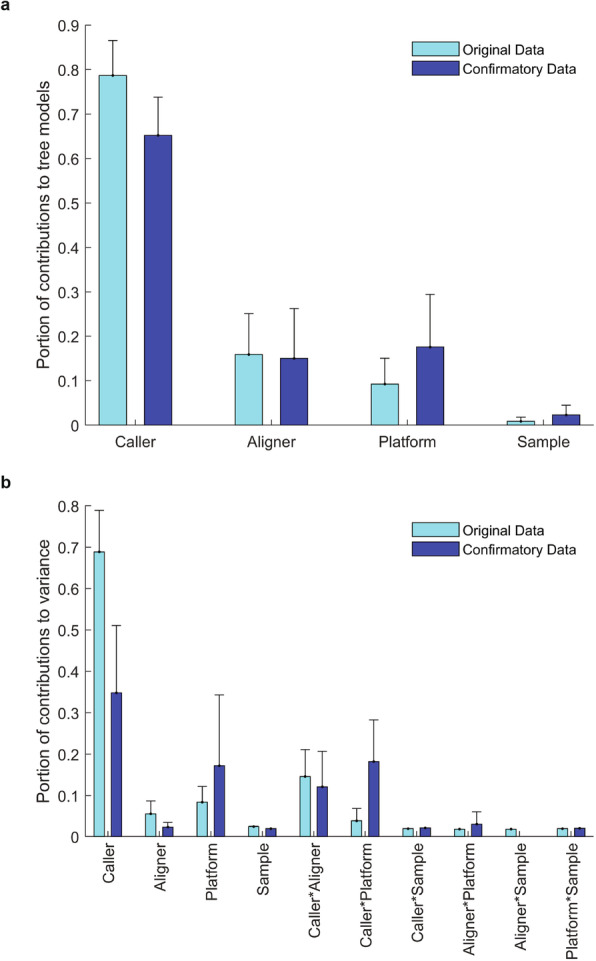
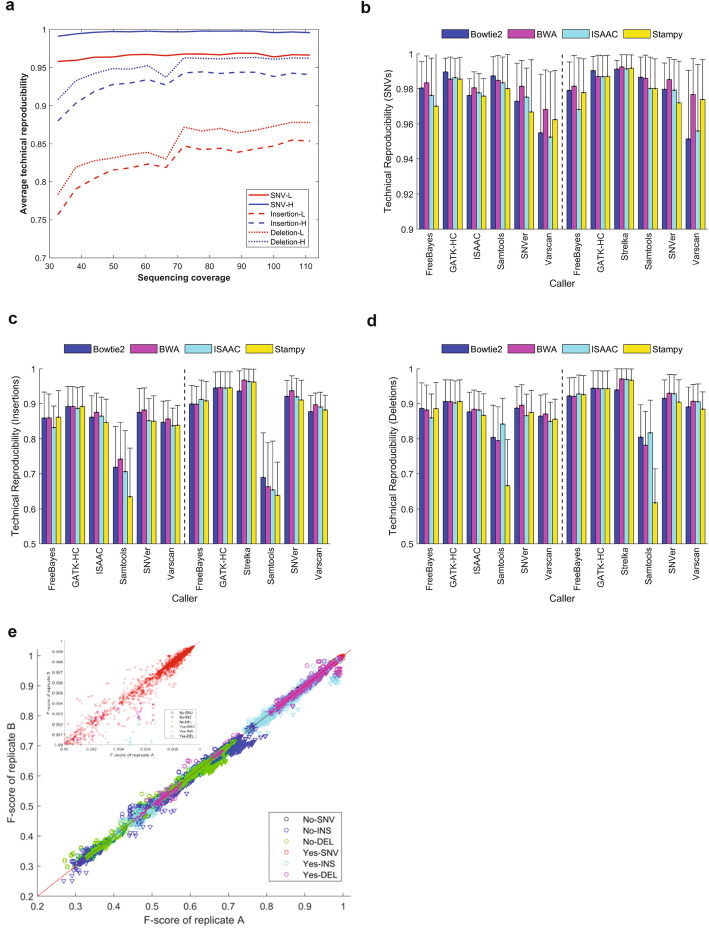
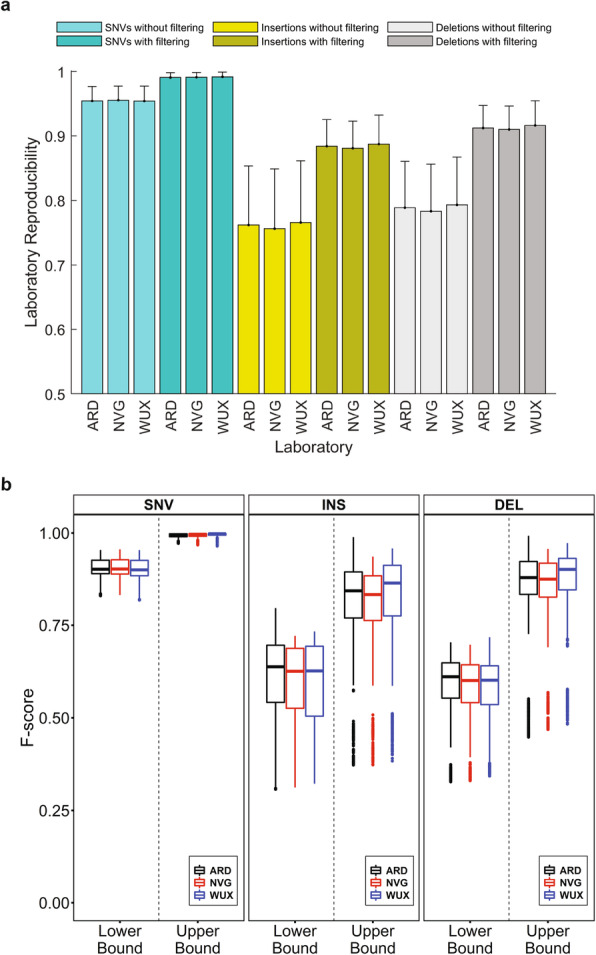
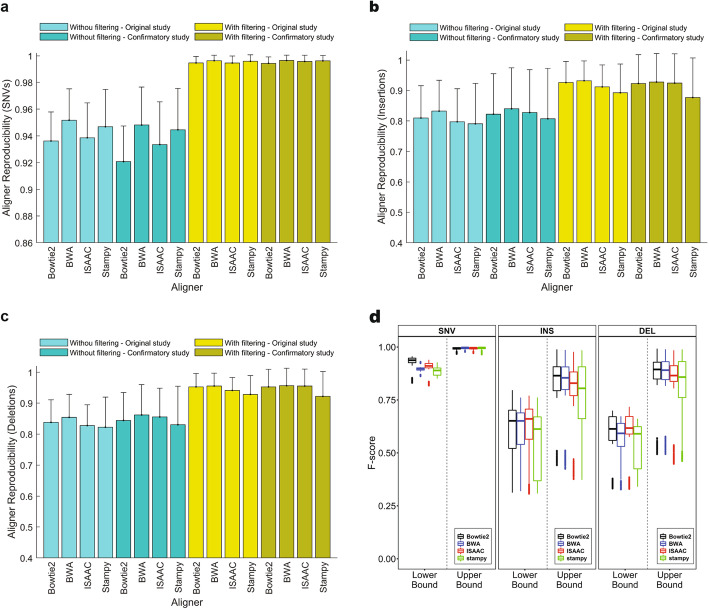
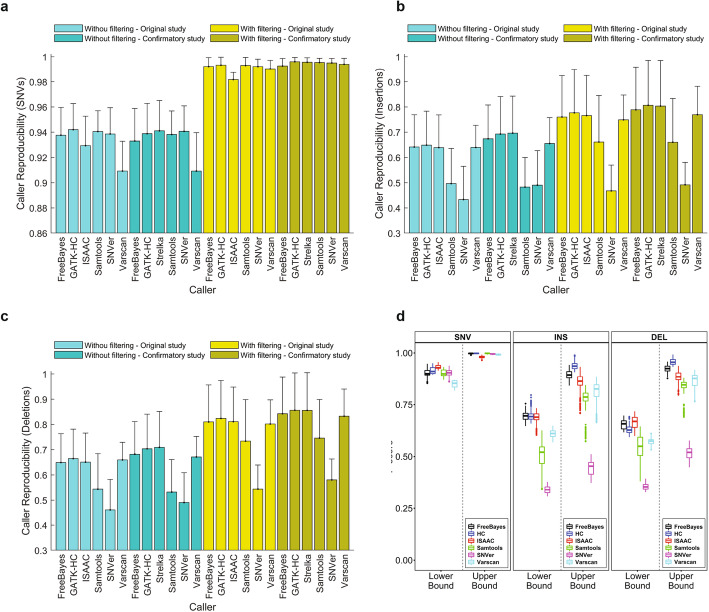
Results: To dissect the impact of factors involved in detection of inherited variants with WGS, we sequence triplicates of eight DNA samples representing two populations on three short-read sequencing platforms using three library kits in six labs and call variants with 56 combinations of aligners and callers. We find that bioinformatics pipelines (callers and aligners) have a larger impact on variant reproducibility than WGS platform or library preparation. Single-nucleotide variants (SNVs), particularly outside difficult-to-map regions, are more reproducible than small insertions and deletions (indels), which are least reproducible when > 5 bp. Increasing sequencing coverage improves indel reproducibility but has limited impact on SNVs above 30×.

Conclusions: Our findings highlight sources of variability in variant detection and the need for improvement of bioinformatics pipelines in the era of precision medicine with WGS.


Conflict of interest statement

The authors declare that they have no competing interests.

Figures

Fig. 1
Fig. 1
Study design and highly reproducible regions (HRR). a Study design. The DNA samples are from the Chinese quartet, the HapMap trio, and NA12878. WGS was conducted on the samples using different platforms and library preparation kits in multiple labs in the original study (light blue background) and confirmatory study (light brown background). Various variant calling pipelines were employed to generate variants (yellow boxes) from the raw sequence data. The variants were leveraged to define the HRR and pinpoint HRVs (light green boxes). Reproducibility (blue boxes) was analyzed for both all variants and the variants only in HRR (green boxes) in both original and confirmatory studies. The variants with and without HRR-filtering were compared with the HRVs to calculate F-scores (blue boxes), which were used to evaluate reproducibility from a different angle. b Process for defining HRR. All alignment results for the same sample were first examined to find the genomic regions that have sequence reads mapped. Difficult regions such as repeats were then removed to form the callable regions. At last, the HRVs obtained from comparative analysis on all call sets were used to remove the low confidence calling regions from the callable regions, resulting the HRR. c Data generated. Sequencing data coverage is on the y-axis for DNA samples. Original and confirmatory data sets are separated with the vertical solid line and depicted with the x-axis label. The four Illumina sequencing platforms are separated with the vertical dashed lines and marked on the x-axis ticks where L1 indicates the Nextera DNA Flex library preparation kit and L2 is the TruSeq DNA PCR-Free Library Prep Kit. The color legend indicates samples. d Sizes (y-axis) of HRR (dark blue bars) for the 8 samples (x-axis). The color legend shows the excluded genomic regions, including gap region (dark brown) not in GRCh38, heterochromatin (blue) for condensed DNA labeled as N in the reference, telomere (dark purple) for repeat sequence at the end of the chromosome, not mapped region (light blue), mapping conflict region (green), difficult region (purple) for repeat regions (“SimpleRepeat_imperfecthomopolgt10_slop5.BED” and “remapped_superdupsmerged_all_sort.BED”) defined by GA4GH and GIAB, calling conflict region (yellow) for the flanking region of discordant variants, and pedigree conflict region (brown). e False negative rates (FN/(TP + FN)) of HRVs for NA12878 against the GIAB v4.0 benchmark set and stratified by genome context for SNVs (the left panel) and indels (the right panel) in the entire v4.0 benchmark regions (blue) and confined to the HRR (red). Error bars indicate 95% confidence intervals. f False positive rates (FP/(TP + FP)) of HRVs stratified by genome context in the entire v4.0 benchmark regions. Error bars indicate 95% confidence intervals
Fig. 2
Fig. 2
Impacts of factors on variant reproducibility. a Contributions to gradient boosted trees. The four factors are depicted at the x-axis and portions of their contributions to the non-linear gradient boosted tree models are the light blue bars for the original study and are the dark blue bars for the confirmatory study. The error bars are the standard deviations of the portions from different data sets (Additional file 14, Table S13). b Contributions to reproducibility in variance. The contributions of the four factors as well as their 2-way interactions (depicted at x-axis) from variance components analysis are plotted as light blue bars for the original study and dark blue bars for the confirmatory study. The error bars are standard deviations of the portions from different data sets (Additional file 15, Table S14)
Fig. 3
Fig. 3
Technical reproducibility. a Impact of sequencing coverage on technical reproducibility. Average technical reproducibility (y-axis) of detected variants is plotted against the sequencing coverage (x-axis). Line types indicate variant types (SNVs: solid lines, insertion: dash lines, deletion: dot line). Red lines represent upper bounds of technical reproducibility and blue lines are lower bounds of technical reproducibility. b,c,d Technical reproducibility across aligners and callers for SNVs (b), insertions (c), and deletions (d). The average technical reproducibility of variants for pairs of callers (x-axis) and aligners (color legend) are plotted as bars with their standard deviation as sticks. The left panels give the results from the original data and the right panels show the results from the confirmatory data. e F-scores of technical replicates. The F-scores from one technical replicate (x-axis) are plotted against the F-scores from another technical replicate (y-axis). The marker colors represent types of variants indicated at the right bottom corner with two-word text. The first indicates HRR filtering (Yes and No) and the second for variant type (SNV: SNVs, INS: insertions, DEL: deletions). The downward triangles represent the F-scores from the original study, while the circles mark the F-scores from the confirmatory study. The inserted figure at top left is a zoom-in of the F-score > 0.99 region
Fig. 4
Fig. 4
Lab reproducibility. a Lab reproducibility of the Chinese quartet samples in the original study. The bars represent average values of lab reproducibility and the error sticks indicate standard deviations. The x-axis ticks depict sequencing labs. The color legend represents variant types and HRR filtering status. b Boxplots of F-scores for SNVs (left panel), insertions (middle panel), and deletions (right panel). Results from the three labs are plotted in different colors: black for ARD (Annoroad), red for WUX (WuXi NextCODE), and blue for NVG (NovoGene). F-scores from the lower bound and upper bound of variants are separated and marked at x-axis
Fig. 5
Fig. 5
Aligner reproducibility. a Aligner reproducibility of SNVs. b Aligner reproducibility of insertions. c Aligner reproducibility of deletions. The bars represent average values of aligner reproducibility for the four aligners depicted by the x-axis ticks. The error sticks show standard deviation. The color legend specifies if variants were filtered by HRR or not as well as if the data are from original or confirmatory studies. d Boxplots of F-scores for SNVs (left panel), insertions (middle panel), and deletions (right panel). Results from the four aligners are plotted in different colors: black for Bowtie2, blue for BWA, red for ISAAC, and green for Stampy. F-scores from the lower bound and upper bound of variants are separated and marked at the x-axis
Fig. 6
Fig. 6
Caller reproducibility. a Caller reproducibility of SNVs. b Caller reproducibility of insertions. c Caller reproducibility of deletions. The bars represent average values of caller reproducibility for the six callers depicted at the x-axis ticks. The error sticks above the bars represent standard deviations. The color legend specifies if variants were filtered by HRR or not as well as data are from original or confirmatory studies. d Boxplots of F-scores for SNVs (left panel), insertions (middle panel), and deletions (right panel). Results from the six callers are plotted in different colors: black for FreeBayes, blue for HC, red for ISAAC, green for Samtools, magenta for SNVer, and cyan for VarScan. F-scores from the lower bound and upper bound of variants are separated and marked at the x-axis

References

    1. Cheng DT, Prasad M, Chekaluk Y, Benayed R, Sadowska J, Zehir A, Syed A, Wang YE, Somar J, Li Y, Yelskaya Z, Wong D, Robson ME, Offit K, Berger MF, Nafa K, Ladanyi M, Zhang L. Comprehensive detection of germline variants by MSK-IMPACT, a clinical diagnostic platform for solid tumor molecular oncology and concurrent cancer predisposition testing. BMC Med Genomics. 2017;10(1):33. doi: 10.1186/s12920-017-0271-4. - DOI - PMC - PubMed
    1. Smith IN, Thacker S, Seyfi M, Cheng F, Eng C. Conformational dynamics and allosteric regulation landscapes of germline PTEN mutations associated with autism compared to those associated with cancer. Am J Hum Genet. 2019;104(5):861–878. doi: 10.1016/j.ajhg.2019.03.009. - DOI - PMC - PubMed
    1. Din S, Wong K, Mueller MF, Oniscu A, Hewinson J, Black CJ, Miller ML, Jimenez-Sanchez A, Rabbie R, Rashid M, et al. Mutational analysis identifies therapeutic biomarkers in inflammatory bowel disease-associated colorectal cancers. Clin Cancer Res. 2018;24(20):5133–5142. doi: 10.1158/1078-0432.CCR-17-3713. - DOI - PMC - PubMed
    1. Haapaniemi EM, Kaustio M, Rajala HL, van Adrichem AJ, Kainulainen L, Glumoff V, Doffinger R, Kuusanmaki H, Heiskanen-Kosma T, Trotta L, et al. Autoimmunity, hypogammaglobulinemia, lymphoproliferation, and mycobacterial disease in patients with activating mutations in STAT3. Blood. 2015;125(4):639–648. doi: 10.1182/blood-2014-04-570101. - DOI - PMC - PubMed
    1. Wright GEB, Collins JA, Kay C, McDonald C, Dolzhenko E, Xia Q, Becanovic K, Drogemoller BI, Semaka A, Nguyen CM, et al. Length of uninterrupted CAG, independent of polyglutamine size, results in increased somatic instability, hastening onset of Huntington disease. Am J Hum Genet. 2019;104(6):1116–1126. doi: 10.1016/j.ajhg.2019.04.007. - DOI - PMC - PubMed

Publication types

LinkOut - more resources