. 2022 Jan;54(1):18-29.
doi: 10.1038/s41588-021-00969-x. Epub 2022 Jan 3.

Genetic variation influencing DNA methylation provides insights into molecular mechanisms regulating genomic function

Collaborators, Affiliations

Genetic variation influencing DNA methylation provides insights into molecular mechanisms regulating genomic function

Johann S Hawe et al. Nat Genet. 2022 Jan.

Abstract

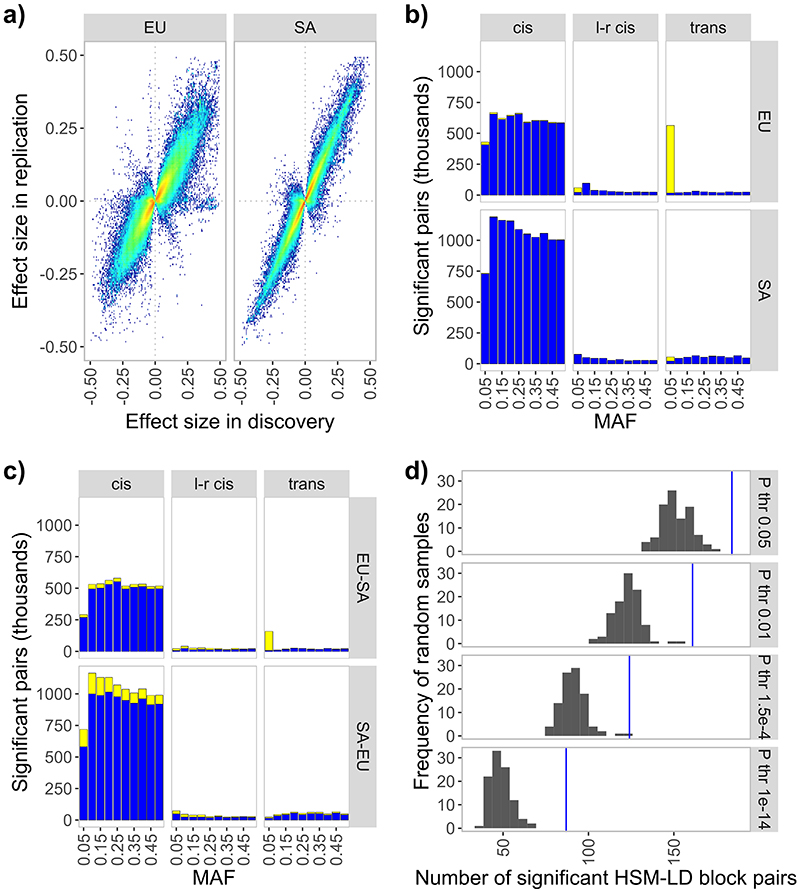
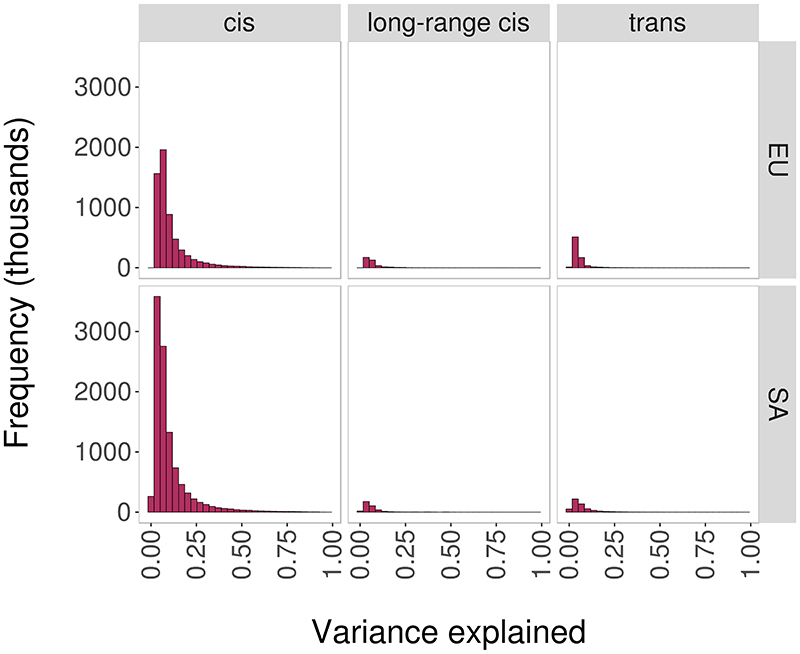
We determined the relationships between DNA sequence variation and DNA methylation using blood samples from 3,799 Europeans and 3,195 South Asians. We identify 11,165,559 SNP-CpG associations (methylation quantitative trait loci (meQTL), P < 10-14), including 467,915 meQTL that operate in trans. The meQTL are enriched for functionally relevant characteristics, including shared chromatin state, High-throuhgput chromosome conformation interaction, and association with gene expression, metabolic variation and clinical traits. We use molecular interaction and colocalization analyses to identify multiple nuclear regulatory pathways linking meQTL loci to phenotypic variation, including UBASH3B (body mass index), NFKBIE (rheumatoid arthritis), MGA (blood pressure) and COMMD7 (white cell counts). For rs6511961 , chromatin immunoprecipitation followed by sequencing (ChIP-seq) validates zinc finger protein (ZNF)333 as the likely trans acting effector protein. Finally, we used interaction analyses to identify population- and lineage-specific meQTL, including rs174548 in FADS1, with the strongest effect in CD8+ T cells, thus linking fatty acid metabolism with immune dysregulation and asthma. Our study advances understanding of the potential pathways linking genetic variation to human phenotype.


Conflict of interest statement

Competing Interests

The authors declare no competing interests.

Figures

Extended Data Figure 1
Extended Data Figure 2
Extended Data Figure 3
Extended Data Figure 4
Extended Data Figure 5
Extended Data Figure 6
Extended Data Figure 7
Extended Data Figure 8
Extended Data Figure 9
Extended Data Figure 10
Figure 1
Figure 1. Summary of results for genome-wide association and replication testing.
1a. Chessboard plot. Each dot represents a unique SNP-CpG pair reaching genome-wide significance in discovery (P<10-14) and showing both ancestry specific and cross-ancestry replication. CpG position and background CpG density (450K array) are annotated on the x-axis, and SNP position and background SNP density are annotated on the y-axis. SNP-CpG pairs are colour coded according to proximity of SNP and CpG: cis – within 1Mb (N=10,346,172, green markers appearing as a diagonal line); long-range cis – distance >1Mb but on the same chromosome (N=351,472, purple markers); trans – SNP and CpG are on different chromosomes (N=467,915, black markers). 1b. Manhattan plot of trans-acting SNP-CpG associations. Each marker represents the number of CpG sites associated in trans with the identified trans-acting SNPs. Results are for the cosmopolitan set of SNP-CpG pairs showing both ancestry specific and cross-ancestry replication. SNPs with the highest number of CpGs in trans (top 1%) are highlighted in black and the gene nearest the sentinel SNP is displayed.
Figure 2
Figure 2. Replication in isolated white cells, isolated adipocytes, and adipose tissue.
Density plot summarising replication of the SNP-CpG pairs identified by genome-wide association. Rows i-iv. four isolated white cell subsets (CD4+ lymphocytes, CD8+ lymphocytes, neutrophils and monocytes), rows v-vi. isolated visceral and subcutaneous adipocytes and row vii. whole adipose tissue. Results are presented as the effect size (change in methylation, on 0-1 scale where 1 represents 100% methylation) per allele copy of the identified SNP in whole blood (x-axis) and in the respective isolated cell type (y-axis), stratified by SNP-CpG proximity (cis, long-range cis, and trans associations). Plotting area is limited to effect sizes between -0.5 and 0.5. Results show highly concordant effect sizes between whole blood and each cell type. Inset in each panel are replication rates in the respective cell type (‘Rep’: P<0.05 and same direction of effect), as well as percent of directional consistency between effect sizes (‘Dir’).
Figure 3
Figure 3. Candidate genes for sentinel SNPs that are associated with trans-CpG sites which overlap transcription factor binding sites.
Panel 3a shows the evidence for each candidate: i. genes that are transcription factors in cis, and which overlap the trans-CpG signatures (‘enriched cis-TF’); ii. genes selected by the random walk analysis including protein-protein interactions (‘PPI’), and iii. genes that are cis-eQTL for the sentinel SNPs. The heatmap in panel 3b shows the percentage of associated CpG sites with trans-eQTM at each locus (x-axis). The heatmap in panel 3c shows the enrichment or depletion of binding of transcription factors (y-axis) at the associated CpG sites of each locus (x-axis). Odds ratios comparing the frequency of state annotations at associated CpGs with background CpGs are colour coded. Odds ratios greater than 10 or less than 0.1 have been set to 10 or 0.1 for improved readability of the colour scale. Odds ratios greater than 1 indicate enrichment, while odds ratios less than 1 indicate depletion.
Figure 4
Figure 4. Regulatory networks and locus colocalisation analyses.
Panels 4A through 4D show the identified random walk networks and results for the individual colocalisation analyses for the NFKBIE, MGA, COMMD7 and SENP7 loci, respectively. The networks illustrate the connections between the genotype at SNPs (yellow rectangle), the identified candidate genes (yellow ellipse), which are connected through a network of protein-protein and protein-DNA interactions to methylation at the trans-associated CpG sites (beige rectangles), and the expression of genes encoded at the CpG sites. Ellipses represent genes: i. encoded at the genetic locus identified by the sentinel and prioritised by the random walk (yellow fill), ii. encoded at the CpG loci (beige border) or iii. part of the protein-protein interaction network (black border). For genes in the protein-protein interaction network, the fill colour of ellipses represents the random walk score as indicated in the colour bar legend. Edges connecting genes, SNPs and CpG sites represent: i. protein-protein interactions, ii. protein-DNA interactions identified by TFBS overlap and iii. genomic proximity (<1Mb). Bold edges indicate significant correlation with gene expression. Other plots show the i. GWAS signal (-log10(P)) and ii. colocalisation signal (mean per-SNP colocalisation probability (mean SCP) over all trans CpGs) on the y-axis for available SNPs in the genomic region around the respective genetic loci (x-axis). Colouring of individual SNPs indicates LD (R^2) to the lead SNP in the locus.
Figure 5
Figure 5. Experimental evaluation of ZNF333 by ChIP-seq.
5a. Regional plot illustrating the overlap of the trans-CpG signature for SNP rs6511961, with the ChIP-seq signature for ZNF333. Upper panel shows the -log10(P-value) (y-axis) of the association of each CpG site in the region (genomic position on the x-axis) to the trans-acting SNP rs6511961. The lead CpG associated with rs6511961 is identified by a diamond; colour coding of other CpGs at locus (circles) describes their correlation (r) with the lead CpG. The middle panel shows genomic coordinates of binding sites of ZNF333 identified by ChIP-seq as purple boxes. The lower panel shows the gene annotation (exons: blue boxes, introns: blue lines). 5b. Venn diagram showing the overlap between binding sites from biological replicates of ZNF333 ChIP-seq using either FLAG or Myc antibodies. 5c. Circos plot summarising i. the genomic distribution of CpGs associated in trans [inner connections] with rs6511961 at the ZNF333 locus, and ii. the DNA binding sites of ZNF333 identified by ChIP-seq studies (green bars). 5d. The observed and expected proportions of CpG sites that overlap ZNF333 DNA binding sites (interval size around peak of 500bp), compared to the background frequency of all tested CpG sites. Significant enrichment is shown by permutation testing with matched background (see Methods). Enrichment is robust to selection of interval size around the peak: from 100bp (2.7 fold) to 1000bp (4.5 fold).
Figure 6
Figure 6. White-cell iQTLs.
6a. Plot shows replication of effect sizes of significant iQTL (CD8T) between KORA and LOLIPOP cohorts. Axes indicate genotype:celltype interaction effect sizes, points show individual associations. 6b. Barplots indicate replication of iQTL in isolated cells. Y-axis shows the total number of associations and x-axis the respective cell-types. Dark blue areas indicate the proportion of replicating associations, light blue areas the proportion of non-replicating associations. 6c. ‘Volcano’ plots highlighting the enrichment of iQTL SNPs with GWAS information in diverse traits. Y-axis shows -log10 of the QTLenrich P-value, x-axis shows the log2 fold enrichment of observed GWAS SNP among iQTL compared to expected. Plots are split by analysed cell types. Points reflect individual GWAS studies, their colours the respective phenotype category. 6d. An example association plot for the rs174548-cg21709803 iQTL in KORA data, separated into individuals with ‘high’ and ‘low’ abundance (above and below median, respectively) of CD8T cells. Y-axis indicates methylation residuals, x-axis genotypes. Boxplots indicate medians (center lines), first and third quartiles (lower and upper box limits, respectively; whisker extents: 1.5-fold interquartile ranges). Points indicate outliers. 6e. Same association plot as in 6D, but using data from isolated cells (indicated by different shades of grey). 6f. Manhattan plot of meQTL, asthma GWAS and iQTL results for the selected iQTL example show colocalisation of association signals. X-axis indicates the genomic region around the rs174548 SNP, y-axis the -log10 of association P-values. Individual points represent SNPs in the locus.

References

    1. Bird A. Perceptions of epigenetics. Nature. 2007;447:396–8. - PubMed
    1. Schubeler D. Function and information content of DNA methylation. Nature. 2015;517:321–6. - PubMed
    1. Parry A, Rulands S, Reik W. Active turnover of DNA methylation during cell fate decisions. Nat Rev Genet. 2021;22:59–66. - PubMed
    1. Jaenisch R, Bird A. Epigenetic regulation of gene expression: how the genome integrates intrinsic and environmental signals. Nat Genet. 2003;33(Suppl):245–54. - PubMed
    1. Chambers JC, et al. Epigenome-wide association of DNA methylation markers in peripheral blood from Indian Asians and Europeans with incident type 2 diabetes: a nested case-control study. Lancet Diabetes Endocrinol. 2015;3:526–534. doi: 10.1016/S2213-8587(15)00127-8. - DOI - PMC - PubMed

Publication types