[Preprint]. 2021 Dec 21:2021.12.14.21267606.
doi: 10.1101/2021.12.14.21267606.

Context-specific emergence and growth of the SARS-CoV-2 Delta variant

Affiliations

Context-specific emergence and growth of the SARS-CoV-2 Delta variant

John T McCrone et al. medRxiv. .

Update in

  • Context-specific emergence and growth of the SARS-CoV-2 Delta variant.
    McCrone JT, Hill V, Bajaj S, Pena RE, Lambert BC, Inward R, Bhatt S, Volz E, Ruis C, Dellicour S, Baele G, Zarebski AE, Sadilek A, Wu N, Schneider A, Ji X, Raghwani J, Jackson B, Colquhoun R, O'Toole Á, Peacock TP, Twohig K, Thelwall S, Dabrera G, Myers R; COVID-19 Genomics UK (COG-UK) Consortium; Faria NR, Huber C, Bogoch II, Khan K, du Plessis L, Barrett JC, Aanensen DM, Barclay WS, Chand M, Connor T, Loman NJ, Suchard MA, Pybus OG, Rambaut A, Kraemer MUG. McCrone JT, et al. Nature. 2022 Oct;610(7930):154-160. doi: 10.1038/s41586-022-05200-3. Epub 2022 Aug 11. Nature. 2022. PMID: 35952712 Free PMC article.

Abstract

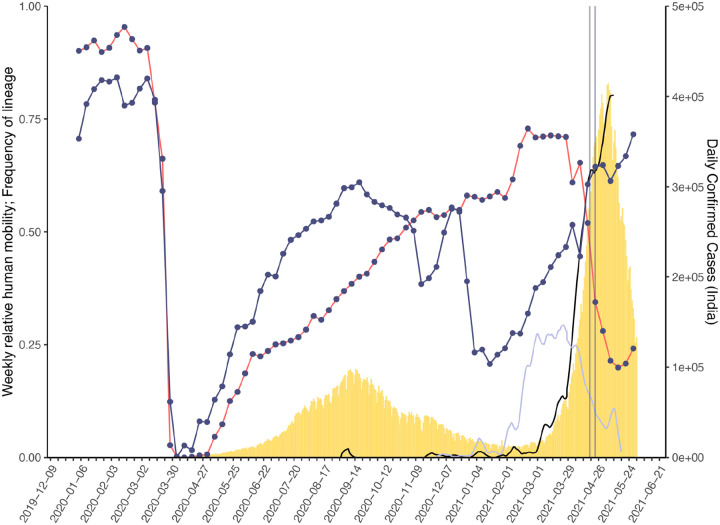
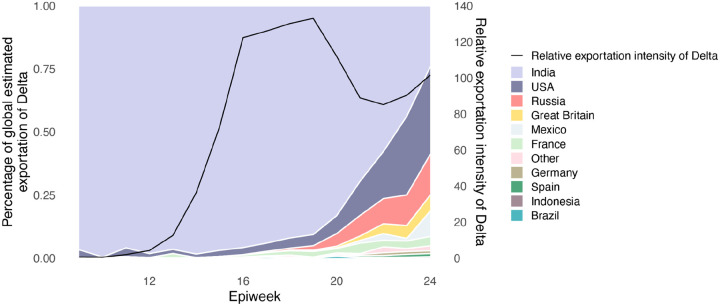
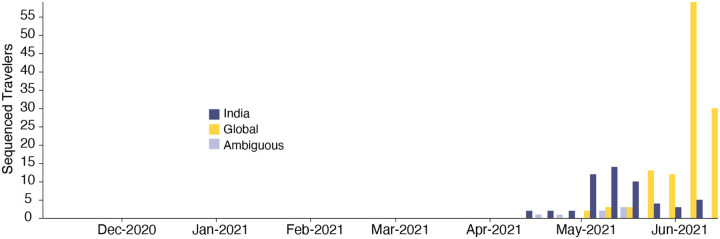
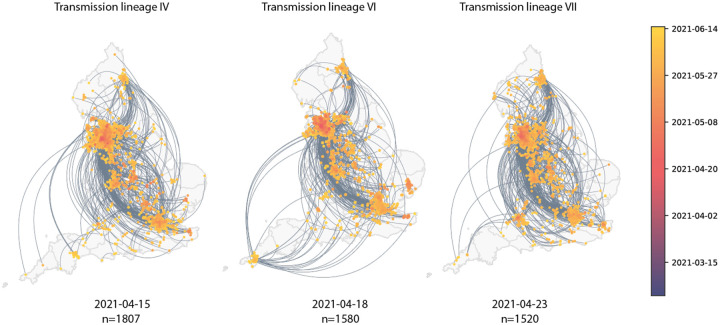
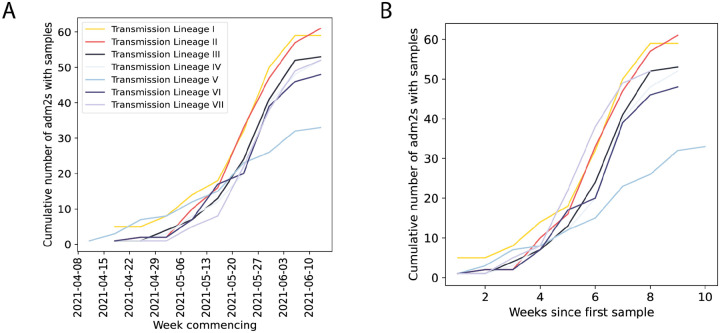
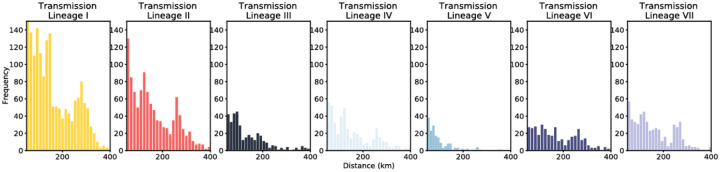
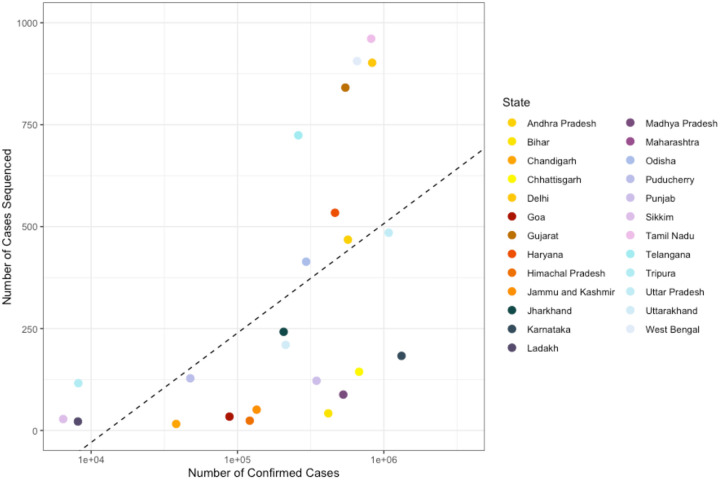
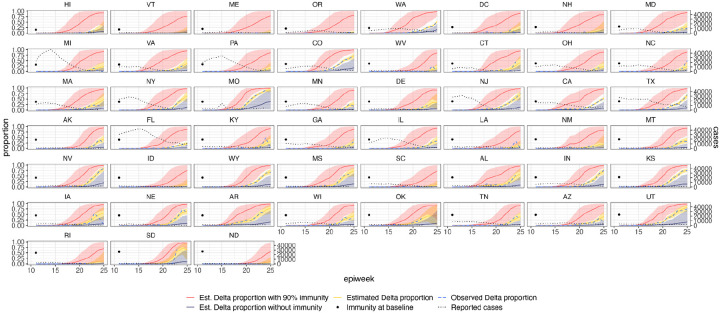
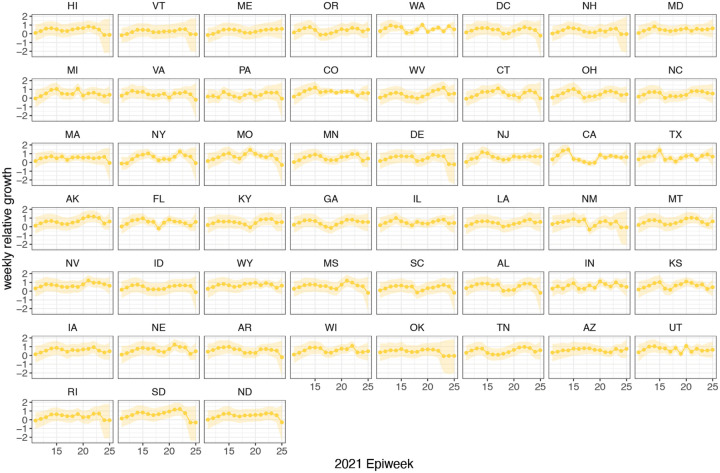
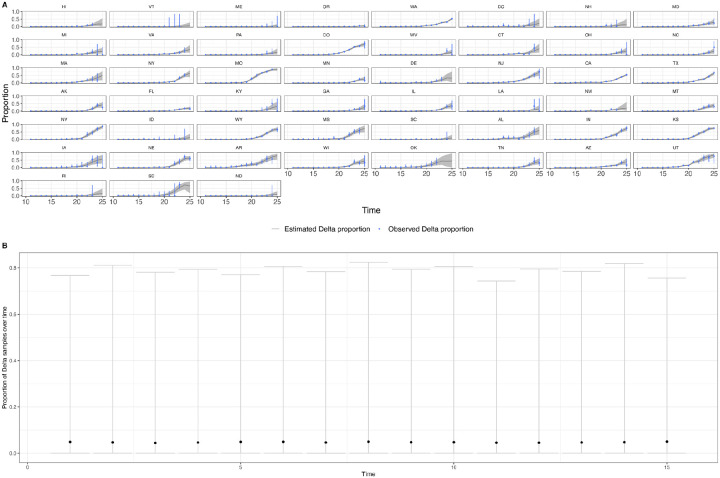
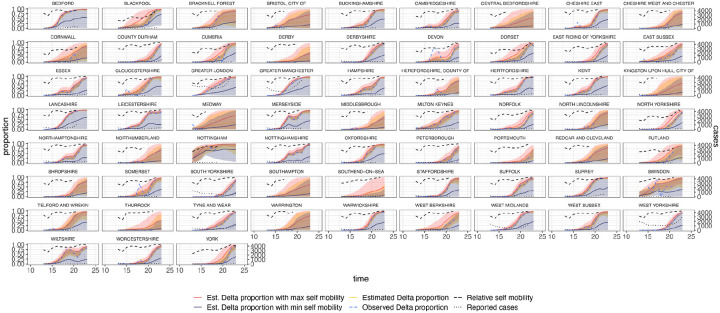
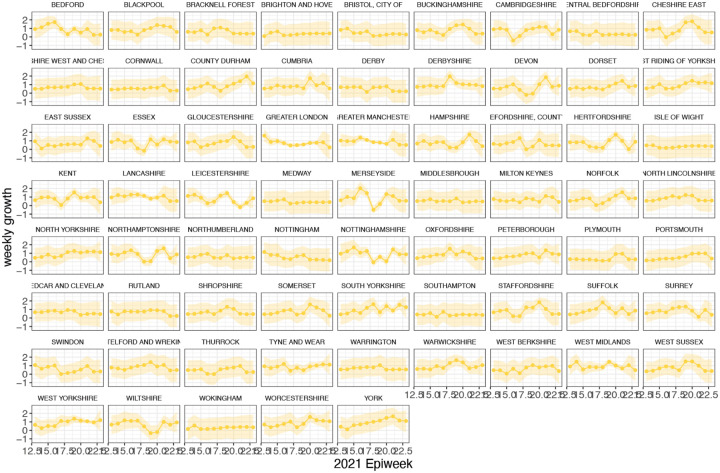
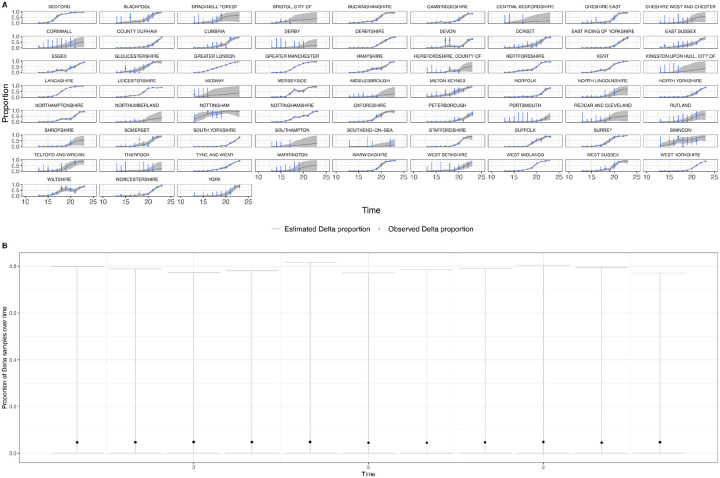
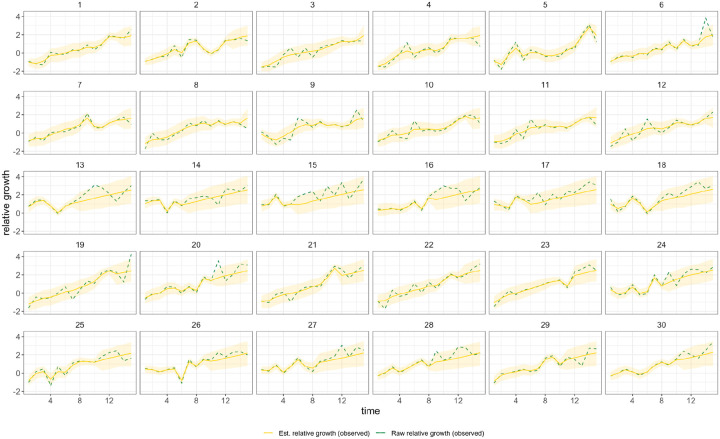
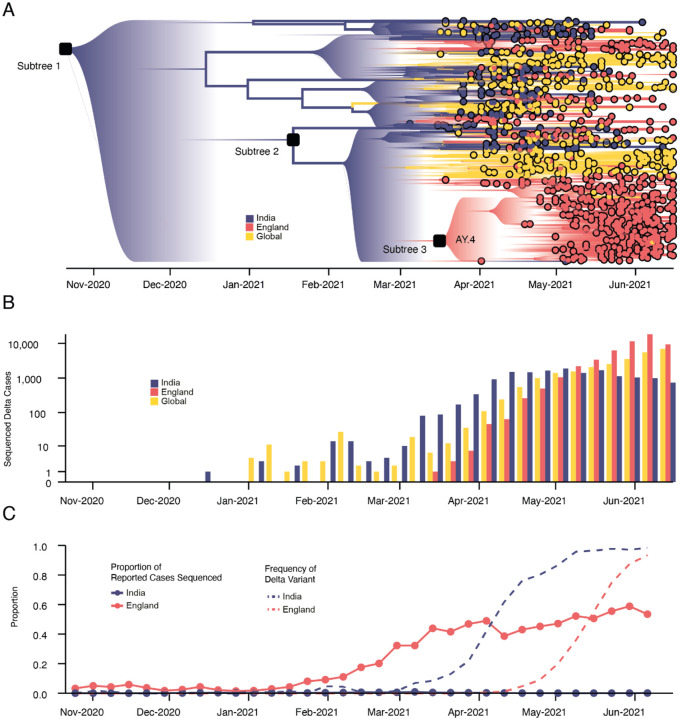
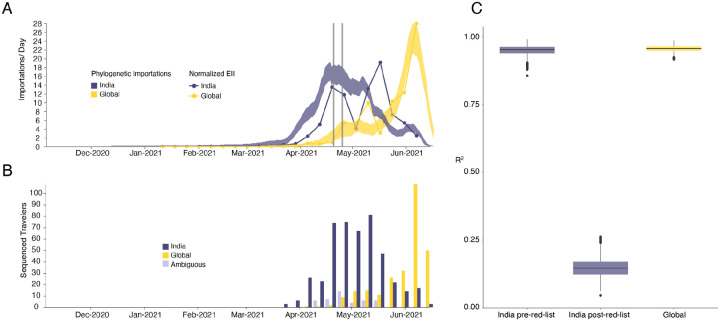
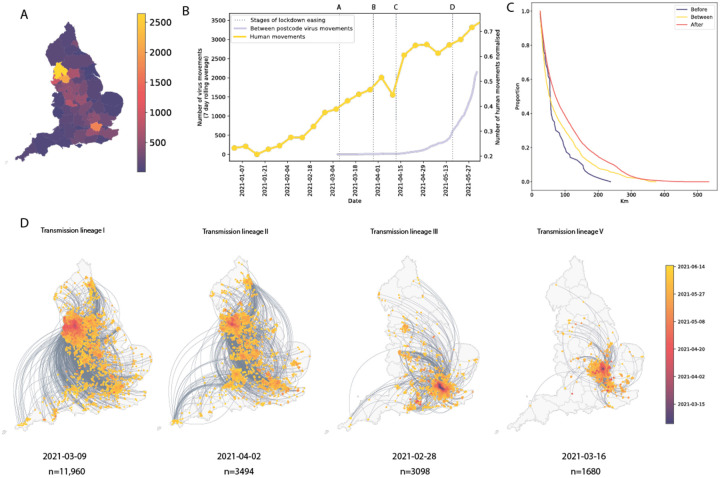
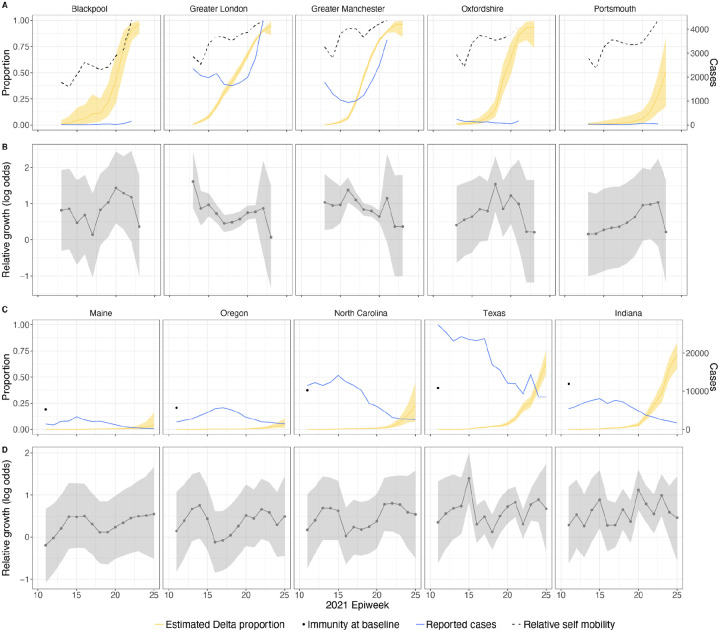
The Delta variant of concern of SARS-CoV-2 has spread globally causing large outbreaks and resurgences of COVID-19 cases 1-3 . The emergence of Delta in the UK occurred on the background of a heterogeneous landscape of immunity and relaxation of non-pharmaceutical interventions 4,5 . Here we analyse 52,992 Delta genomes from England in combination with 93,649 global genomes to reconstruct the emergence of Delta, and quantify its introduction to and regional dissemination across England, in the context of changing travel and social restrictions. Through analysis of human movement, contact tracing, and virus genomic data, we find that the focus of geographic expansion of Delta shifted from India to a more global pattern in early May 2021. In England, Delta lineages were introduced >1,000 times and spread nationally as non-pharmaceutical interventions were relaxed. We find that hotel quarantine for travellers from India reduced onward transmission from importations; however the transmission chains that later dominated the Delta wave in England had been already seeded before restrictions were introduced. In England, increasing inter-regional travel drove Delta's nationwide dissemination, with some cities receiving >2,000 observable lineage introductions from other regions. Subsequently, increased levels of local population mixing, not the number of importations, was associated with faster relative growth of Delta. Among US states, we find that regions that previously experienced large waves also had faster Delta growth rates, and a model including interactions between immunity and human behaviour could accurately predict the rise of Delta there. Delta's invasion dynamics depended on fine scale spatial heterogeneity in immunity and contact patterns and our findings will inform optimal spatial interventions to reduce transmission of current and future VOCs such as Omicron.


Figures

Extended Data Figure 1:
Daily number of reported SARS-CoV-2 cases (yellow bars, right hand axis) in India. Weekly human movements in England, relative to the maximum in England (dark blue line, left hand axis, Methods), and in India, relative to the maximum in India (red line, left hand axis, Methods). Proportion of genomes in India that are assigned to lineages B.1.617.2 (black line, no points) and B.1.617.1 (light blue line, no points) (left hand axis). First vertical line represents the announcement of the quarantine policy for arrivals of travellers from India to England (17 March 2021) and the second vertical line represents the date of implementation (23 March 2021).
Extended Data Figure 2:
Proportion of weekly Estimated Exportation Intensity (EEI) of Delta by country. See Methods for details of calculation (left y-axis). The black line represents the total EEI by week (right y-axis).
Extended Data Figure 3:
Temporal distribution of genomic isolates from the AY.4 sublineage with travel history, by the likely location of exposure.
Extended Data Figure 4:
Growth of transmission lineages in England for lineages observed for at least 3 weeks and with >100 genomes sampled in total. A) The log number of weekly sampled genomes per transmission lineage plotted over time. Lines represent a linear fit (assuming exponential growth). B) Distribution of growth rates (slopes in A). C) Quantile Quantile plot comparing the observed quantiles in the growth rate distribution to theoretical quantiles from a normal distribution.
Extended Data Figure 5:
Maps showing virus movements inferred using continuous phylogeographic analysis for the fourth, sixth and seventh largest transmission lineages. Direction of movement is anti-clockwise, and dots are coloured by date.
Extended Data Figure 6:
Cumulative number of UTLAs that the five largest Delta transmission lineages are sampled in absolute (A) and relative (B) time.
Extended Data Figure 7:
Histograms of the distance of viral movements over 50km for each of the largest seven Delta transmission lineages in England.
Extended Data Figure 8:
Scatter plot showing the number of confirmed cases per state in India vs. the number of cases sequenced in that state in India between 28th of November 2020 to the 16th of May 2021. In states above the line more than the mean number of cases were sequenced.
Extended Data Figure 9:
Estimated and observed proportions of Delta variant samples across US states (yellow and blue dashed respectively), counterfactual scenarios: no prior immunity (purple), 90% immunity from the beginning (red), and reported number of cases (grey dotted) and observed immunity levels at baseline (black dot). The light shaded regions represent the corresponding 95% Bayesian credible intervals.
Extended Data Figure 10:
Time-varying relative growth of Delta (on the log odds scale; Methods) for all US states. The light shaded regions represent the corresponding 95% Bayesian credible intervals.
Extended Data Figure 11:
a) Posterior predictive check plotting the observed and predicted proportion of Delta samples for US states. The grey area and blue vertical lines are the 95% Bayesian credible intervals for the observed and predicted proportions. b) Prior predictive check plotting the estimated proportion of Delta samples over time in a single region. The relatively low medians (black dots) indicate the prior assumption of an initially low proportion of Delta samples, and the wide intervals indicate how the priors are relatively uninformative of the Delta proportion.
Extended Data Figure 12:
Estimated and observed proportions of Delta variant samples across UTLAs in England (yellow and blue dashed respectively), for various counterfactual scenarios: minimum (purple) and maximum relative self mobility (red), observed relative self-mobility (black dashed), and number of reported cases (black dotted dashed). The light shaded regions represent the corresponding 95% Bayesian credible intervals.
Extended Data Figure 13:
Time-varying relative growth of Delta (on the log odds scale). The light shaded regions represent the corresponding 95% Bayesian credible intervals.
Extended Data Figure 14:
a) Posterior predictive check plotting the observed and predicted proportion of Delta samples for the UTLAs in England. The grey area and blue vertical lines are the 95% Bayesian credible intervals for the observed and predicted proportions. b) Prior predictive check plotting the estimated proportion of Delta samples over time in a single region. The relatively low medians (black dots) indicate the prior assumption of an initially low proportion of starting number of Delta samples, and the wide intervals indicate how the priors are relatively uninformative of the Delta proportion.
Extended Data Figure 15:
Simulation comparing known vs estimated relative growth rates (see Methods) for hypothetical locations.
Figure 1:
Figure 1:. Emergence and rapid geographic expansion of Delta:
a) Time-calibrated phylogenetic reconstruction of Delta based on 1,000 sequences subsampled from 93,649 sequences from 100 countries (52,992 from England). The tree was split in 3 subtrees (n=28,783, 28,715, and 36,151 sequences) prior to full analysis. The roots of these 3 subtrees, and of lineage AY.4 are labeled. Lineage colors represent the inferred countries and/or regions where transmission occurred. b) Number of sequenced cases of Delta per week in India, England, and the rest of the world. c) Time-varying proportion of sequenced reported positive cases in India and England (solid lines, n = 52,992 sequences are from England, corresponding to 84% of all sequences from the UK) and the proportion of sequenced cases classified as Delta in India and England (dashed lines).
Figure 2:
Figure 2:. Timing of importations of Delta into England.
a) Daily number of estimated importations of Delta from India (blue shaded area) and other countries (yellow shaded area) inferred from phylogenetic analysis. Shaded areas show 95% HPDs of the estimate. Blue and yellow lines show the Estimated Importation Intensity (EII) of Delta, obtained by combining data on human movements, cases, and prevalence of Delta, normalized to the same scale as the phylogenetic estimates. Grey vertical lines indicate the announcement of travel restrictions from India to England (April 18, 2021) and its implementation on April 23, 2021. b) Temporal distribution of genome sequences from cases with known travel history from India (blue) and other countries (yellow). Isolates with recent travel to both India and other countries are considered ambiguous (lavender) c) R2 (coefficient of determination) between estimated number of importations from the phylogenetic analysis and the Estimated Importation Intensity (EII) (panel a). The R2 is calculated separately for India (blue) before and after hotel quarantine was introduced, and for other countries (yellow), whilst also accounting for phylogenetic uncertainty.
Figure 3:
Figure 3:. Introductions and regional dynamics of Delta transmission lineages.
a) Number of independent introductions per UTLA in England based on continuous phylogeographic analysis of all Delta transmission lineages with >5 sequences. b) Trends in aggregate human mobility and the number of virus lineage movements among postcode districts. Letters denote stages of lockdown easing: A (2021-03-08) schools reopen and limited mixing between households outdoors permitted; B (2021-03-29) “Stay at home” directive lifted, more outdoor mixing allowed (up to six people from two households; C (2021-04-12) non-essential retail re-opened, outdoor dining permitted, holiday lets and campsites re-open; D (2021-05-17) indoor hospitality opens, indoor mixing permitted. c) Proportion of virus lineage movements between postcodes >25 km apart: y-axis denotes the proportion of movements that are less than or equal to the value on the x-axis. This is shown for movements before lockdown easing on 12th April (blue), between 12th April and 17th May (yellow) and after 17th May (red). d) Virus lineage movements inferred by continuous phylogeographic analysis for four large transmission lineages (see transmission lineages IV-VII in Extended Data Fig. 5). Direction of lineage movement is anti-clockwise, and dots represent the start and end points of movement, coloured by inferred date. The size and inferred TMRCA of each lineage is shown below each map. Distance kernels for each lineage can be found in Extended Data Fig. 7.
Figure 4:
Figure 4:. Delta growth rates among regions in England and USA.
a) Estimated proportion of genomes that belong to the Delta variant (yellow) for several illustrative UTLAs in England, and observed relative aggregate human mobility (black dashed line), number of reported cases (blue line). b) Corresponding time-varying relative growth of Delta (on the log odds scale). The light shaded regions in all plots represent 95% Bayesian credible intervals. c) Estimated proportion of Delta variant samples across several illustrative US states (yellow), reported number of cases (blue line) and observed immunity at baseline (black dot). d) Corresponding time-varying relative growth of Delta (on the log odds scale).

References

    1. GISAID - Initiative. https://www.gisaid.org/.
    1. Earnest R. et al. Comparative transmissibility of SARS-CoV-2 variants Delta and Alpha in New England, USA. bioRxiv (2021) doi: 10.1101/2021.10.06.21264641. - DOI - PMC - PubMed
    1. Vöhringer H. S. et al. Genomic reconstruction of the SARS-CoV-2 epidemic in England. Nature 1–11 (2021). - PMC - PubMed
    1. Cauchemez S. & Kiem C. T. Managing COVID-19 importation risks in a heterogeneous world. Lancet Public Health (2021) doi: 10.1016/S2468-2667(21)00188-2. - DOI - PMC - PubMed
    1. Dhar M. S. et al. Genomic characterization and epidemiology of an emerging SARS-CoV-2 variant in Delhi, India. Science eabj9932 (2021). - PMC - PubMed

Publication types