Review
. 2022 Jan 3;14(1):42.
doi: 10.1007/s40820-021-00782-5.

Zinc Anode for Mild Aqueous Zinc-Ion Batteries: Challenges, Strategies, and Perspectives

Affiliations
Review

Zinc Anode for Mild Aqueous Zinc-Ion Batteries: Challenges, Strategies, and Perspectives

Jinzhang Yang et al. Nanomicro Lett. .

Abstract

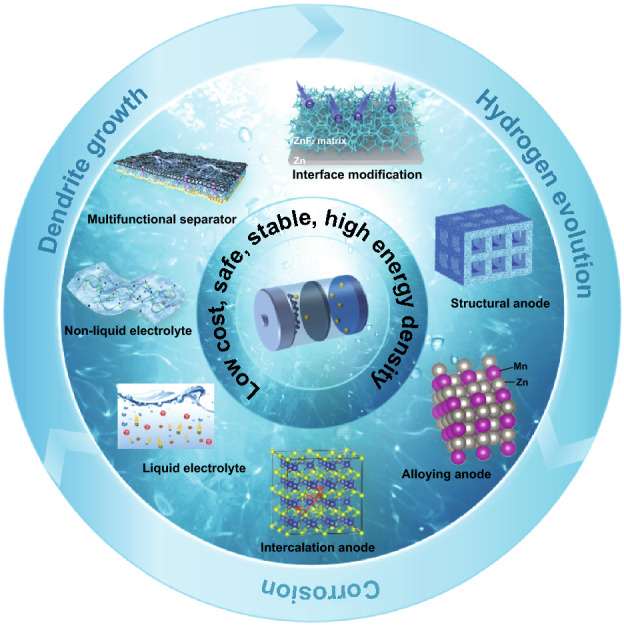
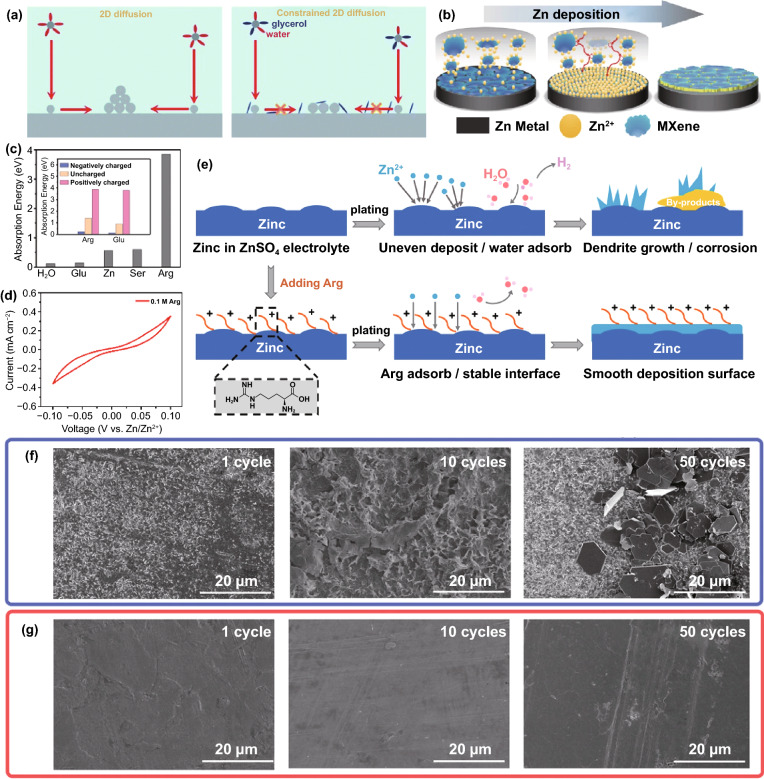
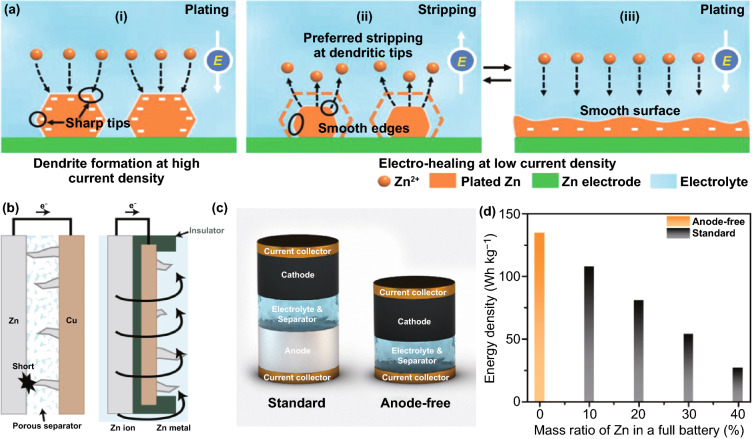
The rapid advance of mild aqueous zinc-ion batteries (ZIBs) is driving the development of the energy storage system market. But the thorny issues of Zn anodes, mainly including dendrite growth, hydrogen evolution, and corrosion, severely reduce the performance of ZIBs. To commercialize ZIBs, researchers must overcome formidable challenges. Research about mild aqueous ZIBs is still developing. Various technical and scientific obstacles to designing Zn anodes with high stripping efficiency and long cycling life have not been resolved. Moreover, the performance of Zn anodes is a complex scientific issue determined by various parameters, most of which are often ignored, failing to achieve the maximum performance of the cell. This review proposes a comprehensive overview of existing Zn anode issues and the corresponding strategies, frontiers, and development trends to deeply comprehend the essence and inner connection of degradation mechanism and performance. First, the formation mechanism of dendrite growth, hydrogen evolution, corrosion, and their influence on the anode are analyzed. Furthermore, various strategies for constructing stable Zn anodes are summarized and discussed in detail from multiple perspectives. These strategies are mainly divided into interface modification, structural anode, alloying anode, intercalation anode, liquid electrolyte, non-liquid electrolyte, separator design, and other strategies. Finally, research directions and prospects are put forward for Zn anodes. This contribution highlights the latest developments and provides new insights into the advanced Zn anode for future research.

Keywords: Corrosion; Dendrite; Hydrogen evolution; Zn metal anode; Zn-ion batteries.


Figures

Fig. 1
Fig. 1
Schematic of strategies to enhance the performance of Zn anodes for mild aqueous ZIBs
Fig. 2
Fig. 2
a Schematic illustration of the formation of inactive Zn; b Top-view SEM image of the Zn electrode after short circuit. Inset: flake-like dendrites [137]. Copyright 2021, Royal Society of Chemistry. Simulation of the diffusion and distribution of Zn ions along the 2D surface of the electrode with the conditions of c a flat surface and d 2 large dendritic seeds [29]. Copyright 2019, Wiley–VCH. e In situ optical microscope images of H2 gas evolution during the Zn electrodeposition process at 0.2 mA cm−2 [42]. Copyright 2019, Elsevier. f Online DEMS data for symmetrical Zn batteries with the bare Zn in 2 M ZnSO4 electrolyte, reflecting the hydrogen evolution of the anode during rest and charging/discharging process [43]. Copyright 2019, Royal Society of Chemistry. g Pourbaix diagram of ZnSO4–H2O system at 25 °C [44]. Copyright 2021, American Chemical Society. h The in situ XRD patterns of bare Zn immersed in 2 M ZnSO4 electrolyte [48]. Copyright 2021, Wiley–VCH. i SEM image of Zn foil after soaking in 1 M ZnSO4 electrolyte for 7 days [41]. Copyright 2020, Wiley–VCH. j Nyquist plots of the fresh and aged Zn electrode. The inset shows the equivalent circuit [49]. Copyright 2021, Wiley–VCH
Fig. 3
Fig. 3
a Ion transport mechanisms in Nafion–Zn-X protective layers [54]. Copyright 2020, Wiley–VCH. b Schematic illustration of the synthesis of HsGDY and the sub-ångström ion tunnel of HsGDY; c Electric and concentration field simulation with protuberances of bare Zn and coated Zn [55]. Copyright 2020, Wiley–VCH. d Schematic illustration of the Zn deposition process on bare Zn, Zn@Ca-Mont and Zn@Zn-Mont anodes [58]. Copyright 2021, Elsevier
Fig. 4
Fig. 4
a Schematic diagram of the mechanism of cyanoacrylate for suppressing Zn dendrite; b The illustrations of electronic cloud distribution of cyanoacrylate monomer; c CAs of bare Zn and coated Zn at a 150 mV overpotential; d Morphology of bare Zn foil and 502-decorated Zn foil obtained from symmetric Zn cells after Zn stripping/plating for 100 cycles at 0.5 mA cm−2 for 0.25 mAh cm−2; e long-term cycling stability for the symmetrical cells at 0.5 mA cm−2 for 0.25 mAh cm−2 with the inset showing detailed voltage profile [62]. Copyright 2020, Elsevier. f Schematic illustration of the Zn@ZnF2 electrode [67]. Copyright 2020, Wiley–VCH
Fig. 5
Fig. 5
a Schematic diagram of the Ti ion migration in the [TiO6] octahedral interstitial sites under the external electric field; b Schematic of Zn2+ ion transport during Zn stripping/plating for BTO@Zn foil; c Schematic of the mechanism of Zn2+ ion transport at the (top) BTO@Zn/electrolyte and (bottom) Zn anode/electrolyte interface during Zn plating process; d Cycling performance of the symmetric cells with Zn and BTO@Zn at 5 mA cm−2 with a capacity of 2.5 mAh cm−2. The insets reveal the detailed corresponding voltage profiles at various current densities and different cycles [73]
Fig. 6
Fig. 6
a Schematic illustration of the modification process and the stability in 2 M ZnSO4 electrolyte of Zn and graphite-coated Zn anode; b The voltage–time curves of Zn and Zn–G symmetric cells at 1.5 mA cm−2; c In situ optical microscope photographs of (top) Zn and (bottom) Zn–G electrodes observed by symmetric transparent cells under various deposition times [78]. Copyright 2020, Wiley–VCH. d Illustration of (top) synchronously reducing and assembling MXene layer on the Zn foil surface; Illustration of Zn plating behavior of (middle) MXene-coated Zn, and (bottom) pure Zn; SEM images of MZn-60 and pure Zn e, g before cycling, and f, h after 100 cycles at 3 mA cm−2 [81]. Copyright 2020, Wiley–VCH
Fig. 7
Fig. 7
a Schematic illustrating the Zn plating behavior of the bare Zn and Zn/rGO anodes; cross-sectional SEM images of rGO film on Zn foil b before cycling and c after cycling [77]. Copyright 2019, Elsevier. Atomic force microscope images of d bare Zn anode and e Au-decorated Zn anode; f Schematic illustration of the Zn stripping/plating process [84]. Copyright 2019, American Chemical Society
Fig. 8
Fig. 8
a Interfacial charge density of (right) carbon and (left) Sn; b Schematic illustration of Zn deposition induction mechanism; SEM images of c PH and d SH after charging (inset, higher magnification) [87]. Copyright 2019, Wiley–VCH. e (top) Spacious Zn nucleation with zincophilic sites and (bottom) dense nucleation on zincophobic surface; f Schematic illustration of Zn deposition on surface with zincophilic sites; g Galvanostatic cycling performance of symmetric cells with and without zincophilic nitrogen sites [50]. Copyright 2020, Wiley–VCH
Fig. 9
Fig. 9
a Calculated binding energies of Zn atom with different facets; b Schematic illustration of the interaction between Zn and anatase TiO2 with different exposed facets; c Schematic illustration of the Zn plating process with different coating layers [86]. d Voltage profiles of Zn deposition on Com–Zn, Zn/Sn (101), and Zn/Sn (200) at a current density of 1 mA cm−2 and a capacity of 1 mAh cm−2; e The calculated surface energy on different electrodes; f Schematic illustration of Zn deposition process on Com–Zn, Zn/Sn (101) and Zn/Sn (200) [91]. Copyright 2020, Wiley–VCH. g The structure of metal Zn; Surface atomic arrangement and electron equipotential plane of h Zn (100) and i Zn (002) [92]. Copyright 2021, Wiley–VCH
Fig. 10
Fig. 10
a Schematic illustrations of CM@CuO@Zn; b SEM images of Zn anode using reduced CM@CuO as the host with the capacity of 5 mAh cm−2; c Schematic illustrations of the process of Zn deposition on CM@CuO and CM [97]. Copyright 2020, Wiley–VCH. d Schematic illustration of Zn deposition on the 3D Ni [98]. Copyright 2020, Wiley–VCH. e Stripping/plating performance of DCP-Zn-30 and pristine Zn foil cells with 0.1 mAh cm−2 cutoff capacity at 3–10 mA cm−2 [99]. Copyright 2020, Elsevier. f Nanoporous Zn electrode with interface-localized concentrated electrolyte; g The ion concentration at the electric double layer of nanoporous Zn metal with different pore diameters; h Surface charge densities of the cations and anions at the interface of ZnSO4 electrolyte and nanoporous Zn metal with different pore diameters ranging from 5 to 100 nm [100]. Copyright 2021, Elsevier
Fig. 11
Fig. 11
a Schematic illustrations of Zn deposition on CC and CNT electrodes; b Models of the electric field distributions for a Zn/CC electrode (top) and a Zn/CNT electrode (bottom) after Zn nuclei formation [106]. Copyright 2019, Wiley–VCH. c Schematic diagrams of the Zn growth mechanisms on different anode structures; d SEM image of ZnP/CF composite electrode. Inset shows the optical pictures of ZnP/CF composite electrode; e Voltage profiles of the symmetric cells using Zn foil electrode and 3D ZnP/CF electrode at the current density of 1 mA cm−2 and 1 mAh cm−2; f Plots of the charge transfer resistance and the corrosion current with different particle sizes [107]. Copyright 2020, Elsevier. g Scheme illustrating the design principle of epitaxial metal electrodeposition [109]. Copyright 2019, American Association for the Advancement of Science
Fig. 12
Fig. 12
a Schematic illustration of the Zn plating on the ZIF-8–500 electrode; b Electrochemical performances of the I2//Zn@ZIF-8–500 full cell at a current density of 2.0 A g−1 [111]. Copyright 2019, Elsevier. Schematic of morphology evolution for c bare Zn and d Ti3C2Tx MXene@Zn anode during the stripping/plating process [112]. Copyright 2019, American Chemical Society
Fig. 13
Fig. 13
a Linear polarization curve of Cu/Zn and Cu–Zn/Zn electrode in 3 M ZnSO4 electrolyte [119]. Copyright 2020, Elsevier. b DFT simulation results showing the energetic cost of removing a Zn atom from the pure Zn metal and Zn0.5Ag0.5 alloy. Constructed models: Zn with 001 and 100 surfaces; Zn0.5Ag0.5 with 110 and 001 surfaces; c Calculated Gibbs free energy of formation at room temperature of Zn, ζ- and ε-ZnxAg1−x alloy phases and the corresponding electrochemical potential shift of Zn2+/ZnxAg1−x compared with that of Zn2+/Zn. d Schematic of Zn deposition on the (top) carbon paper substrate and (bottom) carbon paper slurry coated with Ag nanoparticles [121]. Copyright 2021, American Chemical Society. e Dendrite-free GaIn@Zn anode by alloying–diffusion synergistic strategy; f Voltage profiles of symmetric cells using bare Zn foil and GaIn@Zn at a current density of 0.25 mA cm−2 [116]. Copyright 2021, American Chemical Society
Fig. 14
Fig. 14
a Schematic illustrations of eutectic Al–Zn for uniform Zn deposition [124]. b SEM image of Zn–Mn alloy; c Schematic illustration of Zn plating processes on Zn anode and Zn–Mn anode; The images of 3D Zn–Mn alloy by in situ optical microscope before d and after e Zn plating, f was calculated by (d–e)/e = (ΔI/I); g Long-term galvanostatic cycling performance of symmetric Zn–Mn and pristine Zn cells at a current density of 80 mA cm−2 (areal capacity, 16 mAh cm−2; electrolyte, 2 M ZnSO4 in seawater) [125]
Fig. 15
Fig. 15
a Schematic illustration of preparing the PTCDI/rGO composite [131]. b Schematic illustration of the formation of the Cu2−xSe nanorods; c XRD patterns of Cu2−xSe and CuSe; SEM d and TEM e images of the Cu2−xSe nanorods; f Charge transfer process at the reaction interface and intercalation formation energy of Cu2−xSe (right) and CuSe (left); g Diffusion barrier of Zn2+ ion in Cu2−xSe and CuSe [132]. Copyright 2020, Wiley–VCH
Fig. 16
Fig. 16
a Coordination environment of Zn2+ in water [54]. Copyright 2020, Wiley–VCH. Cyclic voltammograms of Zn electrode in aqueous electrolyte of b 1 M Zn(CF3SO3)2 and c 1 M ZnSO4 at the scan rate of 0.5 mV s−1 between − 0.2 and 2.0 V [133]. Copyright 2016, American Chemical Society. d The pH values of the electrolytes with varying LiTFSI concentrations; e The progression of FTIR spectra with salt concentration between 3,800 and 3,100 cm−1; f The change with salt concentration of chemical shifts for 17O nuclei in solvent (water); g Representative Zn2+ solvation structures in the electrolytes with 1 M Zn(TFSI)2 and three concentrations of LiTFSI (5, 10, and 20 M); h Cyclic voltammogram of Zn plating/stripping in a three-electrode cell using a Pt disk (2 mm in diameter) as the working and Zn as the reference and counter electrodes at a scan rate of 1 mV s−1. Inset: chronocoulometry curves; i Cycling stability and CE of the Zn/LiMn2O4 full cell in HCZE at 4 C rates; j Storage performance evaluated by resting for 24 h at 100% state of charge (SOC) after ten cycles at 0.2 C, followed by full discharging [134]. Copyright 2018, Springer Nature. k Electrochemical stability window of the ZnCl2 electrolyte at different concentrations [135]. Copyright 2018, Royal Society of Chemistry
Fig. 17
Fig. 17
a Binding energy for Zn2+ with different compounds (glucose and H2O) under DFT calculation; b Partial enlarged 3D snapshot representing Zn2+ solvation structure, obtained from MD simulations of ZnSO4–glucose system; c Electrostatic potential mapping of the original Zn2+–6H2O (left) and glucose–Zn2+–5H2O (right) solvation structures [136]. Copyright 2021, Wiley–VCH. d Preparation of methanol-based antisolvent electrolytes; inset shows recrystallization of ZnSO4 in antisolvent electrolyte of 55% methanol; e Schematic of changes in the Zn2+ solvent sheath, together with methanol addition [140]. Copyright 2020, Wiley–VCH
Fig. 18
Fig. 18
a Schematics of the Zn2+ diffusion and reduction processes on the bare Zn electrode in aqueous and hybrid electrolytes, showing that the surface diffusion is constrained in the hybrid electrolyte [137]. Copyright 2021, Royal Society of Chemistry. b Schematic illustration of the effect of MXene additive on the Zn deposition process [144]. c Absorption energy of H2O, Glu, Zn, Ser, and Arg on Zn surface in mildly acidic electrolyte, respectively. Inset is absorption energy of Arg and Glu with positively charged, uncharged, and negatively charged on Zn surface, respectively; d CV curve of Zn symmetric cell with 0.1 M Arg solution at 5 mV s−1. e Schematic illustration of Zn plating behavior with and without Arg additive; surface morphology of Zn electrode at 1st, 10th, and 50th cycle f in bare ZnSO4 electrolyte and g in ZnSO4 + Arg electrolyte [145]. Copyright 2021, Wiley–VCH
Fig. 19
Fig. 19
a Schematics of the Zn2+ ion diffusion and reduction processes on electrodes in 2 M ZnSO4 electrolyte (top) without and (bottom) with 0.05 mM TBA2SO4; b Schematic illustrations of Zn deposition on Cu foam without or with TBA2SO4 as an electrolyte additive [148]. Copyright 2020, American Chemical Society. c Schematics of morphology evolution for Zn anodes in mild aqueous electrolyte with and without Et2O additive during Zn stripping/plating cycling [150]. Copyright 2019, Elsevier
Fig. 20
Fig. 20
CV curves of Zn‖Ti half cells a with and b without Zn(NO3)2 additive; c Interfacial impedance measured from Zn‖Zn cells in Zn(OTF)2 electrolytes with and without Zn(NO3)2 additive under cycling; d Illustration of surface evolution mechanism in Zn(OTF)2 electrolytes with and without Zn(NO3)2 additive. [151]. Copyright 2021, Wiley–VCH. e Schematic illustration of the Zn surface evolution and characterization of Zn electrodes in the baseline and designed electrolytes [155]. Copyright 2021, Wiley–VCH
Fig. 21
Fig. 21
a Crystal structure of ZnMOF-808. Blue polyhedrons represent Zr–O clusters, and Zn2+ ions are highlighted by pink balls; b Proposed mechanism for the different deposition behaviors of ZnSO4 aqueous electrolyte (left) and WZM SSE (right) [159]. Copyright 2018, Elsevier. c Schematic diagram of IL-PAM composition and structure [161]. Copyright 2021, American Chemical Society. d SEM image of MXene-g-PMA; e Schematic illustration of the overall preparation process of the SPEs; f LSV of the SPEs (scan rate 0.5 mV s−1); g Galvanostatic Zn plating/stripping in the Zn/Zn symmetrical cells based on different current densities with different plating capacities [162]. Copyright 2021, Royal Society of Chemistry
Fig. 22
Fig. 22
a Schematic synthesis of PAMPSZn hydrogel electrolyte; b The mechanism of Zn deposition/stripping with ZnSO4 aqueous electrolyte and PAMPSZn hydrogel electrolyte [165]. Copyright 2020, Elsevier. c Synthesis schematic of the CT3G30 hydrogel electrolyte. d SEM image of freeze-dried CT3G30; e DSC curves and f ionic conductivity values of CT3G30; g Tensile σ–ε curves of the original CT3G30 and self-healed CT3G30 [169]. Copyright 2020, Wiley–VCH
Fig. 23
Fig. 23
a Schematic diagram of interface protection effect in HCCE and liquid electrolyte; b Ion exchange diagrams in the HCCE; c AFM images of (top) anode of the battery with HCCE and (bottom) the battery with liquid electrolyte cycled for 200 cycles 1000 mA g−1; d Long-life cycling performance of the cell with HCCE and liquid electrolyte at 500 mA g−1 [172]
Fig. 24
Fig. 24
SEM images of a GF and b Zn-Nafion separators; c The stress–strain curves (the inset is a magnified stress–strain curve of the GF separator); d The water uptake; e The 3D height images for the surface of the (right) GF separator and (left) Zn-Nafion separator after the first cycle [173]. Copyright 2021, Royal Society of Chemistry
Fig. 25
Fig. 25
a Schematics illustrating (top) a pristine glass fiber separator and (bottom) a Janus separator targeting stabilized Zn anode [174]. Copyright 2020, Wiley–VCH. b Schematic illustration for the Janus separator [175]. c Schematic illustration of Zn deposition in the contact region of the modified separator and the anode [176]. d Schematic illustration for the ZC separator; e Schematic illustration of possible migration process of Zn2+ when passing through the cellulose and ZC separators [177]. Copyright 2021, Elsevier
Fig. 26
Fig. 26
a Schematic illustration of the electrohealing process, where the sharp tips of dendrites are passivated into smooth edges and finally produce a smooth electrode surface [29]. Copyright 2019, Wiley–VCH. b Schematic representation of (right) conventional frontside- and (left) backside-plating configuration cells [179]. c Schematic diagram of standard battery and anode-free battery; d Comparison of the energy density of the anode-free and standard batteries [180]. Copyright 2021, American Chemical Society

References

    1. Obama B. The irreversible momentum of clean energy. Science. 2017;355(6321):126–129. doi: 10.1126/science.aam6284. - DOI - PubMed
    1. Brockway PE, Owen A, Brand-Correa LI, Hardt L. Estimation of global final-stage energy-return-on-investment for fossil fuels with comparison to renewable energy sources. Nat. Energy. 2019;4:612–621. doi: 10.1038/s41560-019-0425-z. - DOI
    1. Davidson DJ. Exnovating for a renewable energy transition. Nat. Energy. 2019;4:254–256. doi: 10.1038/s41560-019-0369-3. - DOI
    1. Carley S, Konisky DM. The justice and equity implications of the clean energy transition. Nat. Energy. 2020;5:569–577. doi: 10.1038/s41560-020-0641-6. - DOI
    1. Kittner N, Lill F, Kammen DM. Energy storage deployment and innovation for the clean energy transition. Nat. Energy. 2017;2:17125. doi: 10.1038/nenergy.2017.125. - DOI

LinkOut - more resources