Review
. 2022 Jun;40(6):547-559.
doi: 10.1007/s11604-021-01233-2. Epub 2022 Jan 4.

Dual-energy CT: minimal essentials for radiologists

Affiliations
Review

Dual-energy CT: minimal essentials for radiologists

Fuminari Tatsugami et al. Jpn J Radiol. 2022 Jun.

Abstract

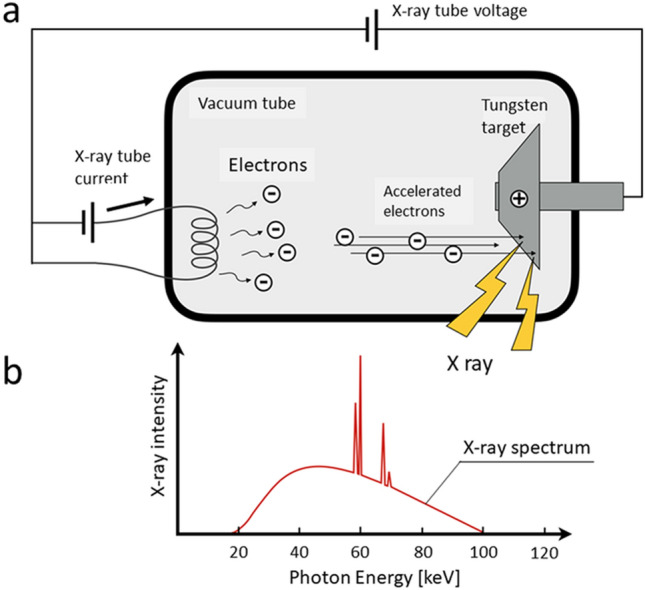
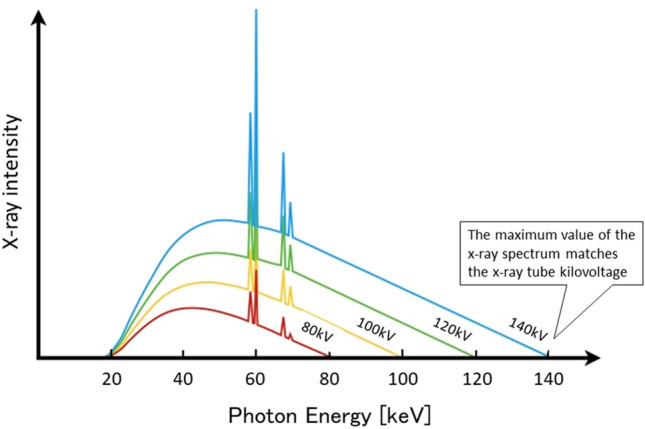
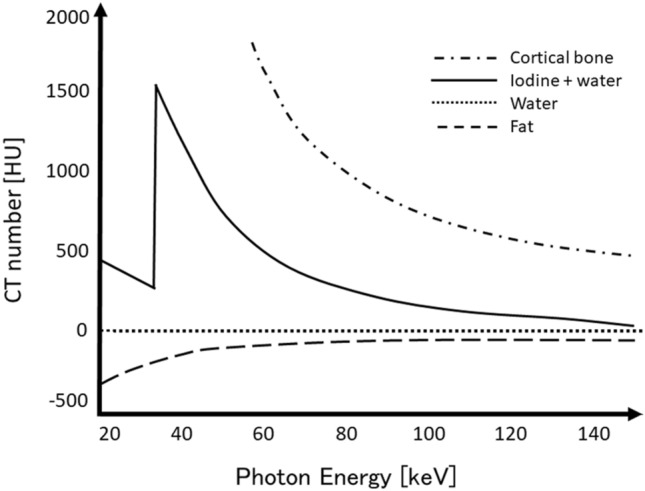
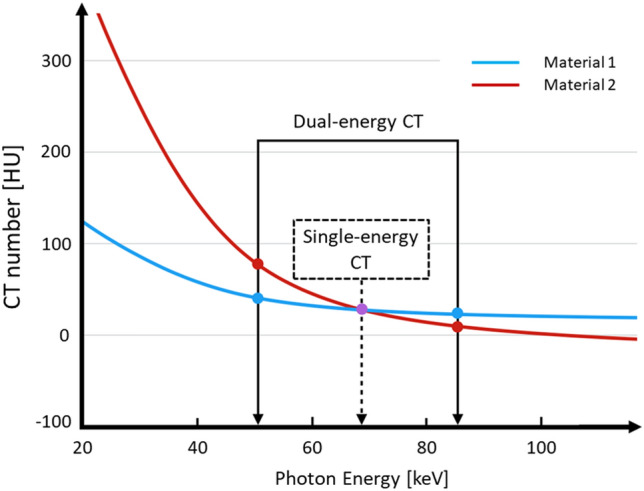
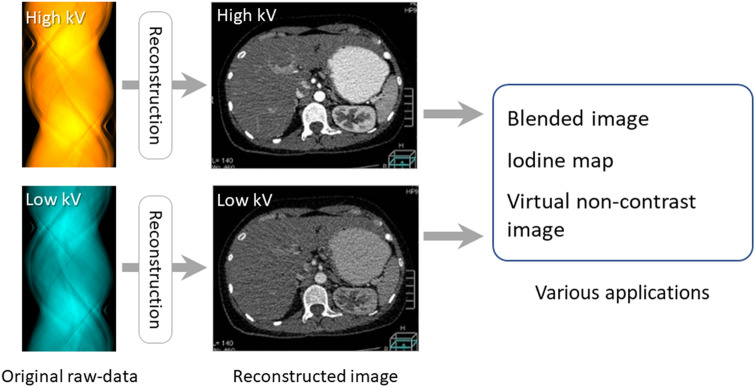
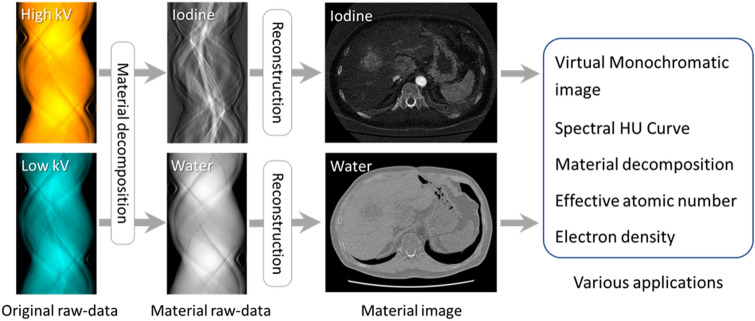
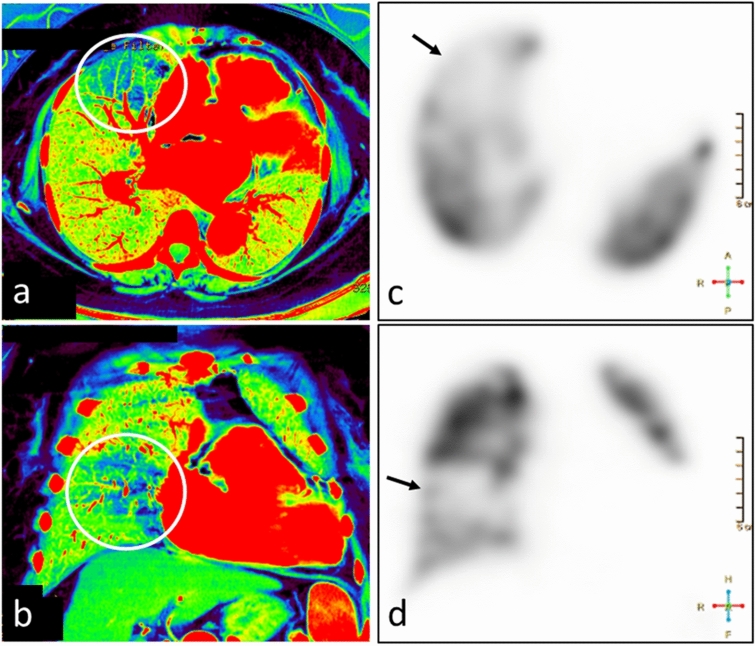
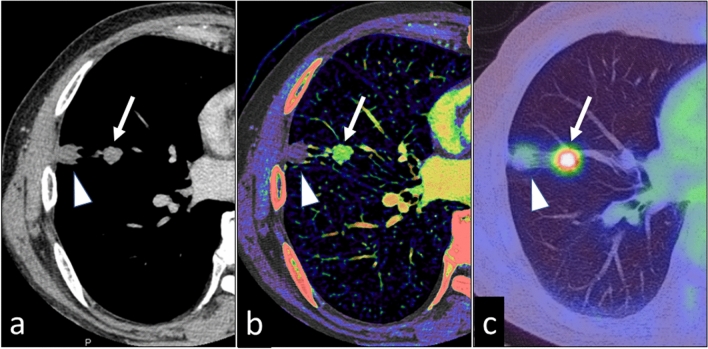
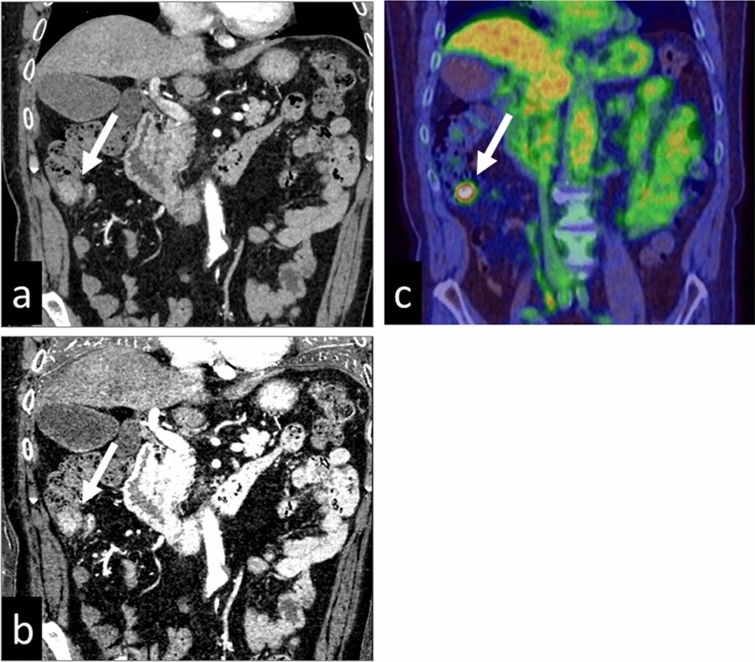
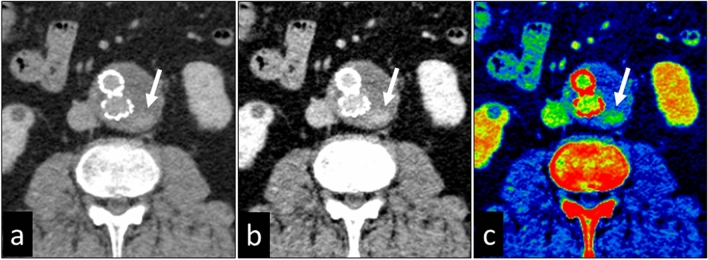
Dual-energy CT, the object is scanned at two different energies, makes it possible to identify the characteristics of materials that cannot be evaluated on conventional single-energy CT images. This imaging method can be used to perform material decomposition based on differences in the material-attenuation coefficients at different energies. Dual-energy analyses can be classified as image data-based- and raw data-based analysis. The beam-hardening effect is lower with raw data-based analysis, resulting in more accurate dual-energy analysis. On virtual monochromatic images, the iodine contrast increases as the energy level decreases; this improves visualization of contrast-enhanced lesions. Also, the application of material decomposition, such as iodine- and edema images, increases the detectability of lesions due to diseases encountered in daily clinical practice. In this review, the minimal essentials of dual-energy CT scanning are presented and its usefulness in daily clinical practice is discussed.

Keywords: Computed tomography; Detectability; Dual-energy CT; Material decomposition.


Conflict of interest statement

K.A. is currently receiving a research grant from Canon Medical Systems Corp. For the remaining authors none were declared.

Figures

Fig. 1
Fig. 1
When accelerated electrons emitted from the cathode bombard the tungsten target anode, x-ray beams are produced (a). The x-ray beams are composed of photons in a broad continuum of energies that form the x-ray spectrum (b)
Fig. 2
Fig. 2
The x-ray spectrum varies depending on the tube voltage. The maximum value of the x-ray spectrum (keV) is equal to the x-ray tube kilovoltage (kV)
Fig. 3
Fig. 3
A material has different CT numbers at different energy levels. The degree of the difference depends on the material’s elemental composition
Fig. 4
Fig. 4
On conventional single-energy CT images, two materials can often not be distinguished due to considerable overlap in their CT numbers. On dual-energy CT scans, materials with different elemental compositions can be differentiated and quantified by comparing their CT numbers at two different energy levels
Fig. 5
Fig. 5
Image-based approach for dual-energy CT analysis. The x-ray paths at high- and low-tube voltages do not need to be perfectly matched. Dual-energy data are processed after the reconstruction of high- and low-energy images, then various applications are created. Dual-energy CT images created by image-based analysis contain various artifacts, e.g. beam hardening-, motion-, and helical artifacts
Fig. 6
Fig. 6
Raw data-based approach for dual-energy CT analysis. The x-ray paths at the high- and low-tube voltages must match exactly. Material raw data are processed directly by material decomposition, then image reconstruction is performed. The obtained CT applications have fewer beam-hardening effects and artifacts related to the CT reconstruction kernel than image-based analysis
Fig. 7
Fig. 7
CT image processed with image-based analysis (a) and raw data-based analysis (b). In image-based analysis, beam-hardening artifacts from facial bones degrade the image quality (arrowheads). As the CT image processed with raw data-based analysis rather than image-based analysis exhibits lower beam-hardening artifacts, the acquired CT number would be accurate
Fig. 8
Fig. 8
Virtual monochromatic images obtained at 40 (a), 70 (b), and 140 keV (c) (window level/width; 30/580 HU). On dual-energy CT scans, a monochromatic image, looking as if it had been acquired with single energy (keV), can be synthesized arbitrarily. The CT attenuation number on approximately 65–70 keV virtual monochromatic images is equivalent to single-energy CT scans acquired at 120 kV. The iodine contrast increases as the energy level decreases
Fig. 9
Fig. 9
A 64-year-old woman with hepatocellular carcinoma. CT images during the arterial phase were obtained with a low contrast material dose (220 mgI/kg) due to renal insufficiency (eGFR, 21 ml min–1 1.73 m–2). Visualization of the liver lesion is insufficient on the virtual monochromatic 70 keV image (a), whereas it is clearly detected on the monochromatic 40 keV image (b), and the iodine map (c)
Fig. 10
Fig. 10
A 66-year-old man with hepatocellular carcinoma in the caudate lobe (arrows). On the 70 keV virtual monochromatic image (a), metal artifacts from the metallic coil implanted in the left inferior phrenic vein affect tumor detection. On the iodine map applied with metal artifact reduction software (b), the metal artifacts are reduced and the visibility of the tumor is considerably improved
Fig. 11
Fig. 11
Spectral HU curves are obtained by setting a region of interest in tissue and plotting the average CT number at each monochromatic energy. The attenuation of high atomic number materials, such as iodine (insert, yellow circle) increases at lower energies, that of water is zero at all energies (insert, green circle), and that of fat decreases at lower energies (insert, red circle)
Fig. 12
Fig. 12
Axial monochromatic 70 keV images showing an adrenal adenoma (a) and an adrenal metastasis (b). Based on its CT number (HU = 19), the adenoma is not lipid-rich. At lower energy levels, the CT attenuation of the tumor decreases (a), suggesting that it contains fat. On the other hand, attenuation of the adrenal metastasis is increased at lower energy levels (b)
Fig. 13
Fig. 13
A 67-year-old woman with pulmonary-tumor thrombotic microangiopathy. The tumor embolism was too small for its detection on the contrast-enhanced CT scan. Catheterization demonstrated tumor embolism. Iodine maps (a, b) show areas with decreased blood flow in the right lung (circle), a finding consistent with a defect on lung perfusion scintigraphy (c, d) (arrows)
Fig. 14
Fig. 14
A 76-year-old man with two pulmonary nodules in the right lung. On the 70 keV virtual monochromatic image (a), the degree of enhancement is similar for both nodules. The iodine map (b) shows that the nodule at the proximal site (arrow) is highly vascular; the peripheral nodule (arrowhead) is not enhanced. Pathologically, the proximal nodule was identified as an adenocarcinoma and the peripheral nodule as an infarction. c PET-CT image (the maximum standardized uptake value of the tumor was 6.4)
Fig. 15
Fig. 15
A 71-year-old man with cancer of the ascending colon. Virtual monochromatic image at 70 keV (a) and iodine map (b) during the arterial phase are shown. The iodine map yields better conspicuity than the monochromatic 70 keV image. c PET-CT image (the maximum standardized uptake value of the tumor was 6.1)
Fig. 16
Fig. 16
A 75-year-old man with endoleak after endovascular aortic repair. Virtual monochromatic images at 70 keV (a), 40 keV (b), and a color image of the iodine map (c) obtained with CT angiography are shown. The vessel contrast and the endoleak delineation (arrow) are better on the 40 keV image and the iodine map than on the monochromatic 70 keV image
Fig. 17
Fig. 17
A 77-year-old woman who received gastrografin orally. The virtual monochromatic image at 70 keV (a) and the virtual non-contrast enhanced image (b) were obtained after unenhanced dual-energy CT. On the virtual non-contrast enhanced image (b), iodine in the small intestine is well removed. Iodine removal from the stomach is incomplete (dotted circle), suggesting that the iodine concentration was very high. During the virtual non-contrast reconstruction process, the volume of the calcification on the aortic wall was reduced (arrows)
Fig. 18
Fig. 18
A 13-year-old man with a distal femur fracture. It is difficult to detect bone marrow edema on the virtual monochromatic 70 keV image (a). On the edema image (b), bone marrow edema (arrow) is visualized in the same area as on the short TI inversion recovery image (c)
Fig. 19
Fig. 19
A 64-year-old woman with tuberous sclerosis, and focal hepatic steatosis and angiomyolipoma in the right lobe. A virtual monochromatic image obtained at 70 keV (a) and a color image of the fat map (b) are shown. The liver fat volume was 96.9% in the angiomyolipoma, 20.6% in the right-, and 7.8% in the left lobe of the liver

References

    1. Goldman LW. Principles of CT and CT technology. J Nucl Med Technol. 2007;35(3):115–128. doi: 10.2967/jnmt.107.042978. - DOI - PubMed
    1. Johnson TR. Dual-energy CT: general principles. AJR Am J of Roentgenol. 2012;199(5 Suppl):S3–8. doi: 10.2214/AJR.12.9116. - DOI - PubMed
    1. Matsumoto K, Jinzaki M, Tanami Y, Ueno A, Yamada M, Kuribayashi S. Virtual monochromatic spectral imaging with fast kilovoltage switching: improved image quality as compared with that obtained with conventional 120-kVp CT. Radiology. 2011;259(1):257–262. doi: 10.1148/radiol.11100978. - DOI - PubMed
    1. Johnson TR, Krauss B, Sedlmair M, Grasruck M, Bruder H, Morhard D, et al. Material differentiation by dual energy CT: initial experience. Eur radiol. 2007;17(6):1510–1517. doi: 10.1007/s00330-006-0517-6. - DOI - PubMed
    1. Schlomka JP, Roessl E, Dorscheid R, Dill S, Martens G, Istel T, et al. Experimental feasibility of multi-energy photon-counting K-edge imaging in pre-clinical computed tomography. Phys Med Biol. 2008;53(15):4031–4047. doi: 10.1088/0031-9155/53/15/002. - DOI - PubMed

MeSH terms

LinkOut - more resources