. 2022 Jun;240(6):1141-1151.
doi: 10.1111/joa.13620. Epub 2022 Jan 3.

Structural differences between immature and mature articular cartilage of rabbits by microscopic MRI and polarized light microscopy

Affiliations

Structural differences between immature and mature articular cartilage of rabbits by microscopic MRI and polarized light microscopy

Hannah Mantebea et al. J Anat. 2022 Jun.

Abstract

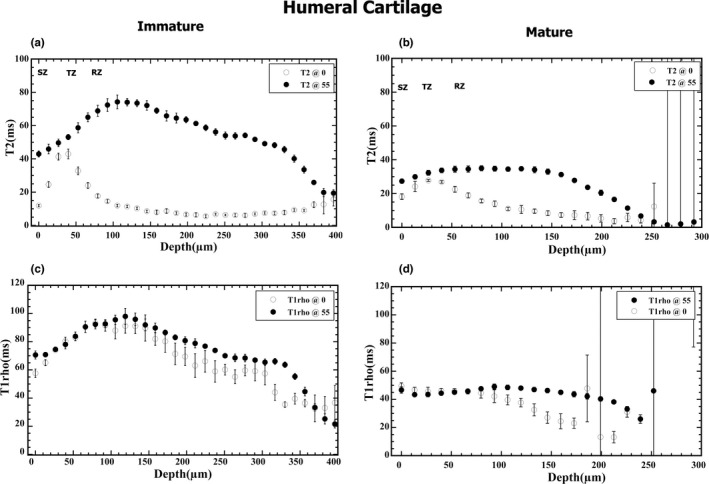
This study aimed to determine the structural features between immature and mature articular cartilage from the humeral and femoral joints of rabbits. Specimens of articular cartilage (n = 6 for immature tissue, n = 6 for mature tissue) that were still attached to the underlying bone from a humerus (shoulder joint) or femur (knee joint) were imaged using microscopic MRI (µMRI) and polarized light microscopy (PLM). Quantitative µMRI data with a pixel resolution of 11.7-13.2 µm revealed a number of differences between the immature and mature cartilage, including total thickness, and T2 and T1ρ relaxation values. Quantitative PLM data with a pixel resolution of 0.25-1 µm confirmed the µMRI results and revealed additional differences in cellular features between the tissues. The mature cartilage had a clearly defined tidemark, which was absent in the immature tissue. The ability to differentiate specific maturation-related cartilage characteristics could be beneficial to translational studies of degenerative diseases such as osteoarthritis.

Keywords: Collagen network; MRI relaxation anisotropy; articular cartilage; optical angle and retardation; polarized light microscopy; µMRI.


Figures

FIGURE 1
FIGURE 1
Photos of rabbit immature and mature joints. (a) Humeral heads from the shoulder joints and (b) femoral heads from the knee joints. (c) Several cartilage‐bone blocks were harvested from both humeri and femurs for high‐resolution imaging. The rectangular boxes in (a) and (b) indicate where the sample blocks were taken from the joint surfaces
FIGURE 2
FIGURE 2
MRI images of immature (a, c) and mature (b, d) cartilage blocks from humeri (a, b) and femurs (c, d) at 0° and 55°° orientations to the magnetic field (B0), which points vertically up, respectively. The first four columns contain T2 weighted intensity images, while the last column contains the calculated T2 images. All relevant images are plotted on the same gray scale
FIGURE 3
FIGURE 3
T2 (a, b) and T1ρ (c, d) depth‐dependent profiles of immature (a, c) and mature (b, d) cartilage of the humerus at 0° and 55° orientations to B0, respectively. Note that each of these profiles was from a single image, where 10 and 132 parallel neighboring columns on quantitative images were averaged to generate the 1D profiles. The error bars were from the column averaging
FIGURE 4
FIGURE 4
T2 (a, b) and T1ρ (c, d) depth‐dependent profile of immature (a, c) and mature (b, d) cartilage of femurs at 0° and 55° orientations B0, respectively. (Each of these profiles was from a single image, as in Figure 3)
FIGURE 5
FIGURE 5
2D angle and retardation images (a, c) of immature and mature humeral cartilage and their depth‐dependent profiles (b, d). The rectangular boxes on 2D images indicate where the regions of interest (ROI) were taken for the profile analysis
FIGURE 6
FIGURE 6
2D angle and retardation images (a, c) of immature and mature femoral cartilage and their depth‐dependent profiles (b, d). The rectangular boxes on 2D images indicate where the regions of interest (ROI) were taken for the profile analysis
FIGURE 7
FIGURE 7
(a) and (b) are 2D angle images, and (c) and (d) are retardation images of the same cartilage sections at higher resolution (0.25 µm per pixel) for both humeral (a, c) and femoral (b, d) cartilage. The arrows indicate estimate of tidemarks

Similar articles

Cited by

References

    1. Alhadlaq, H.A. , Xia, Y. , Hansen, F.M. , Les, C.M. & Lust, G. (2007) Morphological changes in articular cartilage due to static compression: Polarized light microscopy study. Connective Tissue Research, 48(2), 76–84. - PubMed
    1. Carballo, C.B. , Nakagawa, Y. , Sekiya, I. & Rodeo, S.A. (2017) Basic science of articular cartilage. Clinics in Sports Medicine, 36, 413–425. - PubMed
    1. Fairweather‐Tait, S.J. , Wawer, A.A. , Gillings, R. , Jennings, A. & Myint, P.K. (2014) Iron status in the elderly. Mechanisms of Ageing and Development, 136‐137, 22–28. - PMC - PubMed
    1. Flandry, F. & Hommel, G. (2011) Normal anatomy and biomechanics of the knee. Sports Medicine and Arthroscopy Review, 19(2), 82–92. - PubMed
    1. Fox, A.J. , Bedi, A. & Rodeo, S.A. (2009) The basic science of articular cartilage: Structure, composition, and function. Sports Health, 1(6), 461–468. - PMC - PubMed

Publication types