. 2022 Jan;42(1):37-55.
doi: 10.1002/cac2.12247. Epub 2022 Jan 4.

Increased mitochondrial fission drives the reprogramming of fatty acid metabolism in hepatocellular carcinoma cells through suppression of Sirtuin 1

Affiliations

Increased mitochondrial fission drives the reprogramming of fatty acid metabolism in hepatocellular carcinoma cells through suppression of Sirtuin 1

Dan Wu et al. Cancer Commun (Lond). 2022 Jan.

Abstract

Background: Mitochondria are dynamic organelles that constantly change their morphology through fission and fusion processes. Recently, abnormally increased mitochondrial fission has been observed in several types of cancer. However, the functional roles of increased mitochondrial fission in lipid metabolism reprogramming in cancer cells remain unclear. This study aimed to explore the role of increased mitochondrial fission in lipid metabolism in hepatocellular carcinoma (HCC) cells.

Methods: Lipid metabolism was determined by evaluating the changes in the expressions of core lipid metabolic enzymes and intracellular lipid content. The rate of fatty acid oxidation was evaluated by [3 H]-labelled oleic acid. The mitochondrial morphology in HCC cells was evaluated by fluorescent staining. The expression of protein was determined by real-time PCR, iimmunohistochemistry and Western blotting.

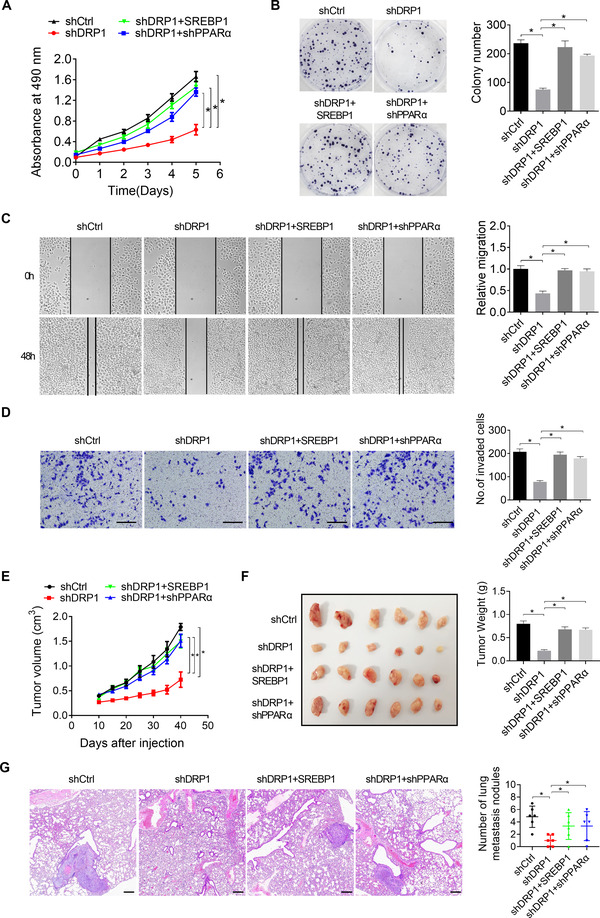
Results: Activation of mitochondrial fission significantly promoted de novo fatty acid synthesis in HCC cells through upregulating the expression of lipogenic genes fatty acid synthase (FASN), acetyl-CoA carboxylase1 (ACC1), and elongation of very long chain fatty acid protein 6 (ELOVL6), while suppressed fatty acid oxidation by downregulating carnitine palmitoyl transferase 1A (CPT1A) and acyl-CoA oxidase 1 (ACOX1). Consistently, suppressed mitochondrial fission exhibited the opposite effects. Moreover, in vitro and in vivo studies revealed that mitochondrial fission-induced lipid metabolism reprogramming significantly promoted the proliferation and metastasis of HCC cells. Mechanistically, mitochondrial fission increased the acetylation level of sterol regulatory element-binding protein 1 (SREBP1) and peroxisome proliferator-activated receptor coactivator 1 alpha (PGC-1α) by suppressing nicotinamide adenine dinucleotide (NAD+)/Sirtuin 1 (SIRT1) signaling. The elevated SREBP1 then upregulated the expression of FASN, ACC1 and ELOVL6 in HCC cells, while PGC-1α/PPARα suppressed the expression of CPT1A and ACOX1.

Conclusions: Increased mitochondrial fission plays a crucial role in the reprogramming of lipid metabolism in HCC cells, which provides strong evidence for the use of this process as a drug target in the treatment of this malignancy.

Keywords: Sirtuin 1; fatty acid oxidation; hepatocellular carcinoma; lipogenesis; metabolic reprogramming; mitochondrial fission.


Conflict of interest statement

The authors declare that they have no competing interests.

Figures

FIGURE 1
FIGURE 1
Mitochondrial fission significantly increases lipid contents in HCC cells. (A) Mitochondrial morphology was analyzed by transmission electron microscope in HCC cells when mitochondrial fission was suppressed by DRP1 knockdown or MFN1 overexpression in SNU‐368 cells, or activated by DRP1 overexpression or MFN1 knockdown in SNU‐739 cells. Scale bars, 0.5 μm. (Red arrows indicate fragmented mitochondria. Blue arrows indicate elongated mitochondria. ‘L’ indicates lipid droplets). (B‐D) Intracellular levels of free fatty acids (B), triglycerides (C), and phospholipids (D) were measured in HCC cells when mitochondrial fission was suppressed or activated with treatment as indicated. (E) Metabolomics analysis by GC‐TOF‐MS in HCC cells when mitochondrial fission was suppressed or activated with treatment as indicated. *, P < 0.05; **, P < 0.01. Abbreviations: HCC, hepatocellular carcinoma; DRP1, dynamin‐related protein 1; MFN1, mitofusin‐1; GC‐TOF‐MS, Gas chromatography–Time of Flight mass spectrometry
FIGURE 2
FIGURE 2
Mitochondrial fission promotes de novo lipogenesis in HCC cells. (A‐B) RT‐PCR (A) and Western blotting (B) analyses for the expression of key enzymes involved in fatty acid synthesis (ACC1, FASN, SCD1, and ELOVL6) and cholesterol biosynthesis (HMGCS1 and HMGCR) in HCC cells when mitochondrial fission was suppressed or activated with treatment as indicated. (C) Correlation analysis between mitochondrial fission (the mRNA expression ratio of DRP1 to MFN1) and the mRNA expression of de novo lipogenic enzymes ACC1, FASN, and ELOVL6 in tumor tissues from 30 HCC patients. (D) IHC analysis for correlations between mitochondrial fission (protein expression ratio of DRP1 to MFN1) and the protein expression of de novo lipogenic enzymes ACC1, FASN, and ELOVL6 in tumor tissues from another 217 HCC patients. Scale bars, 100 μm. *, P < 0.05. Abbreviations: HCC, hepatocellular carcinoma; RT‐PCR, Real‐time PCR; DRP1, dynamin‐related protein 1; MFN1, mitofusin‐1; ACC1, acetyl coenzyme A carboxylase 1; FASN, fatty acid (FA) synthase; SCD1, stearoyl‐CoA desaturase 1; ELOVL6, elongation of very long chain FA protein 6; HMGCS1, three‐hydroxy‐3‐methylglutaryl (HMG)‐CoA synthase 1; HMGCR, HMG‐CoA reductase
FIGURE 3
FIGURE 3
Mitochondrial fission promotes de novo fatty acid synthesis via SREBP1‐mediated upregulation of lipogenic gene expression. (A‐B) RT‐PCR (A) and Western blotting (B) analyses for mRNA and protein expression levels of chREBP and SREBPs (SREBP1 and SREBP2) in HCC cells when mitochondrial fission was suppressed or activated with treatment as indicated. (C) Western blotting analysis for nuclear levels of SREBP1 in HCC cells when mitochondrial fission was suppressed or activated with treatment as indicated. (D) IHC analysis for correlation between mitochondrial fission (the expression ratio of DRP1 to MFN1) and the expression of SREBP1 in tumor tissues from 217 HCC patients. Scale bars, 100 μm. (E‐F) RT‐PCR (E) and Western blotting (F) analyses for the expression of key enzymes involved in fatty acid synthesis (ACC1, FASN, and ELOVL6) in HCC cells with treatment as indicated. (G‐I) Intracellular levels of free fatty acids, triglycerides, and phospholipids were measured in HCC cells with treatment as indicated. *, P < 0.05; **, P < 0.01. Abbreviations: HCC, hepatocellular carcinoma; RT‐PCR, Real‐time PCR; DRP1, dynamin‐related protein 1; MFN1, mitofusin‐1; IHC, immunohistochemistry; chREBP, carbohydrate‐responsive element‐binding protein; SREBP1, sterol regulatory element‐binding protein 1; SREBP2, sterol regulatory element‐binding protein 2
FIGURE 4
FIGURE 4
Mitochondrial fission suppressed fatty acid oxidation in HCC cells. (A) Fatty acid oxidation was determined by evaluation of the rate of 3H2O generation with 3H‐labeled oleic acid as a tracer in SNU‐368 cells with suppressed mitochondrial fission or in SNU‐739 cells with activated mitochondrial fission. (B‐C) RT‐PCR (B) and Western blotting (C) analyses for the expression of key regulators in FAO (ACSL4, CPT1A, CACT, CPT2, and ACOX1) in HCC cells with suppressed or activated mitochondrial fission. (D‐E) Correlation analysis between mitochondrial fission (expression ratio of DRP1 to MFN1) and the expression of key regulators of FAO (CPT1A and ACOX1) were applied in tumor tissue from patients with HCC at both mRNA (D) and protein (E) levels. Scale bars, 100 μm. *, P < 0.05; **, P < 0.01. Abbreviations: HCC, hepatocellular carcinoma; RT‐PCR, Real‐time PCR; DRP1, dynamin‐related protein 1; MFN1, mitofusin‐1; ACSL4, acyl‐CoA synthetase long‐chain family member 4; CPT1A, carnitine palmitoyl transferase 1A; CACT, carnitine‐acylcarnitine translocase; CPT2, carnitine palmitoyl transferase 2; ACOX1, acyl‐CoA oxidase 1
FIGURE 5
FIGURE 5
Mitochondrial fission suppresses fatty acid oxidation through downregulating PGC‐1α/PPARα signaling and its transcriptional targets. (A‐B) RT‐PCR (A) and Western blotting (B) analyses for mRNA and protein expression levels of PPARα and PGC‐1α in SNU‐368 cells with suppressed mitochondrial fission or in SNU‐739 cells with activated mitochondrial fission. (C) IHC analysis for correlation between mitochondrial fission (expression ratio of DRP1 to MFN1) and PGC‐1α expression in tumor tissues from 217 HCC patients. Scale bars, 100 μm. (D‐E) RT‐PCR (D) and Western blotting (E) analyses for the expression of key enzymes involved in fatty acid oxidation (CPT1A and ACOX1) in HCC cells with suppressed mitochondrial fission and PGC‐1α overexpression. (F) Fatty acid oxidation was determined by evaluation of the rate of 3H2O generation with 3H‐labeled oleic acid as a tracer in HCC cells with suppressed mitochondrial fission and PGC‐1α overexpression. (G‐H) RT‐PCR (G) and Western blotting (H) analyses for the expression of key enzymes involved in FAO (CPT1A and ACOX1) in mitochondrial fission‐suppressed HCC cells treated with PPARα agonist GW7647. (I) Fatty acid oxidation was determined by evaluating the rate of 3H2O generation with 3H‐labeled oleic acid as a tracer in mitochondrial fission‐suppressed HCC cells treated with PPARα agonist GW7647. (J) Intracellular levels of free fatty acids, triglycerides, and phospholipids were measured in mitochondrial fission‐suppressed HCC cells treated with PGC‐1α overexpression or PPARα agonist GW7647. *, P < 0.05. Abbreviations: HCC, hepatocellular carcinoma; RT‐PCR, Real‐time PCR; DRP1, dynamin‐related protein 1; MFN1, mitofusin‐1; PGC‐1α, peroxlsome proliferator‐activated receptor‐γ coactlvator‐1α; PPARα, perixisome proliferation‐activated receptor α; IHC, immunohistochemistry; CPT1A, carnitine palmitoyltransferase 1A; ACOX1, acyl‐CoA oxidase 1; DMSO, Dimethyl sulfoxide
FIGURE 6
FIGURE 6
Mitochondrial fission mediates fatty acid metabolic reprogramming though suppression of NAD+/SIRT1. (A‐B) The content of NAD+ (A) and activity of SIRT1 (B) were determined in SNU‐368 cells with suppressed mitochondrial fission or in SNU‐739 cells with activated mitochondrial fission. (C) The acetylation of SREBP1 and PGC‐1α was determined in HCC cells with treatment as indicated. (D) The acetylation of SREBP1 and PGC‐1α, as well as expression levels of ACC1, FASN, ELOVL6, CPT1A, and ACOX1, was determined in HCC cells treated with SIRT1 inhibitor EX‐527 or agonist resveratrol. (E‐G) Intracellular levels of free fatty acid, triglyceride, and phospholipid were measured in HCC cells treated with SIRT1 agonist resveratrol or inhibitor EX‐527. *, P < 0.05. Abbreviations: NAD, nicotinamide adenine dinucleotide; SIRT1, Sirtuin 1; SREBP1, sterol regulatory element‐ binding protein 1; PGC‐1α, peroxlsome proliferator‐activated receptor‐γ coactlvator‐1α; ACC1, acetyl coenzyme A carboxylase 1; FASN, fatty acid synthase; ELOVL6, elongation of very long chain FA protein 6; CPT1A, carnitine palmitoyl transferase 1A; ACOX1, acyl‐CoA oxidase 1; DMSO, Dimethyl sulfoxide; IP, immunoprecipitation; IB, immunoblotting
FIGURE 7
FIGURE 7
Mitochondrial fission promotes the growth and metastasis of HCC by reprogramming lipid metabolism. (A) Cell proliferation ability was determined by MTS assay in SNU‐368 cells treated as indicated. (B) Colony formation ability was determined in SNU‐368 cells treated as indicated. (C) Cell migration ability was determined by scratch wound healing assay in SNU‐368 cells treated as indicated. (D) Cell invasion ability was determined by transwell Matrigel invasion assay in SNU‐368 cells treated as indicated. Scale bars, 100 μm. (E) The growth curves of subcutaneous tumor xenografts established from SNU‐368 cells with DNML1 knockdown. (F) Tumor tissues were dissected from mice and their weights were compared. (G) Number of lung metastases in the two groups was compared. Scale bars, 100 μm. *, P < 0.05. Abbreviations: HCC, hepatocellular carcinoma; DRP1, dynamin‐related protein 1; SREBP1, sterol regulatory element‐ binding protein 1; PPARα, perixisome proliferation‐activated receptor α

References

    1. Cheng C, Geng F, Cheng X, Guo D. Lipid metabolism reprogramming and its potential targets in cancer. Cancer Commun (Lond). 2018;38(1):27. - PMC - PubMed
    1. Pope ED, 3rd , Kimbrough EO, Vemireddy LP, Surapaneni PK, Copland JA, 3rd , Mody K. Aberrant lipid metabolism as a therapeutic target in liver cancer. Expert Opin Ther Targets. 2019;23(6):473‐83. - PMC - PubMed
    1. Corbet C, Feron O. Emerging roles of lipid metabolism in cancer progression. Curr Opin Clin Nutr Metab Care. 2017;20(4):254‐60. - PubMed
    1. Luo X, Cheng C, Tan Z, Li N, Tang M, Yang L, Cao Y. Emerging roles of lipid metabolism in cancer metastasis. Mol Cancer. 2017;16(1):76. - PMC - PubMed
    1. Li Z, Kang Y. Lipid metabolism fuels cancer's spread. Cell Metab. 2017;25(2):228‐30. - PubMed

Publication types