. 2022 Jan 4;132(1):e147334.
doi: 10.1172/JCI147334.

The CD6/ALCAM pathway promotes lupus nephritis via T cell-mediated responses

Affiliations

The CD6/ALCAM pathway promotes lupus nephritis via T cell-mediated responses

Samantha A Chalmers et al. J Clin Invest. .

Abstract

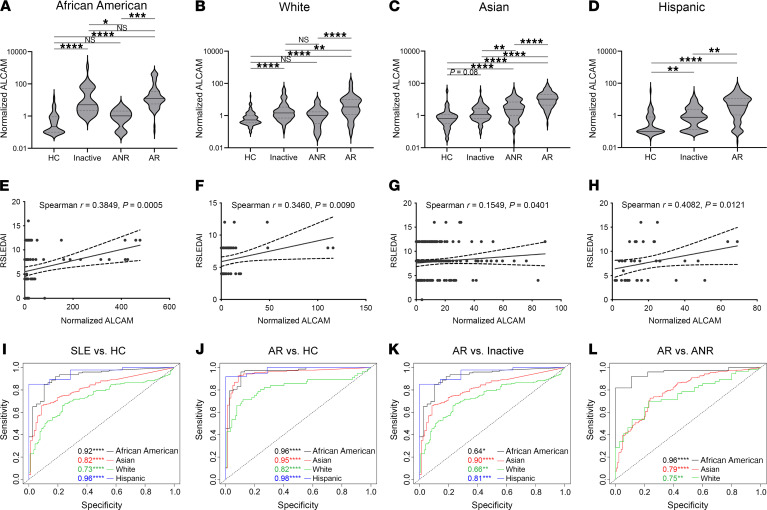
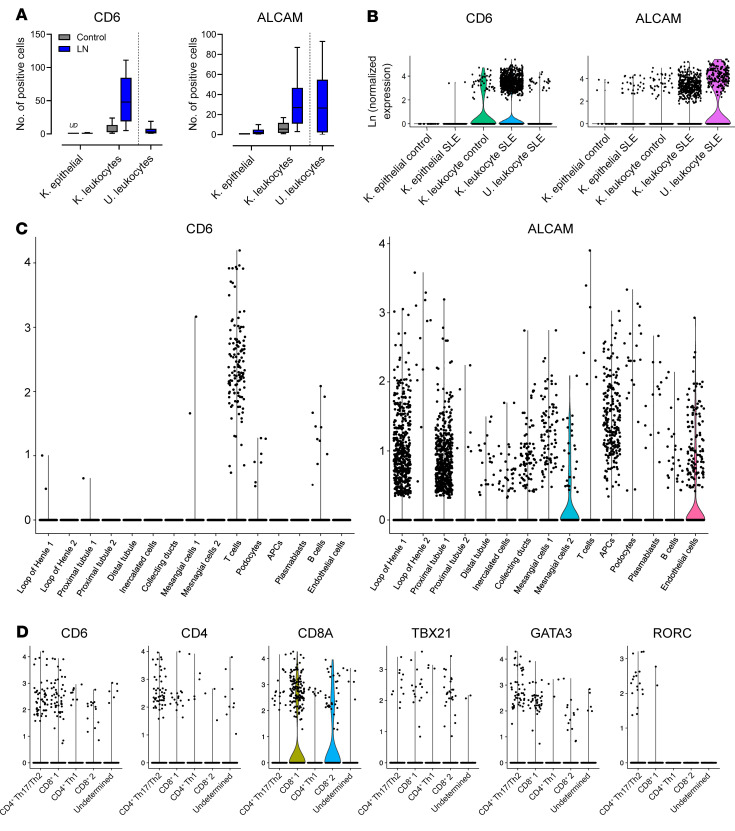
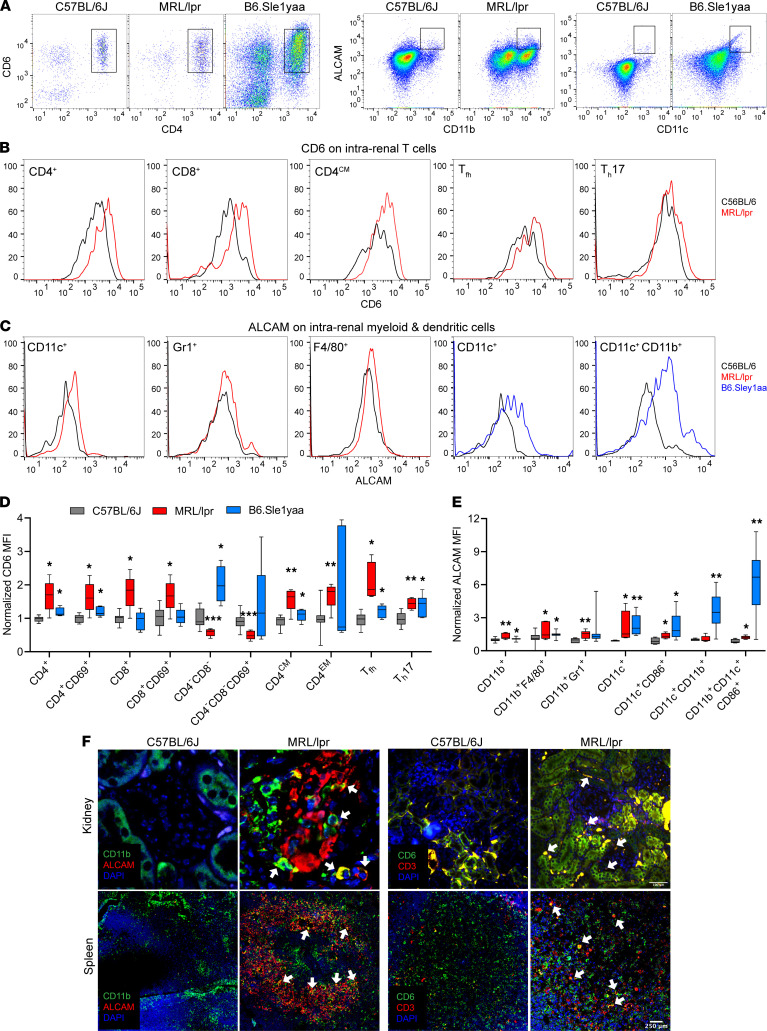
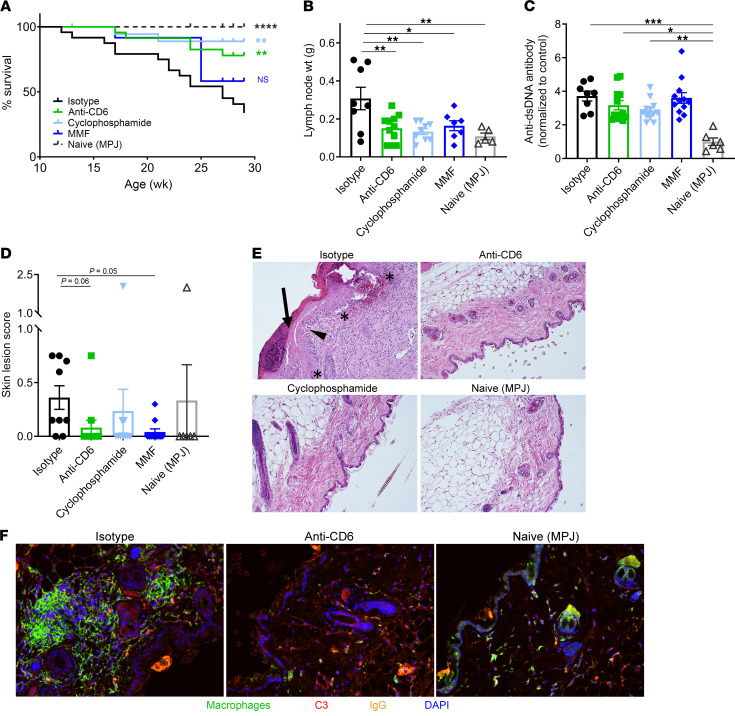
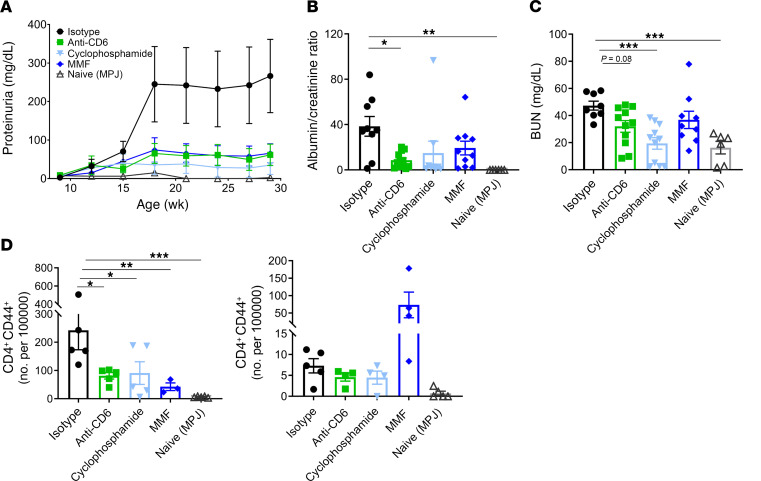
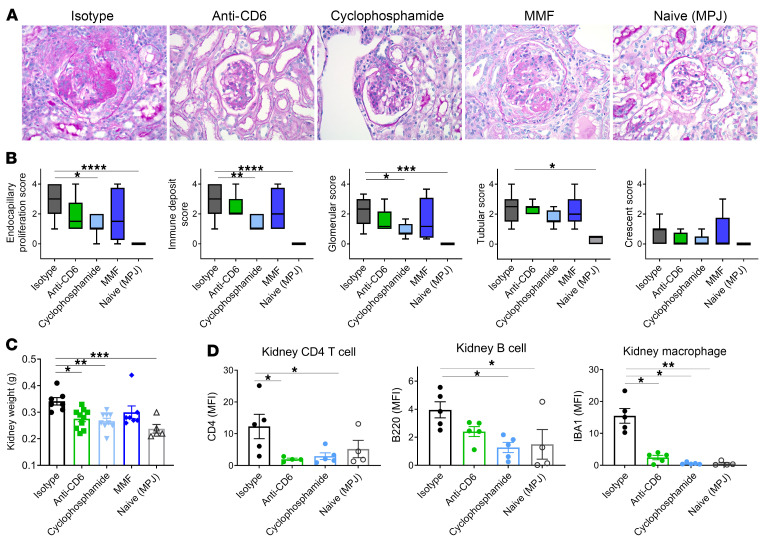
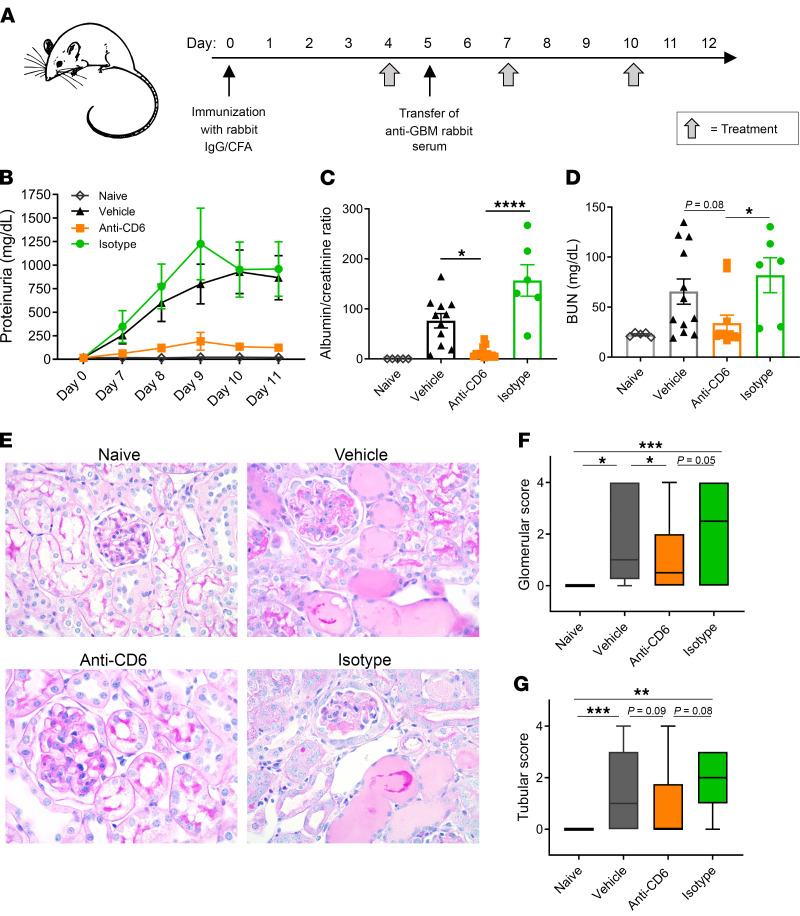
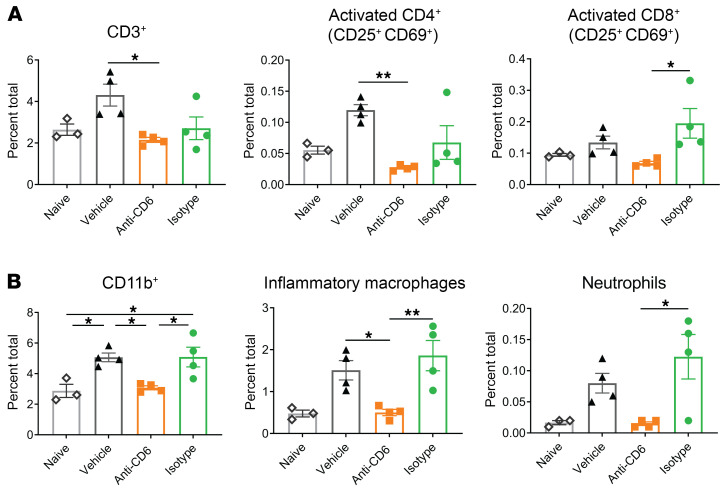
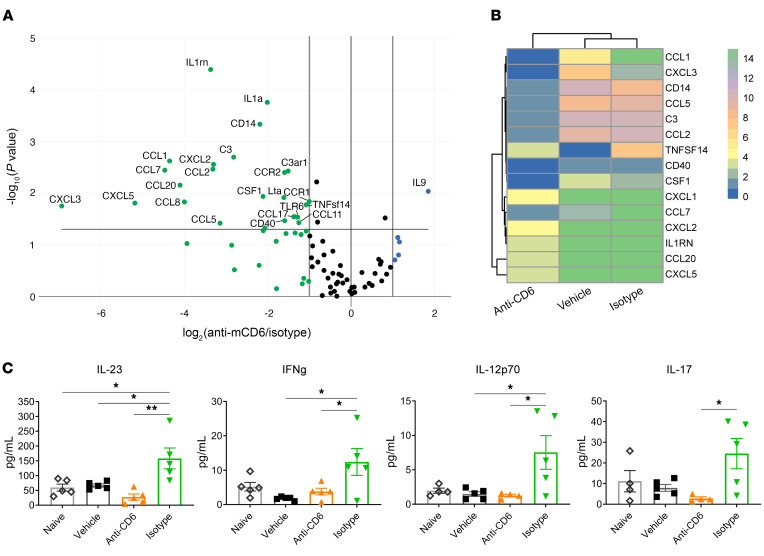
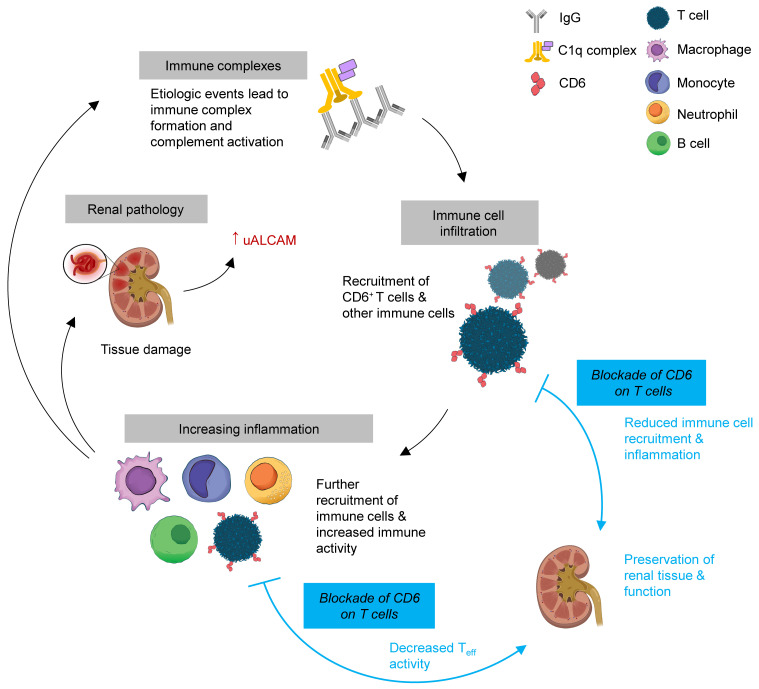
T cells are central to the pathogenesis of lupus nephritis (LN), a common complication of systemic lupus erythematosus (SLE). CD6 and its ligand, activated leukocyte cell adhesion molecule (ALCAM), are involved in T cell activation and trafficking. Previously, we showed that soluble ALCAM is increased in urine (uALCAM) of patients with LN, suggesting that this pathway contributes to disease. To investigate, uALCAM was examined in 1038 patients with SLE and LN from 5 ethnically diverse cohorts; CD6 and ALCAM expression was assessed in LN kidney cells; and disease contribution was tested via antibody blockade of CD6 in murine models of SLE and acute glomerulonephritis. Extended cohort analysis offered resounding validation of uALCAM as a biomarker that distinguishes active renal involvement in SLE, irrespective of ethnicity. ALCAM was expressed by renal structural cells whereas CD6 expression was exclusive to T cells, with elevated numbers of CD6+ and ALCAM+ cells in patients with LN. CD6 blockade in models of spontaneous lupus and immune-complex glomerulonephritis revealed significant decreases in immune cells, inflammatory markers, and disease measures. Our data demonstrate the contribution of the CD6/ALCAM pathway to LN and SLE, supporting its use as a disease biomarker and therapeutic target.

Keywords: Autoimmunity; Lupus.


Figures

Figure 1
Figure 1. Soluble uALCAM is elevated in subjects with active renal disease and correlates with disease severity.
uALCAM was assayed in 1038 individuals drawn from 4 ethnicities and 5 patient cohorts, as detailed in Supplemental Table 1, and normalized by urine creatinine levels. The demographics for the new patients included in this study are listed in Supplemental Table 2. The information pertaining to the other patients have already been published (–33). (AD) uALCAM levels differentiate disease states (healthy control [HC], inactive SLE [Inactive], active nonrenal SLE [ANR], active renal SLE [AR]) across multiple ethnicities: African American (A), White (B), Asian (C), and Hispanic (D). Data are presented as violin plots. (EG) Correlation of uALCAM with sum of the renal scores of the rSLEDAI, a clinical measure of LN activity and damage, in African American (E), White (F), Asian (G), and Hispanic (H) patients. (IL) ROC curves depicting the performance of uALCAM levels as a marker of disease state. The following comparisons were made: SLE vs. HC (I), AR vs. HC (J), AR vs. Inactive (K), AR vs. ANR (L). Comparisons between groups were performed using the Kruskal-Wallis test, while the correlation analysis was performed using Spearman correlation. ****P < 0.0001; ***P < 0.001; **P < 0.01; *P < 0.05.
Figure 2
Figure 2. CD6 and ALCAM are overexpressed in renal tissue of patients with LN.
A single-cell RNA-Seq data set derived from epithelial cells and leukocytes isolated from the kidney biopsies of 24 patients with LN and 9 control subjects and urine cells collected from patients with LN only was analyzed for CD6 and ALCAM expression. Cells from the patients of each respective disease state were combined for analysis. (A) Box and whisker plots representing 25th, 50th, and 75th percentiles ± min/max of the number of cells with detectable CD6 expression (left panel) and ALCAM expression (right panel) in LN and control. UD = undetected. Comparisons between groups performed by Mann-Whitney U test. **P < 0.01 for CD6 expression on K. leukocytes. (B) Single-cell expression levels of CD6 and ALCAM. (C) Violin plots depicting expression of CD6 (left panel) and ALCAM (right panel) within specific renal cell populations of patients with LN. Expression of CD6 is primarily elevated in T cells and expression of ALCAM is elevated in epithelial cells isolated from renal tissue of LN subjects. (D) Violin plots of coexpression of CD6 with markers of CD4, CD8, and T helper subsets, Th1 (TBX21), Th2 (GATA3), and Th17 (RORC) subsets.
Figure 3
Figure 3. Characterization of ALCAM and CD6 expression on immune cells in murine models of SLE.
Kidney cells from C57BL/6J (females, n = 8–14, 8–10 months old), MRL/lpr (females, n = 5–8, 8 months old) and B6.Sle1yaa (females, n = 7, 9–12 months old) were stained for CD6, ALCAM, and immune cell markers and then analyzed by flow cytometry to determine the CD166 and CD6 expression levels in various immune cell types. (A) Representative dot plots of CD4 versus CD6, pregated on CD3+ cells; CD11b versus ALCAM and CD11c versus ALCAM, pregated on live cells from C57BL/6J, MRL/lpr, and B6. Sle1yaa mice. (B) Representative histograms of C57BL/6J (black) and MRL/lpr (red) mice show CD6 expression on CD4+ and CD8+ T cells, CD4+ central memory T cells (CD62L+CD44+), CD4+ effector/effector memory T cells (CD62LCD44+), CD4+ naive T cells (CD62L+CD44), Tfh (CD45+CD4+CXCR5+PD1+) and Th17 cells (CD45+CD4+IL17a+). (C) Representative ALCAM histogram overlay for C57BL/6J (black), MRL/lpr (red) and B6. Sle1yaa (blue) mice showing granulocytes, macrophages, and CD11c+ and CD11c+/CD11b+ dendritic cells. (D) Normalized CD6 MFI of T cell subtypes were plotted for C57BL/6J (black) and MRL/lpr (red) and B6. Sle1yaa (blue). Data shown as standard box and whisker plots representing 25th, 50th, and 75th percentiles ± min/max. (E) CD166 MFI on myeloid and dendritic cells were normalized to C57BL/6J and plotted for C57BL/6J (black) and MRL/lpr (red) and B6. Sle1yaa (blue). (F) Kidney and spleen from MRL/lpr (left) or C57BL/6J (right) mice were stained for CD11b and CD166 or CD3 and CD6 and assessed by immunofluorescence microscopy. CD166 (red) expression was increased and colocalizes with CD11b+ (green) cells. CD6 (red) expression was increased in lupus mice kidney and colocalizes with CD3+ (green) cells. White arrow indicates colocalization. Images representative of 3–5 mice per group. Scale bar represents 100 mm for kidney and 250 mm for spleen. Comparisons between groups were done by Mann-Whitney U test. ***P < 0.001; **P < 0.01; *P < 0.05.
Figure 4
Figure 4. CD6 blockade improves survival and disease in MRL/lpr model of SLE.
Female MRL/lpr mice at 9 to 10 weeks of age were treated with either anti-CD6 monoclonal antibody (60 μg/dose, i.p. twice per week, n = 12), isotype control (60 μg/dose, i.p. twice per week, n = 12), cyclophosphamide (25 mg/kg, once per week, n = 12), or mycophenolate mofetil (MMF; 50 mg/kg, oral gavage daily, n = 12). A group of MRL/MpJ mice (n = 6), a congenic control strain, were included in the study. (A) Kaplan-Meier curve depicting survival by treatment group (n = 10–12 mice per group). (B) Lymphadenopathy as assessed by average of the weight of the left and right inguinal lymph nodes at termination. (C) Serum levels of anti-dsDNA autoantibodies as measured by ELISA. (D) Scoring of macroscopic skin lesions at termination (29 weeks). (E) Skin histopathology of treated MRL/lpr and MPJ control mice. Arrow points to hyperkeratosis, asterisks indicate damage of the dermal-epidermal junction, and black triangle points to large cellular infiltrates into the dermis. (F) Skin sections stained for IBA1 (green) to identify macrophages, C3 (red) to delineate complement, IgG (orange) to identify immune complexes, and DAPI (blue) to identify cell nuclei. Data are representative of 2 independent experiments. Bar graphs present mean ± SE. Comparisons between groups were evaluated using 1-way ANOVA with multiple-comparisons test against the isotype group. ***P < 0.001; **P < 0.01; *P < 0.05 versus isotype.
Figure 5
Figure 5. CD6 blockade improves renal function in MRL/lpr model of SLE.
Female MRL/lpr mice at 9 to 10 weeks of age were treated with either anti-CD6 monoclonal antibody (60 μg/dose, i.p. twice per week, n = 12), isotype control (60 μg/dose, i.p. twice per week, n = 12), cyclophosphamide (25 mg/kg, once per week, n = 12), or mycophenolate mofetil (MMF; 50 mg/kg, oral gavage daily, n = 12). A group of MRL/MpJ mice (n = 6), a congenic control strain, were included in the study. (A) Longitudinal proteinuria as measured by uristix. (B) Terminal urine albumin/creatinine ratio and (C) BUN levels. (D) Detection of renal-infiltrating CD44+ CD4+ and CD8+ T cells by flow cytometry. Data are presented as mean ± SE and are representative of 2 independent experiments. Comparisons between groups were evaluated using 1-way ANOVA with multiple-comparisons test against the isotype group. ****P < 0.0001; ***P < 0.001; **P < 0.01; *P < 0.05 versus isotype.
Figure 6
Figure 6. Anti-CD6 treatment inhibits renal pathology in the MRL/lpr model of SLE.
Female MRL/lpr mice at 9 to 10 weeks of age were treated with either anti-CD6 monoclonal antibody (60 μg/dose, i.p. twice per week, n = 12), isotype control (60 μg/dose, i.p. twice per week, n = 12), cyclophosphamide (25 mg/kg, once per week, n = 12), or mycophenolate mofetil (MMF; 50 mg/kg, oral gavage daily, n = 12). A group of MRL/MpJ mice (n = 6), a congenic control strain, were included in the study. (A) Images of H&E sections from kidney of treated MRL/lpr and MPJ control mice. Magnification is 400×. (B) Pathology scores of H&E sections as scored by a blinded pathologist. Glomerular scores were assigned based on crescents, endocapillary hypercellularity, and immune material deposition while tubular scores were assigned based on casts/dilatation and interstitial inflammation. Scoring data are presented as box and whisker plots representing 25th, 50th, and 75th percentiles ± min/max. (C) Kidney weight at termination. Inflammation results in increased tissue weight. (D) Detection of CD4, B220, and IBA1 in immunofluorescently stained kidney sections. Data are presented as mean ± SE. All data represent 2 independent experiments. Comparisons between groups were evaluated using 1-way ANOVA with multiple-comparisons test against the isotype group. ***P < 0.001; **P < 0.01; *P < 0.05 versus isotype.
Figure 7
Figure 7. CD6 blockade inhibits immune complex–mediated renal damage.
NTN was induced in female 129/SvJ mice at 10 weeks of age. Mice were immunized with rabbit IgG and CFA on day 0 to generate mouse anti–rabbit antibodies. At day 5, mice received nephrotoxic rabbit serum, which then cross-reacted with the mouse anti–rabbit antibodies, causing an antibody-mediated nephritis. Beginning day 4, mice were treated 3 times per week with anti-mouse CD6 (60 μg/dose; n = 12), vehicle control (n = 12), or isotype control (n = 6). Healthy mice (immunized with rabbit IgG, but not given nephrotoxic serum) were also included as a nondisease control (n = 5). (A) Schematic of the experimental design. (B) Longitudinal proteinuria as measured by uristix. Terminal urine albumin/creatinine ratio (C) and (D) serum BUN levels. Data are presented as mean ± SE. (E) Histological sections of renal tissue were scored blindly by a nephropathologist on a scale of 0–4. (F) Glomerular sections were assessed by scoring endocapillary proliferation, crescents, and immune deposits. (G) Tubular scores were determined by scoring tubular casts and interstitial inflammation. Scoring data are presented as box and whisker plots depicting 25th, 50th, and 75th percentiles ± min/max. All data are representative of 2 independent experiments. Comparisons between groups were evaluated using 1-way ANOVA with multiple-comparisons test. ****P < 0.0001; ***P < 0.001; **P < 0.01; *P < 0.05.
Figure 8
Figure 8. Anti-CD6–treated NTN mice exhibit decreased renal infiltration of inflammatory immune cells.
NTN was induced in female 129/SvJ mice at 10 weeks of age. Mice were immunized with rabbit IgG and CFA on day 0 to generate mouse anti–rabbit antibodies. At day 5, mice received nephrotoxic rabbit serum, which then cross-reacted with the mouse anti–rabbit antibodies, causing an antibody-mediated nephritis. Beginning day 4, mice were treated 3 times per week with anti–mouse CD6 (60 μg/dose; n = 12), vehicle control (n = 12), or isotype control (n = 5). Healthy mice (immunized with rabbit IgG, but not given nephrotoxic serum) were also included as a nondisease control (n = 6). At day 11 to 12, mice were sacrificed and kidneys were harvested to examine the prevalence of immune cells by flow cytometry. (A) Prevalence of CD3+ and activated (CD25+ CD69+) CD4+ and CD8+ T cells in renal tissue. (B) Prevalence of CD11b+ monocytes, inflammatory macrophages (CD11b+F4/80loLy6Chi), and neutrophils (CD11b+GR1hi). Data are presented as mean ± SE and represent 2 independent experiments. Comparisons between groups were evaluated using 1-way ANOVA with multiple-comparisons test. ****P < 0.0001; ***P < 0.001; **P < 0.01; *P < 0.05.
Figure 9
Figure 9. Blockade of CD6 decreases expression of inflammatory cytokines/chemokines.
NTN was induced in female 129/SvJ mice at 10 weeks of age. Mice were immunized with rabbit IgG and CFA on day 0 to generate mouse anti–rabbit antibodies. At day 5, mice received nephrotoxic rabbit serum, which then cross-reacted with the mouse anti–rabbit antibodies, causing an antibody-mediated nephritis. Beginning day 4, mice were treated 3 times per week with anti–mouse CD6 (60 μg/dose; n = 12), vehicle control (n = 12), or isotype control (n = 5). Healthy mice (immunized with rabbit IgG, but not given nephrotoxic serum) were also included as a nondisease control (n = 6). At day 11 to 12, mice were sacrificed and kidneys were harvested to analyze RNA and protein levels of inflammatory markers. (A) Volcano plot of results of PCR array examining expression of 86 genes associated with inflammation in RNA isolated from kidneys of anti-CD6– and isotype-treated mice. (B) Heat map of genes that differed by more than 3-fold between isotype- and anti-CD6–treated mice. (C) Protein levels of select genes (IL-23, IFN-γ, IL-12p70, and IL-17) in renal tissue, as quantitated by flow-based ELISA. Data represent mean ± SE. Comparisons between groups were evaluated using 1-way ANOVA with multiple-comparisons test. **P < 0.01; *P < 0.05.
Figure 10
Figure 10. Schematic of CD6/ALCAM blockade in immune complex–mediated glomerulonephritis.
Lupus autoantibodies bind to resident renal cells leading to immune-complex formation in the kidney and, subsequently, complement activation. Initial renal injury leads to recruitment of immune cells to the kidney including CD6+ T cells. The T cells release inflammatory cytokines that induce further recruitment of immune cells, including more T cells, monocytes, inflammatory macrophages, neutrophils, and B cells. Increased inflammation results in tissue damage, pathology, and release of ALCAM into the urine. The continued inflammation further exposes renal tissue to autoreactive antibodies, which continues the inflammatory cycle. Blockade of CD6 on T cells inhibits activation of T cells and their function, resulting in reduced inflammatory cytokines and chemokines, and thereby, reductions in immune cell recruitment.

Comment in

  • CD6 is a therapeutic target for LN.
    Phillips R. Phillips R. Nat Rev Rheumatol. 2022 Mar;18(3):125. doi: 10.1038/s41584-022-00756-w. Nat Rev Rheumatol. 2022. PMID: 35136210 No abstract available.

Similar articles

Cited by

References

    1. Almaani S, et al. Update on lupus nephritis. Clin J Am Soc Nephrol. 2017;12(5):825–835. doi: 10.2215/CJN.05780616. - DOI - PMC - PubMed
    1. Kyttaris VC, Tsokos GC. Targeting lymphocyte signaling pathways as a therapeutic approach to systemic lupus erythematosus. Curr Opin Rheumatol. 2011;23(5):449–453. doi: 10.1097/BOR.0b013e328349a242. - DOI - PMC - PubMed
    1. Suárez‑Fueyo A, et al. T cells in systemic lupus erythematosus. Curr Opin Immunol. 2016;43:32–38. doi: 10.1016/j.coi.2016.09.001. - DOI - PMC - PubMed
    1. Tilstra JS, et al. Kidney-infiltrating T cells in murine lupus nephritis are metabolically and functionally exhausted. J Clin Invest. 2018;128(11):4884–4897. doi: 10.1172/JCI120859. - DOI - PMC - PubMed
    1. Crispín JC, et al. Expanded double negative T cells in patients with systemic lupus erythematosus produce IL-17 and infiltrate the kidneys. J Immunol. 2008;181(12):8761–8766. doi: 10.4049/jimmunol.181.12.8761. - DOI - PMC - PubMed

Publication types