. 2022 Mar 1;135(5):jcs258644.
doi: 10.1242/jcs.258644. Epub 2022 Jan 31.

HDLs extract lipophilic drugs from cells

Affiliations

HDLs extract lipophilic drugs from cells

Adi Zheng et al. J Cell Sci. .

Abstract

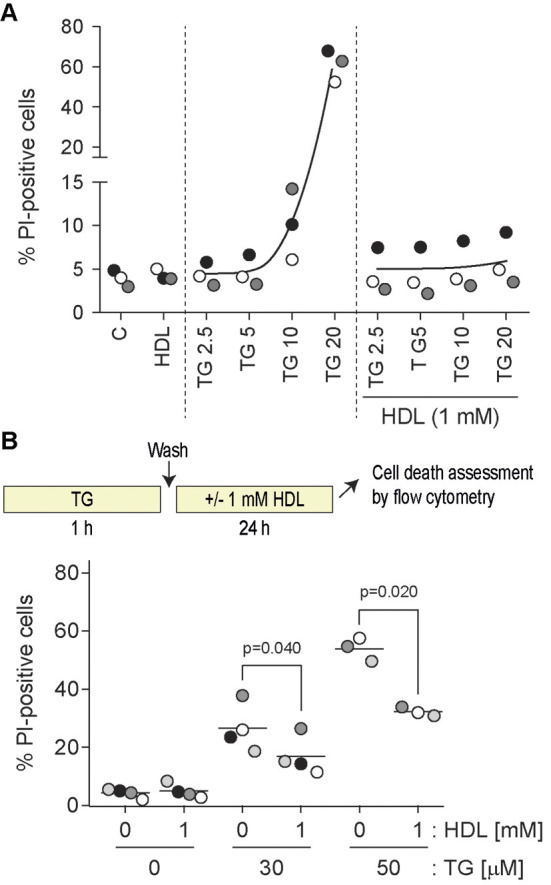
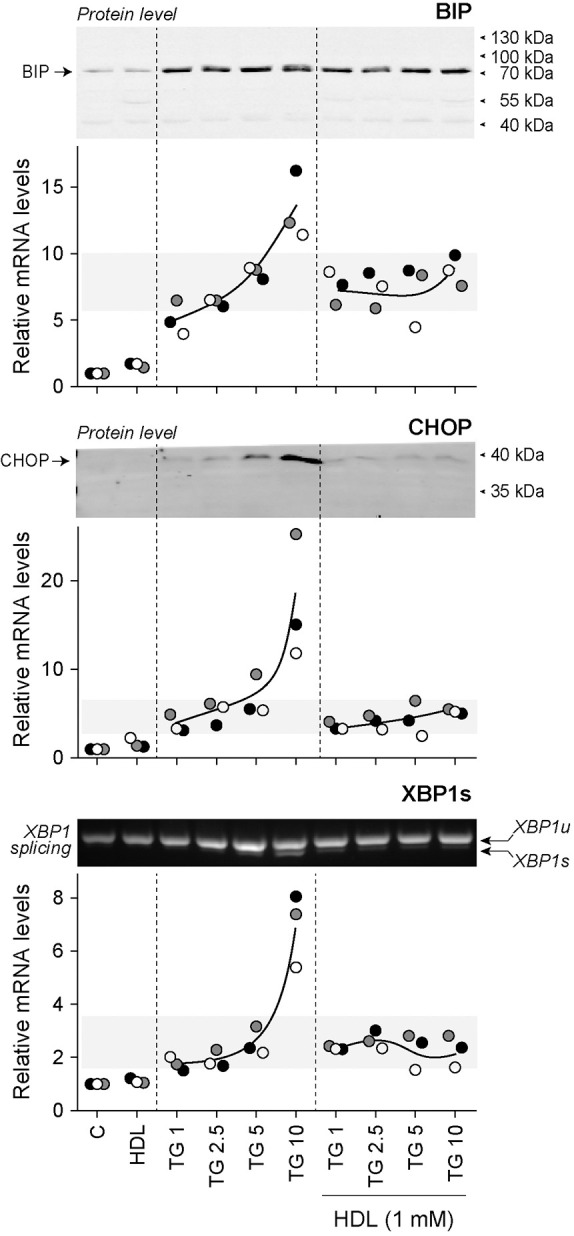
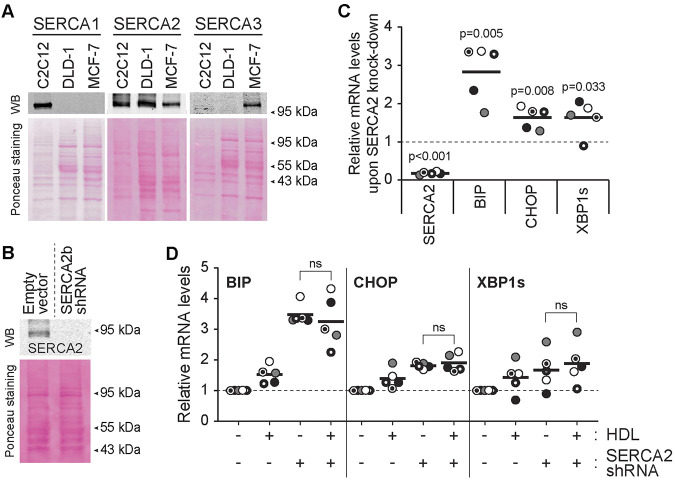
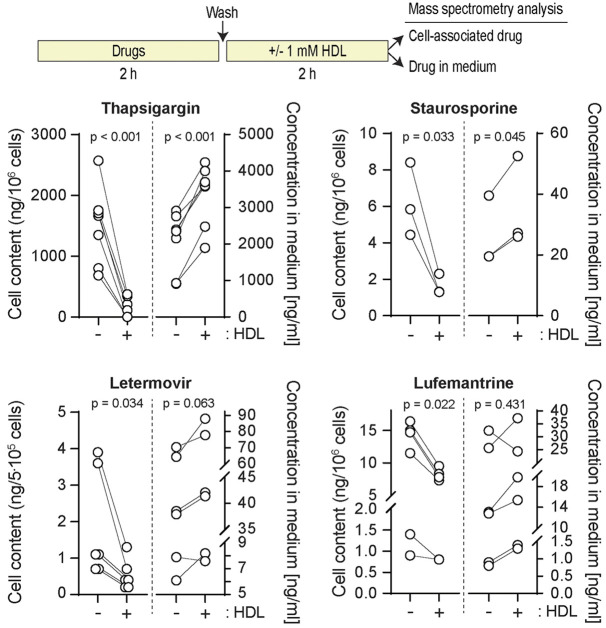
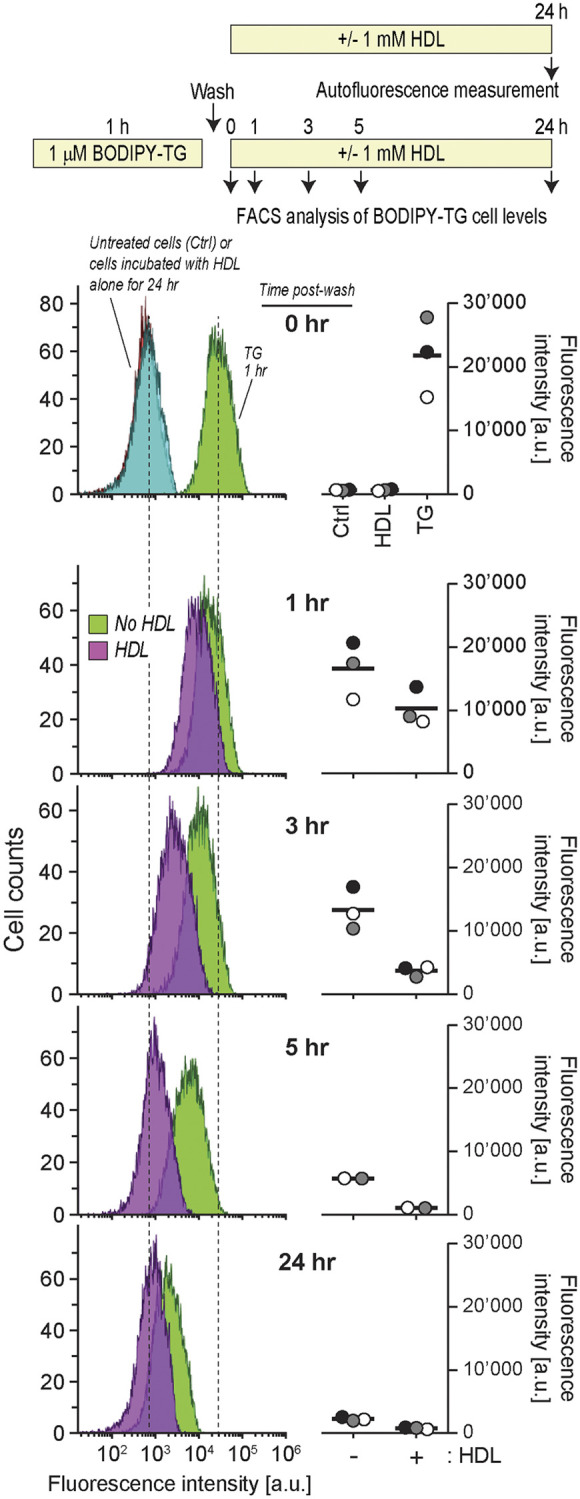
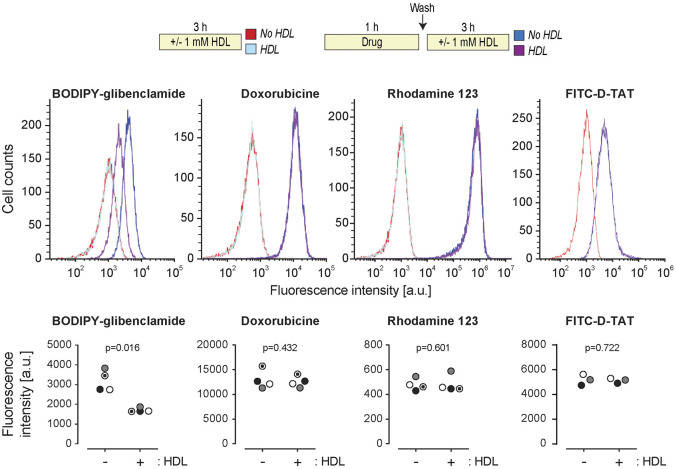
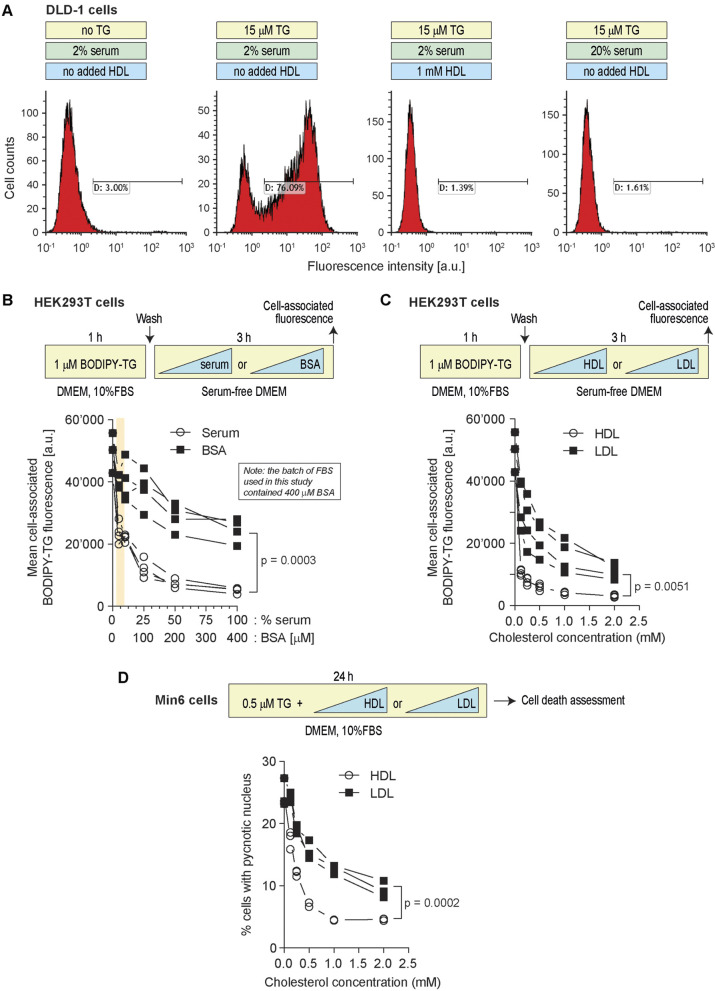
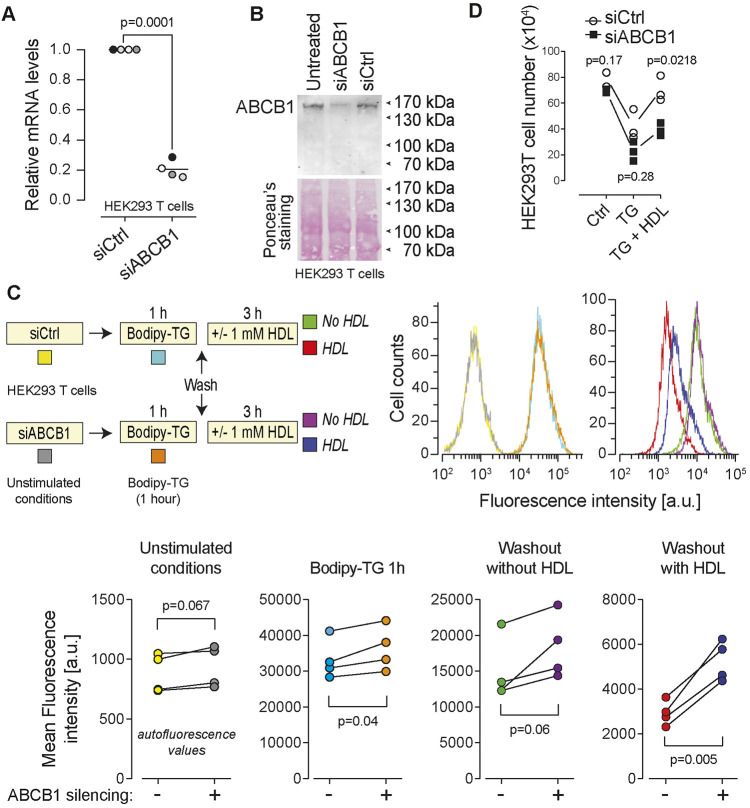
High-density lipoproteins (HDLs) prevent cell death induced by a variety of cytotoxic drugs. The underlying mechanisms are however still poorly understood. Here, we present evidence that HDLs efficiently protect cells against thapsigargin (TG), a sarco/endoplasmic reticulum (ER) Ca2+-ATPase (SERCA) inhibitor, by extracting the drug from cells. Drug efflux could also be triggered to some extent by low-density lipoproteins and serum. HDLs did not reverse the non-lethal mild ER stress response induced by low TG concentrations or by SERCA knockdown, but HDLs inhibited the toxic SERCA-independent effects mediated by high TG concentrations. HDLs could extract other lipophilic compounds, but not hydrophilic substances. This work shows that HDLs utilize their capacity of loading themselves with lipophilic compounds, akin to their ability to extract cellular cholesterol, to reduce the cell content of hydrophobic drugs. This can be beneficial if lipophilic xenobiotics are toxic but may be detrimental to the therapeutic benefit of lipophilic drugs such as glibenclamide.

Keywords: Cell death; Doxorubicin; Drug efflux; Glibenclamide; HDL; High-density lipoprotein; Rhodamine 123; Staurosporine; Thapsigargin.


Conflict of interest statement

Competing interests The authors declare no competing or financial interests.

Figures

Fig. 1.
Fig. 1.
HDL-mediated inhibition of TG-induced cell death. (A) DLD-1 cells were seeded in six-well plates (100,000 per well). After 24 h, cells were treated for 48 h with the indicated concentrations (in µM) of TG in the presence or in the absence of HDLs. Cell death was measured by flow cytometry following PI staining. Symbols with a given shade of gray are derived from a given independent experiment. The black curves go through the average values of the different experiments. (B) DLD-1 cells were seeded in six-well plates (100,000 per well). After 24 h, cells were pre-treated 1 h with the indicated concentrations of TG (in µM). Cells were washed once with PBS and then incubated or not with 1 mM HDLs for an additional 24 h period at which time cell death was assessed by PI incorporation using flow cytometry. P-values were calculated using a one-way ANOVA with a post-hoc Dunnett's multiple comparison test.
Fig. 2.
Fig. 2.
HDLs inhibit ER stress marker expression induced by high TG concentrations. DLD-1 cells were seeded in 6-well plates (200,000 per well). After 24 h, cells were treated for 24 h with the indicated concentrations (in µM) of TG in the presence or in the absence of HDLs. The mRNA levels of UPR proteins (BIP, CHOP and XBP1s) were measured by qRT-PCR. The corresponding BIP and CHOP protein levels assessed by western blotting are shown above the graphs. The extent of XBP1 splicing is presented above the XBP1s mRNA quantitation graph. The RT-PCR data are from three independent experiments (each labeled with different symbols). Western blots and XBP1 splicing assessment were performed two or three times with similar results (only one representative blot is shown). XBP1u, unspliced XBP1 mRNA; XBP1s, spliced XBP1 mRNA.
Fig. 3.
Fig. 3.
HDLs do not alleviate the stress response mediated by SERCA knockdown. (A) SERCA1, SERCA2 and SERCA3 expression in DLD-1 cells was assessed by western blotting. C2C12 and MCF-7 cell lysates were used as positive controls for SERCA1 and SERCA3, respectively. (B) Knockdown efficiency of SERCA2 in DLD-1 cells. (C) The mRNA expression of SERCA2 and ER stress markers (BIP, CHOP and XBP1s) in SERCA2-knockdown cells. (D) Effect of HDLs on the induction of ER stress marker mRNA expression induced by SERCA2 knockdown. In panels C and D, the results are normalized to the expression values obtained in untreated cells (dashed line). Symbols with a given shape and shading are derived from a given independent experiment. The black lines correspond to the mean. P-values were calculated with a two-tailed paired t-test; ns, not significant.
Fig. 4.
Fig. 4.
HDLs extract hydrophobic drugs from cells. DLD1 cells (500,000 cells) plated in six-well plates were treated 24 h later as depicted in the scheme above the figure (also see Materials and Methods) using the following concentrations: thapsigargin, 20 µM; staurosporine, 100 nM; letermovir and lumefantrine, 1 µg/ml. The cell-associated drug content and the drug found in the medium were then quantitated as described in the Materials and Methods. The data correspond to 4–7 replicates coming from two or three independent experiments. For the letermovir and lufemantrine graph, two independent experiments (two replicates each) were performed several weeks apart using the same drug stocks. Drug degradation may account for the lower signal obtained for the last two replicates. P-values were calculated with a two-tailed paired t-test.
Fig. 5.
Fig. 5.
Kinetics of spontaneous and HDL-mediated TG cell release. Min6 cells (300,000 cells per well) were seeded in six-well plates and cultured overnight. After treatment with 1 μM BODIPY–TG for 1 h, cells were washed with PBS once and then incubated with medium or HDLs for the indicated periods of time before their drug content was analyzed by flow cytometry. In the ‘0 hr’ panel, the autofluorescence of untreated cells and cells incubated with HDLs alone for 24 h are also shown (the two corresponding distributions fully overlap), as well as the profile of TG–BODIPY-incubated cells right after the washing step. The peak autofluorescence of the cells and the peak fluorescence intensity of 1 h TG–BODIPY-incubated cells are indicated by dashed lines. The quantification of two or three independent experiments (labeled with different symbols) is depicted on the right-hand side of the flow cytometry graphs. The latter are derived from the experiment corresponding to the gray symbols. The bars represent the mean of the cytometry distribution profiles. a.u., arbitrary units.
Fig. 6.
Fig. 6.
Effect of HDLs on BODIPY-glibenclamide, doxorubicin hydrochloride, rhodamine 123 and FITC-D-TAT efflux. HeLa cells (120,000 per well) were plated in six-well plates. Then cells were treated as indicated in the scheme above the graphs (drug concentrations: BODIPY-glibenclamide, 1 μM; doxorubicine, 10 μM; Rhodamine 123, 5 μM; FITC-D-TAT, 10 μM). Drug-associated fluorescence in cells was assessed by flow cytometry. The quantification (mean of the cytometry distribution profiles) of three or four independent experiments (labeled with different symbols) is depicted below the flow cytometry profiles. P-values were calculated with a two-tailed paired t-test. a.u., arbitrary units.
Fig. 7.
Fig. 7.
Serum components other than HDLs can extract TG from cells but less efficiently than HDLs. (A) DLD-1 cells (100,000 cells per well) were treated as indicated in the scheme above the panel. Cell death (%) was measured by PI staining (section indicated with D). (B) HEK293T cells (150,000 cells per well) were treated first 1 h with 1 µM BODIPY–TG in DMEM with 10% FBS and then 3 h with increasing concentrations of serum or BSA in serum-free DMEM. The concentrations of BSA were chosen as to correspond to those found in serum (i.e. 0.4 mM BSA in 100% serum). Cell-associated BODIPY–TG levels were assessed by flow cytometry. (C) Alternatively, instead of being incubated with serum or BSA, HEK293T cells were treated with increasing concentrations of HDLs or LDLs. The data are represented based on cholesterol content. (D) Min6 cells (300,000 cells per well) were seeded in six-well plates for 24 h. Then cells were treated with 0.5 µM TG in the presence of increasing concentrations of the indicated lipoproteins for 24 h. Cell death was assessed by determining the percentage of cells with pycnotic nuclei. P-values were calculated with a two-way ANOVA. a.u., arbitrary units.
Fig. 8.
Fig. 8.
ABCB1 participates in HDL-mediated BODIPY-TG efflux. HEK293T cells (80,000 per well of 12-well plates) were cultured overnight and then transfected with a control siRNA pool (siCtrl) that does not target any human mRNAs and a siRNA pool directed at ABCB1 (siABCB1). The cells were analyzed 72 h post-transfection. (A,B) Knockdown efficiency at the RNA level was evaluated by RT-PCR (A) and at the protein level by western blotting (B). (C) Control and ABCB1-silenced cells were incubated with 1 μM BODIPY–TG and HDLs as indicated in the scheme. Cell-associated fluorescence was then assessed by flow cytometry. The quantification of four independent experiments is depicted below the flow cytometry profiles. (D) Alternatively, at 48 h post transfection, the cells were treated with 20 µM TG for 24 h in the absence or in the presence of 1 mM HDLs. Cells remaining attached to the plates (viable cells) were counted using light microscopy. P-values were calculated with a two-tailed paired t-test. a.u., arbitrary units.

References

    1. Almazroo, O. A., Miah, M. K. and Venkataramanan, R. (2017). Drug Metabolism in the Liver. Clin. Liver Dis. 21, 1-20. 10.1016/j.cld.2016.08.001 - DOI - PubMed
    1. Baker, M. E. (1998). Albumin's role in steroid hormone action and the origins of vertebrates: is albumin an essential protein? FEBS Lett. 439, 9-12. 10.1016/S0014-5793(98)01346-5 - DOI - PubMed
    1. Barter, P., Gotto, A. M., LaRosa, J. C., Maroni, J., Szarek, M., Grundy, S. M., Kastelein, J. J. P., Bittner, V., Fruchart, J.-C. and Treating to New Targets Investigators. (2007). HDL cholesterol, very low levels of LDL cholesterol, and cardiovascular events. N. Engl. J. Med. 357, 1301-1310. 10.1056/NEJMoa064278 - DOI - PubMed
    1. Cavelier, C., Lorenzi, I., Rohrer, L. and von Eckardstein, A. (2006). Lipid efflux by the ATP-binding cassette transporters ABCA1 and ABCG1. Biochim. Biophys. Acta 1761, 655-666. 10.1016/j.bbalip.2006.04.012 - DOI - PubMed
    1. Chaudhary, J., Bower, J. and Corbin, I. R. (2019). Lipoprotein drug delivery vehicles for cancer: rationale and reason. Int. J. Mol. Sci. 20, 6327. 10.3390/ijms20246327 - DOI - PMC - PubMed

Publication types

MeSH terms