. 2022 Jan 15;135(2):jcs258687.
doi: 10.1242/jcs.258687. Epub 2022 Jan 25.

Isoform-dependent lysosomal degradation and internalization of apolipoprotein E requires autophagy proteins

Affiliations

Isoform-dependent lysosomal degradation and internalization of apolipoprotein E requires autophagy proteins

Gianna M Fote et al. J Cell Sci. .

Abstract

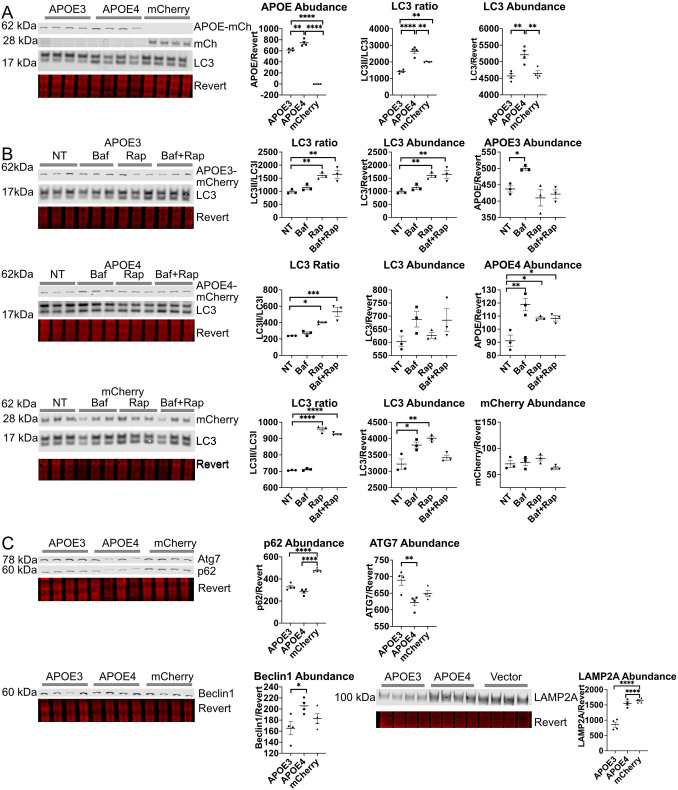
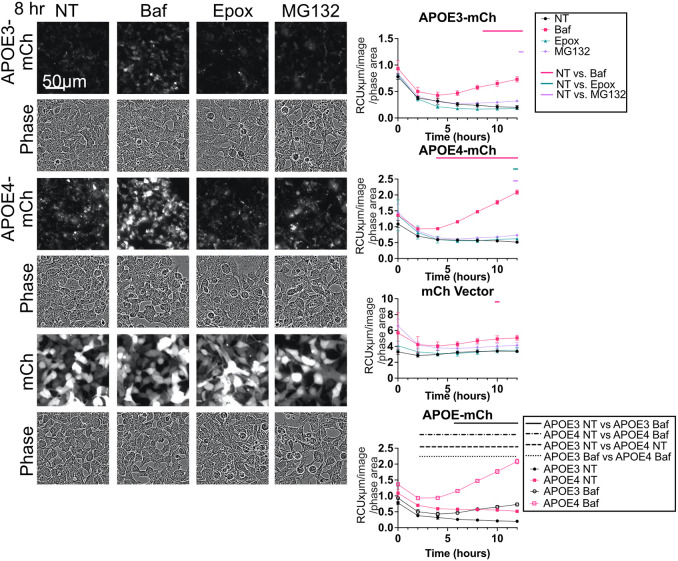
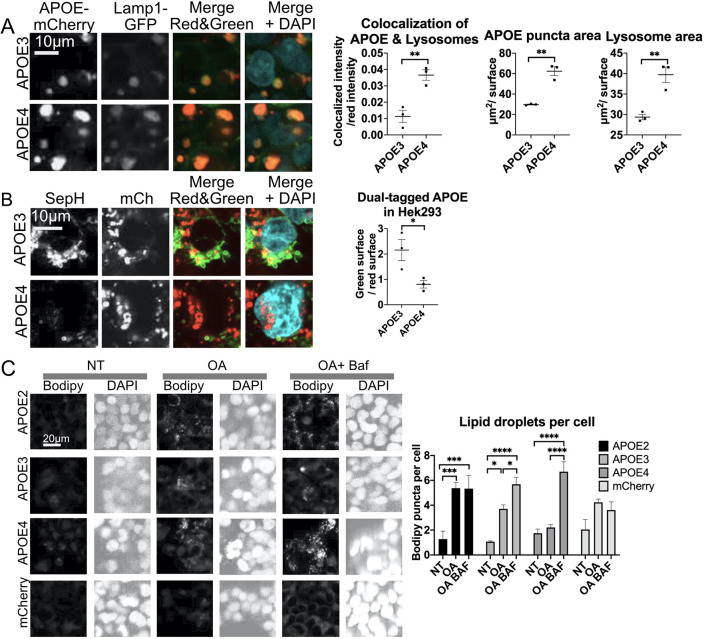
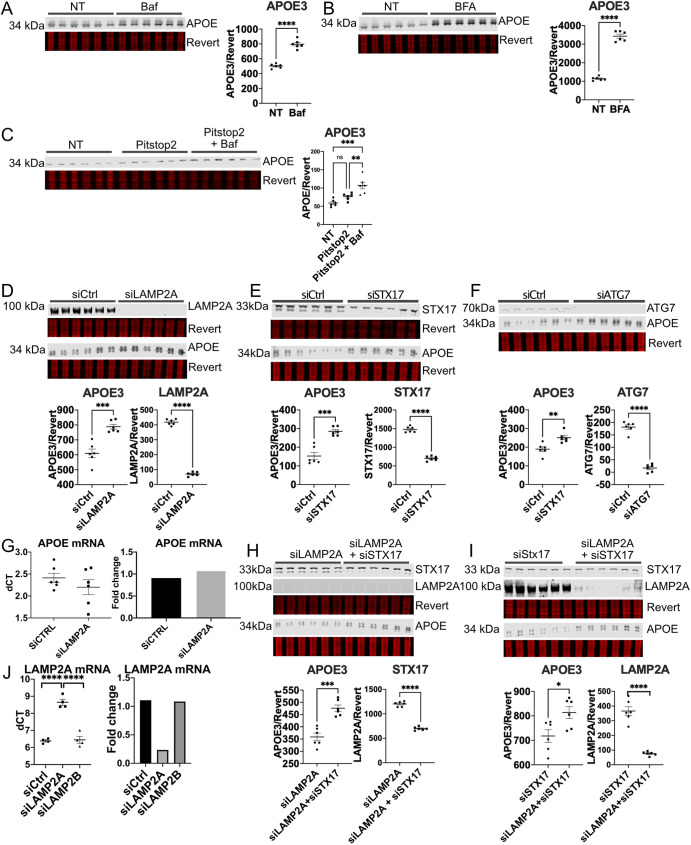
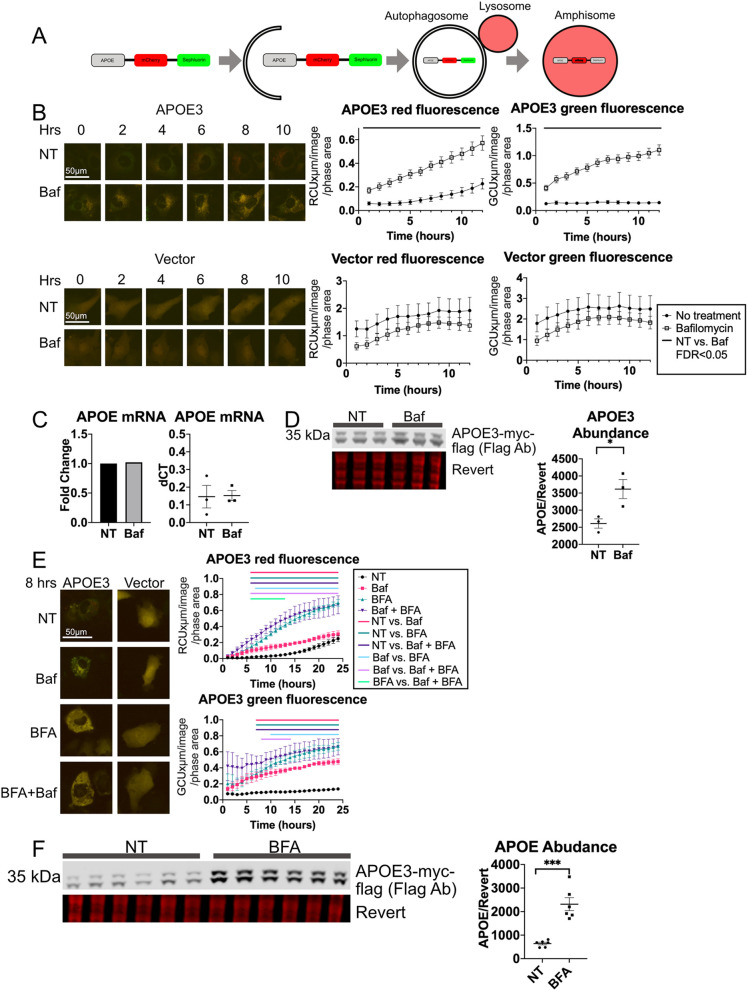
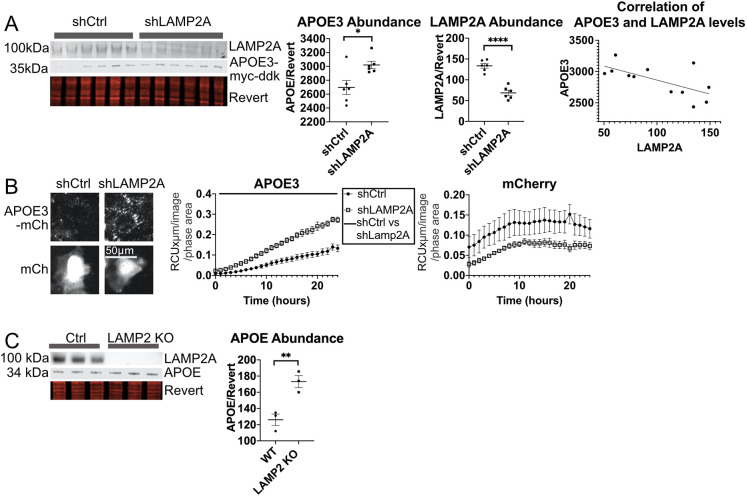
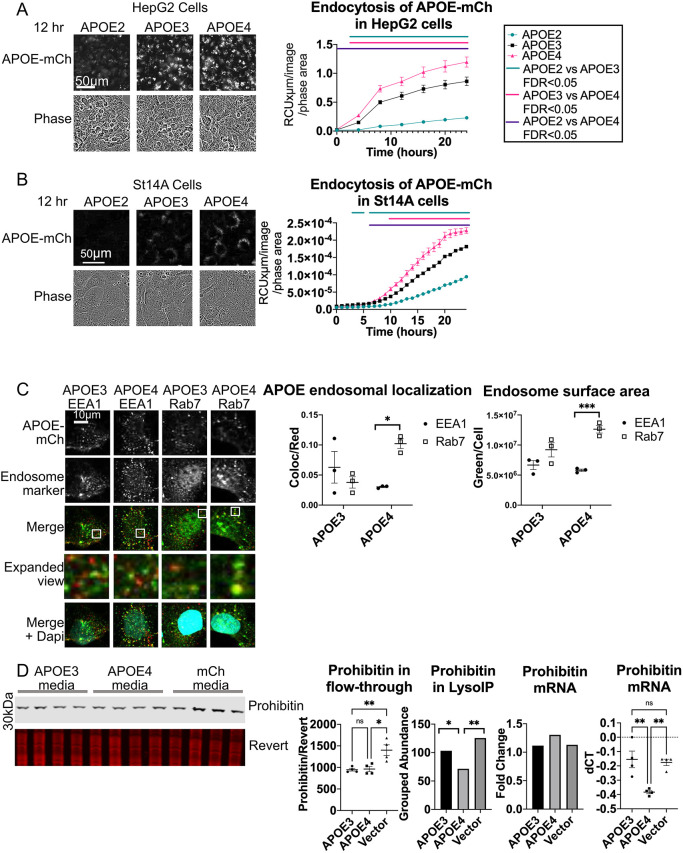
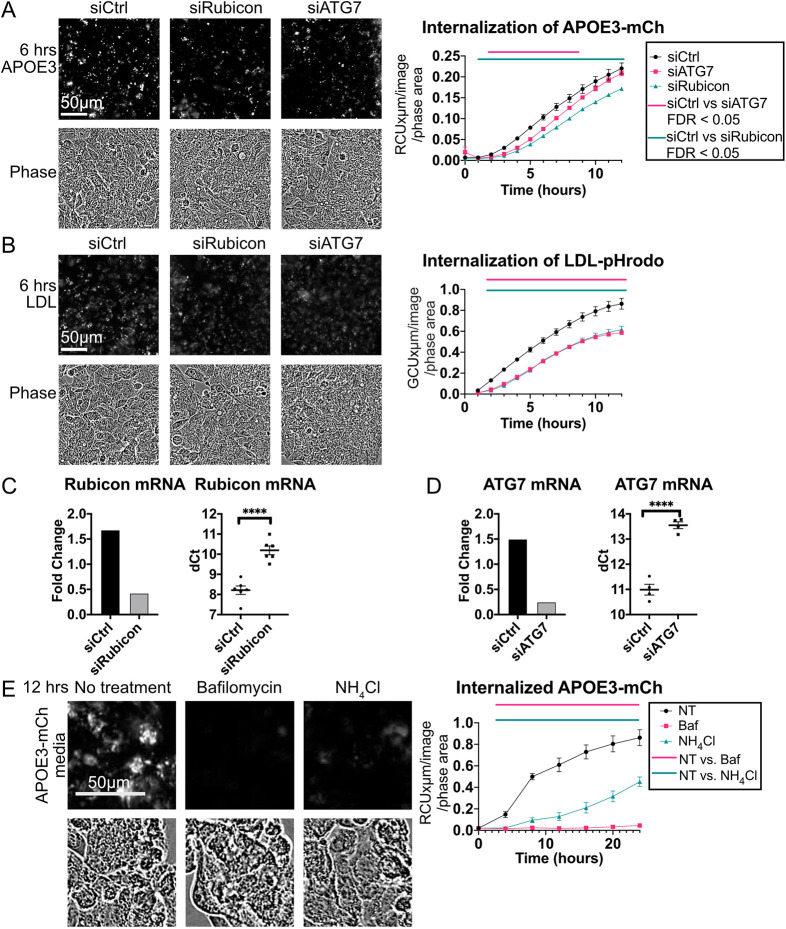
The human apolipoprotein E4 isoform (APOE4) is the strongest genetic risk factor for late-onset Alzheimer's disease (AD), and lysosomal dysfunction has been implicated in AD pathogenesis. We found, by examining cells stably expressing each APOE isoform, that APOE4 increases lysosomal trafficking, accumulates in enlarged lysosomes and late endosomes, alters autophagic flux and the abundance of autophagy proteins and lipid droplets, and alters the proteomic contents of lysosomes following internalization. We investigated APOE-related lysosomal trafficking further in cell culture, and found that APOE from the post-Golgi compartment is degraded through autophagy. We found that this autophagic process requires the lysosomal membrane protein LAMP2 in immortalized neuron-like and hepatic cells, and in mouse brain tissue. Several macroautophagy-associated proteins were also required for autophagic degradation and internalization of APOE in hepatic cells. The dysregulated autophagic flux and lysosomal trafficking of APOE4 that we observed suggest a possible novel mechanism that might contribute to AD pathogenesis. This article has an associated First Person interview with the first author of the paper.

Keywords: APOE; APOE4; Alzheimer's disease; Chaperone-mediated autophagy; LC3-associated endocytosis.


Conflict of interest statement

Competing interests The authors declare no competing or financial interests.

Figures

Fig. 1.
Fig. 1.
APOE4 alters autophagic flux in in HEK293 cells stably expressing fluorescently tagged APOE. (A,C) HEK293 cells expressing APOE3–mCh or APOE4–mCh or mCh vector were analyzed by western blotting. (B) HEK293 cells stably expressing APOE3–mCh, APOE4–mCh, or mCh vector were treated with Baf and analyzed as for A and C (50 nM 4 h), Rap (10 nM 4 h) or both. Quantitative results are mean±s.e.m. Revert, protein stain; NT, no treatment. *P<0.05, **P<0.01, ****P<0.0001 (one-way ANOVA with multiple comparisons correction).
Fig. 2.
Fig. 2.
APOE is turned over by autophagy in HEK293 cells with stable APOE expression. Representative images and fluorescence intensity of APOE3–mCh, APOE4–mCh, or mCh cells treated with Baf (50 nM 4 h), Epox (100 nM), or MG132 (50 µM). Quantitative results are mean±s.e.m. Bars over graphs indicate time points at which P<0.05 on two-way ANOVA with post-hoc Dunnett test.
Fig. 3.
Fig. 3.
APOE4 colocalizes with enlarged lysosomes. (A) HEK293 cells stably expressing APOE3– or APOE4–mCh (red) and transfected with CellLight Lamp1–GFP (green), and stained with DAPI (blue). (B) HEK293 cells stably expressing APOE3– or APOE4–mCh–SepH. SepH shown in green. (C) HEK293 cells expressing APOE2, APOE3, APOE4 or vector were treated with oleic acid (OA, overnight) and Baf (4 h). NT, no treatment. Quantitative results are mean±s.e.m. In A–C, three wells were imaged per APOE isoform (three images per well) by confocal microscopy. Images were analyzed using Imaris software. Quantitative results are mean±s.e.m. *P<0.05, **P<0.01, ***P<0.001, ****P<0.0001 [Student's two-tailed unpaired t-test (A,B) or one-way ANOVA with a post-hoc Tukey–Kramer test (C)].
Fig. 4.
Fig. 4.
APOE degradation requires autophagy proteins in HepG2 cells. (A) HepG2 cells were treated with Baf (50 nM, 4 h) and analyzed by western blotting. (B) HepG2 cells were treated with BFA (5 μg/ml, 4 h). (C) HepG2 cells were treated with BFA and Baf and analyzed by western blotting. (D–F) HepG2 cell siRNA knockdown of (D) LAMP2A (E) STX17 or (F) ATG7 and analyzed by western blotting. siCtrl, control siRNA. (G) qPCR of HepG2 cells with siRNA against LAMP2A. (H,I) HepG2 cells with siRNA knockdown of LAMP2A, STX17, or both were analyzed by western blotting. (J) qPCR of LAMP2A or LAMP2B in HepG2 cells following LAMP2A siRNA. Revert, protein stain; NT, no treatment. *P<0.05, **P<0.01, ***P<0.001, ****P<0.0001 [Student's two-tailed unpaired t-test was used in western blot analysis, one-way ANOVA with post-hoc Tukey–Kramer test was used for qPCR].
Fig. 5.
Fig. 5.
APOE transiently overexpressed in ST14A cells is degraded by LAMP2A-dependent autophagy. (A) Schematic of dual-tag fluorescent APOE with quenching of green SepHluorin in lysosomes. (B) APOE3–mCh–SepH and mCh–SepH tag fluorescence intensity in ST14A cells with Baf (50 nM, 4 h). (C) APOE3 mRNA in ST14A cells expressing APOE3–Myc–flag with Baf treatment. (D) APOE3–Myc–Flag abundance in ST14A cells following Baf treatment (4 h 50 nM). (E) APOE3–mCh–SepH fluorescence intensity following BFA (5 μg/ml) treatment. (F) ST14A cells expressing APOE3-myc-flag and treated with BFA (5 μg/ml, 4 h) were analyzed by western blotting. Quantitative results are mean±s.e.m. Revert, protein stain; NT, no treatment. *P<0.05, ***P<0.001 [Student's unpaired two-tailed t-test was used (D); bars above graphs indicate time points at which FDR<0.05 by two-way ANOVA with post-hoc Tukey–Kramer test (B,E)].
Fig. 6.
Fig. 6.
LAMP2A is required for autophagy of APOE3 in ST14A cells. (A,B) ST14A cells were co-transfected with shRNA targeting LAMP2A and (A) APOE3–Myc–Flag or (B) APOE3–mCh, and APOE3 levels were assessed by western blot or fluorescence intensity. shCtrl, control shRNA. Bars above graph in B indicates time points at which FDR<0.05 by two-way ANOVA. (C) APOE levels in mouse brain tissue from 2-year-old wild-type and LAMP2 knockout mice. Quantitative results are mean±s.e.m. *P<0.05, **P<0.01, ****P<0.0001 [Student's two-tailed unpaired t-test (A,C)].
Fig. 7.
Fig. 7.
Fluorescently tagged APOE is endocytosed in an isoform-dependent manner and alters endosomal morphology. (A,B) APOE–mCh-conditioned medium was collected from HEK293T cells and applied to (A) HepG2 and (B) ST14A cells. Cells were imaged and red fluorescence/phase area calculated. Bars represent times when FDR<0.05 between APOE isoforms by two-way ANOVA. (C) ST14A cells were treated for 24 h with conditioned medium with APOE3–mCh or APOE4–mCh (red), and immunocytochemistry for EEA1 or Rab7 (green) was performed, and cells stained with DAPI (blue). Cells were imaged by confocal microscopy and analyzed using Imaris image. Magnified view indicates enlarged images from white boxes in merge panel. (D) HepG2 cells were treated for 24 h with APOE3–mCh or APOE4–mCh conditioned medium, lysosomes were immunoprecipitated and proteomic contents analyzed by mass spectrometry. Proteins reduced in APOE4 lysosomes that were not reduced in mCh-treated cells included mitochondrial proteins such as prohibitin. Western blot analysis for prohibitin was performed on lyso-depleted flow-through. Revert, protein stain. HepG2 cells treated with APOE-mCh conditioned medium were also analyzed by qPCR. Quantitative results are mean±s.e.m. *P<0.05, **P<0.01, ***P<0.001; ns, not significant (one-way ANOVA with Tukey–Kramer test).
Fig. 8.
Fig. 8.
Knockdown of Rubicon or ATG7 reduces APOE internalization. (A,B) ATG7 and Rubicon were knocked down using siRNA in HepG2 cells, and (A) conditioned medium with APOE3–mCh or (B) medium containing LDL-pHrodo was applied. siCtrl, control siRNA. (C,D) HepG2 cells with siRNA knockdown of (C) ATG7 or (D) Rubicon were analyzed by qPCR. (E) HepG2 cells were treated with inhibitors and APOE3–mCh conditioned medium. Concentrations of inhibitors used were: 50 nM Bafilomycin A1, 20 mM ammonium chloride. NT, no treatment. Cells were imaged and fluorescence quantified by incucyte. Imaging and fluorescence quantification by incucyte. Quantitative results are mean±s.e.m. ****P<0.0001 [Student's two-tailed unpaired t-test (C,D); bars represent times when FDR<0.05 between APOE isoforms by two-way ANOVA with a post-hoc Dunnett's test (A,B,E)]

References

    1. Abondio, P., Sazzini, M., Garagnani, P., Boattini, A., Monti, D., Franceschi, C., Luiselli, D. and Giuliani, C. (2019). The genetic variability of APOE in different human populations and its implications for longevity. Genes (Basel) 10, 222. 10.3390/genes10030222 - DOI - PMC - PubMed
    1. Abu-Remaileh, M., Wyant, G. A., Kim, C., Laqtom, N. N., Abbasi, M., Chan, S. H., Freinkman, E. and Sabatini, D. M. (2017). Lysosomal metabolomics reveals V-ATPase- and mTOR-dependent regulation of amino acid efflux from lysosomes. Science (80-.) 358, 807-813. 10.1126/science.aan6298 - DOI - PMC - PubMed
    1. Alsabeeh, N., Chausse, B., Kakimoto, P. A., Kowaltowski, A. J. and Shirihai, O. (2018). Cell culture models of fatty acid overload: Problems and solutions. Biochim. Biophys. Acta Mol. Cell Biol. Lipids 1863, 143-151. 10.1016/j.bbalip.2017.11.006 - DOI - PMC - PubMed
    1. Ashok, A. and Hegde, R. S. (2009). Selective processing and metabolism of disease-causing mutant prion proteins. PLoS Pathog. 5, e1000479. 10.1371/journal.ppat.1000479 - DOI - PMC - PubMed
    1. Bennet, A. M., Di Angelantonio, E., Ye, Z., Wensley, F., Dahlin, A., Ahlbom, A., Keavney, B., Collins, R., Wiman, B., De Faire, U.et al. (2007). Association of apolipoprotein e genotypes with lipid levels and coronary risk. J. Am. Med. Assoc. 298, 1300-1311. 10.1001/jama.298.11.1300 - DOI - PubMed

Publication types