. 2022 Mar 2;110(5):841-856.e6.
doi: 10.1016/j.neuron.2021.12.002. Epub 2022 Jan 3.

Make war not love: The neural substrate underlying a state-dependent switch in female social behavior

Affiliations

Make war not love: The neural substrate underlying a state-dependent switch in female social behavior

Mengyu Liu et al. Neuron. .

Abstract

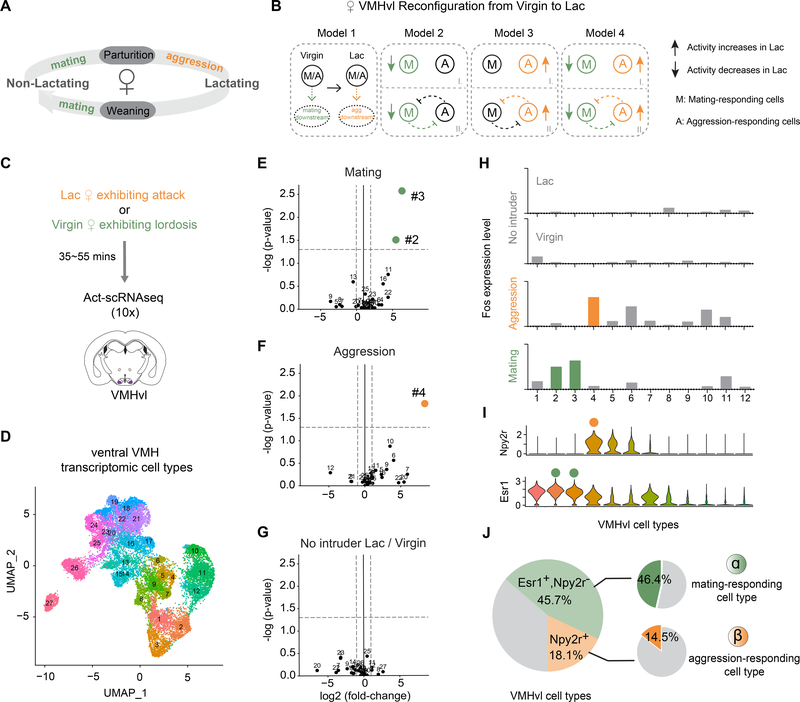
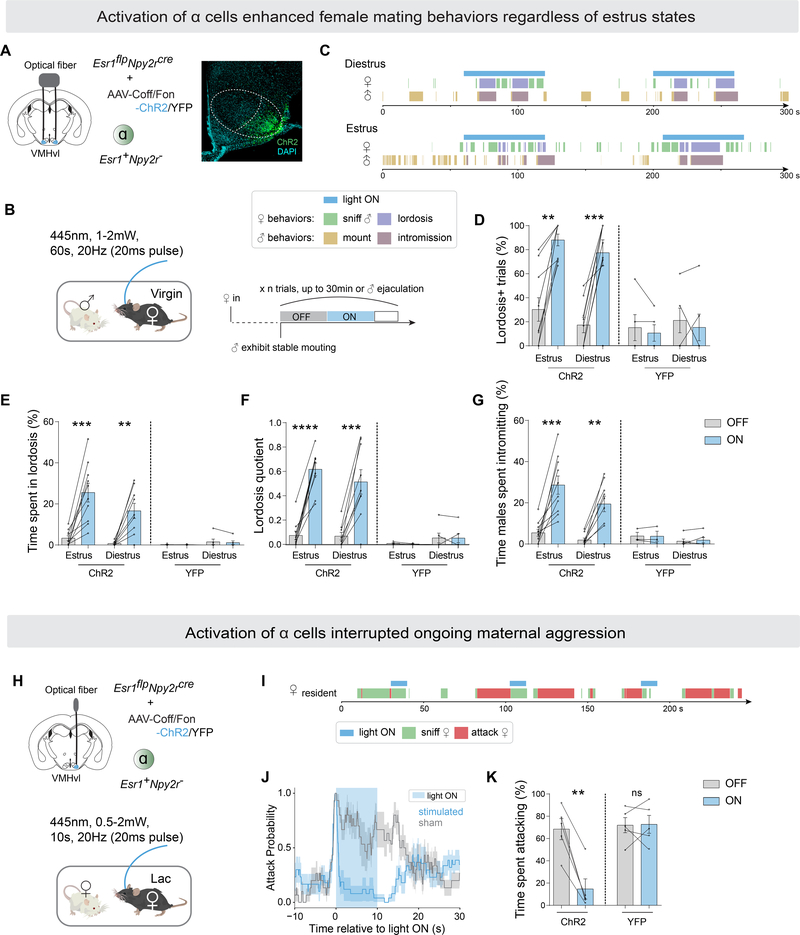
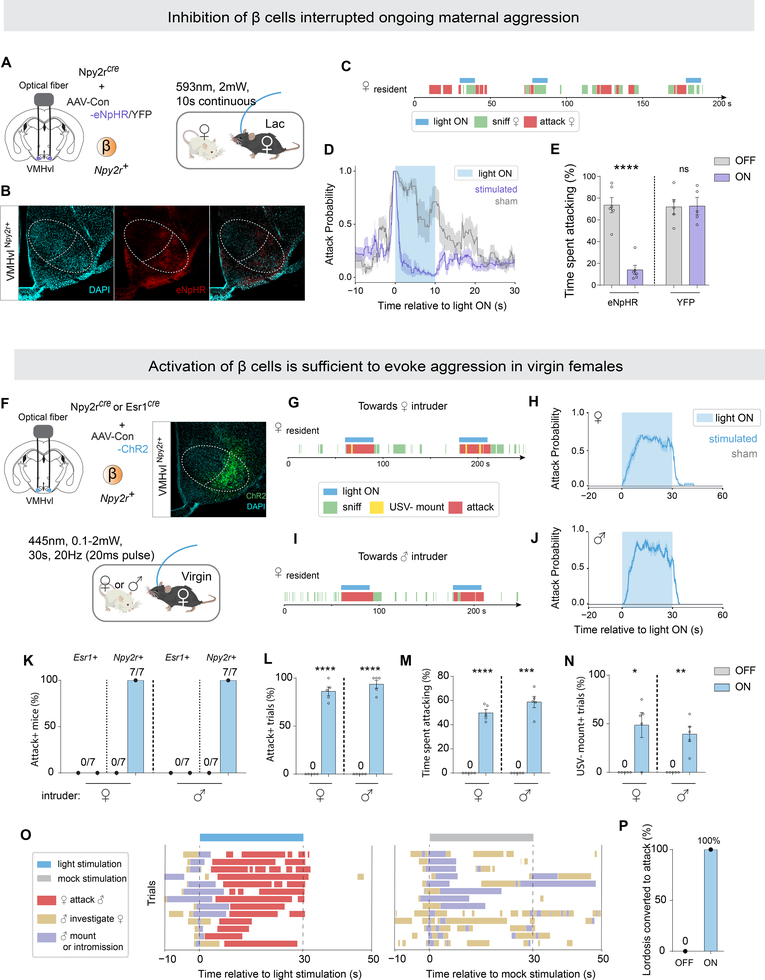
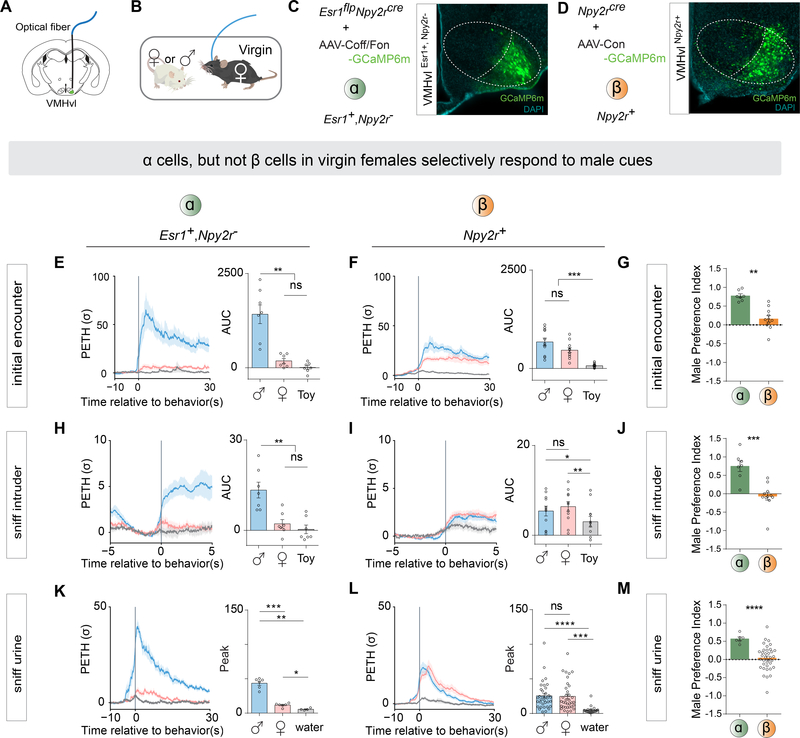
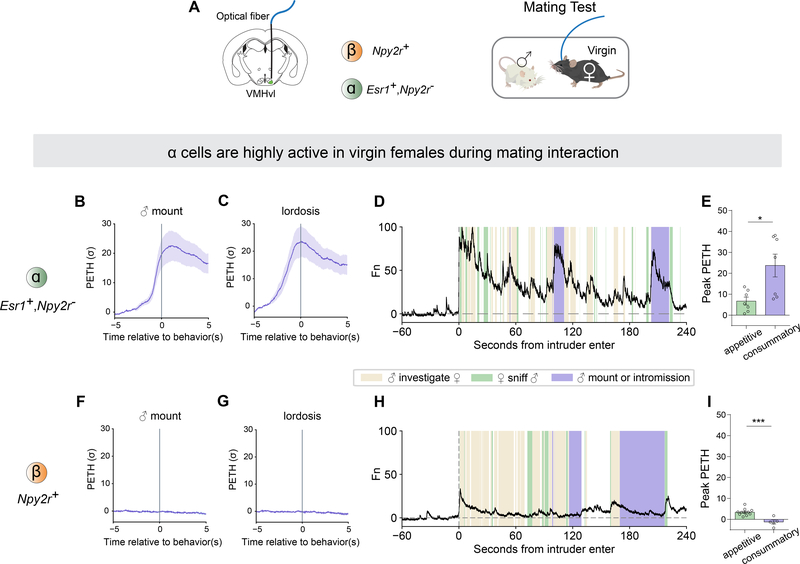
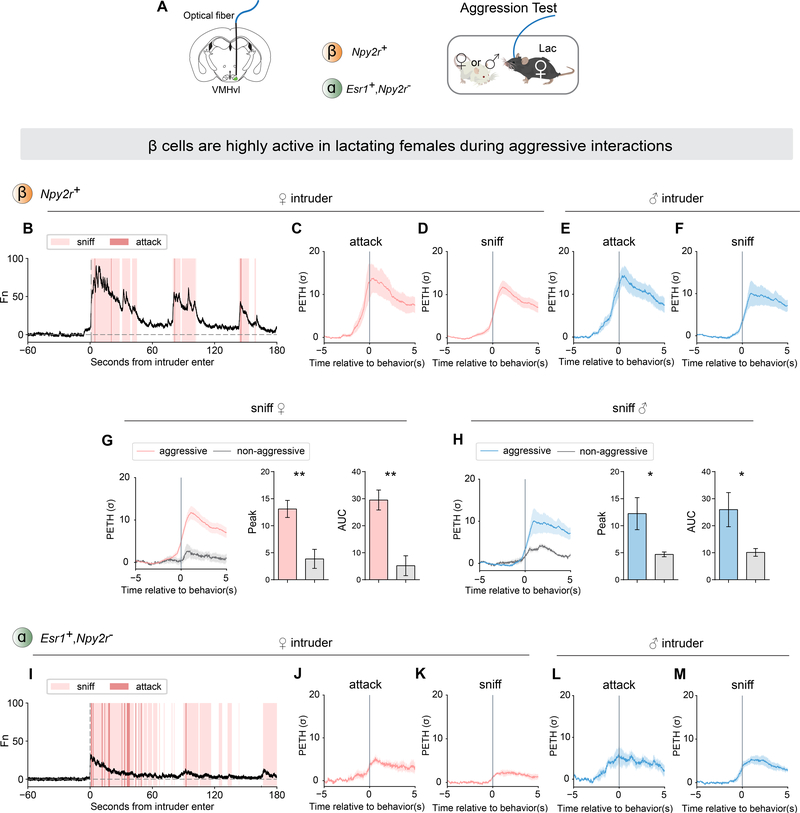
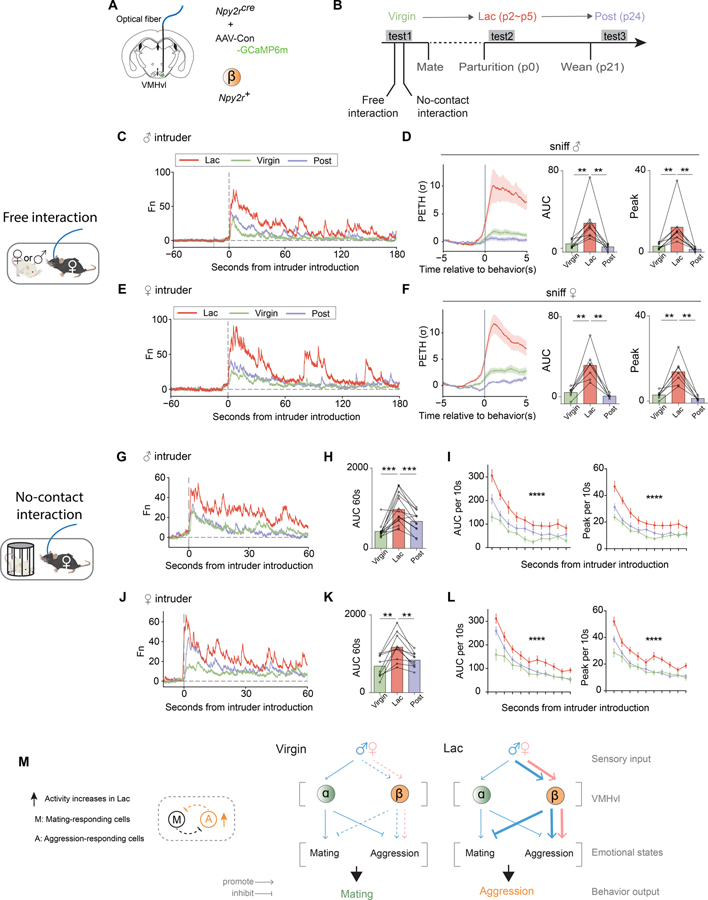
Female mice exhibit opposing social behaviors toward males depending on their reproductive state: virgins display sexual receptivity (lordosis behavior), while lactating mothers attack. How a change in reproductive state produces a qualitative switch in behavioral response to the same conspecific stimulus is unknown. Using single-cell RNA-seq, we identify two distinct subtypes of estrogen receptor-1-positive neurons in the ventrolateral subdivision of the female ventromedial hypothalamus (VMHvl) and demonstrate that they causally control sexual receptivity and aggressiveness in virgins and lactating mothers, respectively. Between- and within-subject bulk-calcium recordings from each subtype reveal that aggression-specific cells acquire an increased responsiveness to social cues during the transition from virginity to maternity, while the responsiveness of the mating-specific population appears unchanged. These results demonstrate that reproductive-state-dependent changes in the relative activity of transcriptomically distinct neural subtypes can underlie categorical switches in behavior associated with physiological state changes.

Keywords: activity-dependent scRNAseq; female mice; internal state; maternal aggression; sexual receptivity; social behavior; state-dependent neural plasticity; ventromedial hypothalamus.


Conflict of interest statement

Declaration of interests The authors declare no competing interests. D.J.A. is a member of the journal’s advisory board.

Figures

Figure 1.
Figure 1.
Distinct VMH transcriptomic cell types are activated during female mating and aggression. (A) Female mice adjust social behaviors according to their lactation cycle. The start of the lactating phase is always accompanied by a decrease in sexual behaviors and an onset of aggressive behaviors; at the end of the lactating phase, sexual behaviors resume, and aggression disappears. (B) Potential cellular mechanisms underlying changes in female VMHvlEsr1 activity from the virgin to the lactating state. Model 1: The VMHvlEsr1 neurons controlling socio-sexual behavior are the same in virgin and lactating females, and critical changes occur at their downstream targets to promote mating (in virgins) or aggression (in lactating dams). (In a variant of Model 1 (not shown) different cells control mating vs. aggression, but their state-dependent behavioral output is determined by changes in their downstream targets.) Models 2–4, distinct subsets VMHvlEsr1 cells control mating in virgins and aggression in lactating dams. Their relative activity differs depending on the animal’s state and determines their behavioral output. The changes in lactating females could involve a decrease in the activity of mating neurons (Model 2); an increase in the activity of aggression neurons (Model 3); or both (Model 4). Models 2–4 can be further subdivided according to the presence (II) or absence (I) of reciprocal inhibitory interactions (likely indirect) between mating and aggression cells. Colored symbols indicate where the lactation-dependent changes occur. The change in the activity of these different subpopulations could reflect cell-intrinsic changes, or changes in input strength. (C) Schematic of Act-seq protocol. (D) UMAP plot color-coded by clusters identified in tissue dissected from female ventral VMH (N=19,103; 27 clusters). (E-G) “Volcano plots” showing Fos expression levels in 27 VMH cell types from the following animals: (E) lactating females exhibiting attacks vs. control, (F) virgin females exhibiting lordosis vs. control, (G) control lactating females vs. control virgin females. Colored dots indicate cell types with Fos expression fold change >2 (x axis cut-off) and P <0.05 (y axis cut-off; gray dashed lines). (H) Fos expression levels in 12 VMHvl cell types from control lactating females, control virgin females (No intruder), lactating females exhibiting attacks (Aggression) and virgin females exhibiting lordosis (Mating). Colored bars show T-types with statistically significant increases (fold change >2 & P <0.05) in Fos expression relative to no-intruder controls (see also Figure S2C). (I) Violin plot illustrating expression levels of Npy2r and Esr1 in 12 VMHvl cell types. (J) Summary of composition of VMHvl cell types. Left, shaded green: VMHvlEsr1+,Npy2r− cells; shaded yellow: VMHvlNpy2r+ cells; gray: VMHvlEsr1−,Npy2r− cells. Right, green: Percentage of mating-activated cell types (#2, #3), as detected by a significant and >2-fold increase in Fos expression, among VMHvlEsr1+,Npy2r− cells (α); orange: Percentage of aggression-activated cell type (#4) as detected by Fos expression among VMHvlNpy2r+ cells (β). Fos expression in VMHvl substantially underestimates the fraction of neurons active during a given behavior, as measured by electrophysiological recordings (Lin et al., 2011).
Figure 2.
Figure 2.
VMHvl α cells control female receptivity and inhibit maternal aggression. (A) Left, strategy to activate VMHvlEsr1+,Npy2r− cells (α) in virgin females by optogenetics. Right, representative ChR2 expression in VMHvl α cells. Scalebar, 200um. (B) Behavioral paradigm and illustration of stimulation scheme for one session (also see Methods). (C) Representative raster plots illustrating light-induced behaviors in tested female and paired male. (D) Fraction of trials where female exhibited lordosis, (E) fraction of time female spent in lordosis, (F) lordosis quotient (lordosis time/male mounting or intromission time), (G) fraction of time males spent intromitting during light ON or light OFF periods, in estrus or diestrus intact (non-ovariectomized) ChR2/YFP-expressing females. (H) Strategy to activate VMHvlEsr1+,Npy2r− cells (α) in lactating females by optogenetics. (I) Representative raster plots illustrating light-induced behaviors in aggressive lactating female. (J) Average attack probability. In blue, stimulated trials with light ON; in grey, sham trials with light OFF. (K) Fraction of time lactating female spent attacking during 10-second stimulated or sham periods. *p<0.05; **p<0.01; ***p<0.001; ****p<0.0001. Mean ± SEM.
Figure 3.
Figure 3.
Activation of VMHvl ß cells evoked female aggression regardless of state. (A) Strategy to inhibit VMHvlNpy2r+ cells (β) in aggressive lactating females by optogenetics. (B) Representative eNpHR expression in VMHvl β cells. Scalebar, 200um. (C) Representative raster plots illustrating light-induced behaviors in aggressive lactating. (D) Average attack probability. In yellow, stimulated trials with light ON; in grey, sham trials with light OFF. (E) Fraction of time lactating female spent attacking during 10-second stimulated or sham stimulated periods. (F) Strategy to activate VMHvlNpy2r+ cells (β) or VMHvlEsr1+ cells in non-aggressive virgin females by optogenetics. (G, I) Representative raster plots illustrating light-induced behaviors in virgin female towards (F) female or (H) male intruders. (H, J) Average attack probability towards (G) female intruder and (I) male intruder. In blue, stimulated trials light ON; in grey, sham trials with light OFF. (K) Fraction of mice for whom attack was induced by activating β or VMHvlEsr1+ cells. (L) Fraction of trials with Npy2rcre female exhibiting attack. (M) Fraction of time Npy2rcre female exhibited attack during a trial. (N) Fraction of trials with Npy2rcre female exhibiting USV mounting. (O-P) Activation of β cells converted ongoing mating behaviors to attack in virgin females. (O) Behavior raster plot of individual trials. (P) Fraction of females exhibiting lordosis converted to attack. *p<0.05, **p<0.01, ***p<0.001, ****p<0.0001. Mean ± SEM.
Figure 4.
Figure 4.
VMHvl α cells, but not ß cells in virgin females selectively respond to male cues. A) Schematic illustrating fiber photometry recording in VMHvl. (B) Schematic illustrating behavioral test of social interaction in virgin females. (C-D) Representative GCaMP6m expression in (C) VMHvl α and (D) β cells. Scalebar, 200um. (E-F) Left, Peri-event time histogram (PETH) (E) α cells or (F) β cells, aligned to initial encounter with intruders. Initial encounter occurred immediately after intruder introduction. Right, area under the curve (AUC) represents timespan 0 to 30 seconds after the initial encounter. (G) Male Preference Index (MPI) of initial encounter from α and β cells. MPI = (AUC of initial encounter with male - AUC of initial encounter with female) / (AUC of initial encounter with male + AUC of initial encounter with female). (H-I) Left, PETH from (H) α cells or (I) β cells, aligned to sniffing intruder; these are defined as sniffing bouts occurring > 1 minute after intruder introduction. Sniffing bouts followed by male mounting were excluded. Right, AUC represents timespan 0 to 3 seconds after sniffing intruder. (J) MPI of sniffing intruder from α and β cells. MPI = (AUC sniffing male - AUC sniffing female) / (AUC sniffing male + AUC sniffing female). (K-L) Left, PETH from (K) α and (L) β cells, aligned to first sniff of urine. Right, Peak PETH between time 0 to 10 seconds relative to first sniff of urine. (M) MPI of first sniff of urine from α and β cells. MPI = (Peak of sniffing of male urine − Peak of sniffing of female urine) / (Peak of sniffing of male urine + Peak of sniffing of female urine). **p<0.01; ***p<0.001; ****p<0.0001; ns, not significant. Mean ± SEM.
Figure 5.
Figure 5.
VMHvl α cells are highly active in virgin females during mating behaviors. (A) Schematic illustrating fiber photometry recording in VMHvl and behavioral test in virgin females. (B-C) PETH of GCaMP6m fluorescence in α cells aligned to onset of (B) male mounting and (C) lordosis. (F-G) PETH in β aligned to onset of (F) male mounting and (G) lordosis. (D, H) Representative normalized calcium traces from (D) α cells and (H) β cells during mating interaction. Colored shading marks behavioral episodes. (E, I) Peak of PETH from (E) α cells and (I) β cells aligned to onset of appetitive phase (sniff) or consummatory phase (male mounting or intromission) during mating interaction. *p <0.05; ns, not significant. Mean ± SEM.
Figure 6.
Figure 6.
VMHvl β cells are highly active in lactating females during aggressive interactions. (A) Schematic illustrating fiber photometry recording in VMHvl β cells and α cells, and behavioral test of aggressive behaviors in lactating females. (B) Representative normalized GCaMP6m trace from β cells during aggressive interaction with female intruder. Colored shading marks behavioral episodes. (C-F) PETH of β cell activity aligned to onset of (C) attack and (D) sniffing of female intruder, or (E) attack and (F) sniffing of male intruder. Sniffing includes all sniffs, whether or not followed by attack. (G-H) β cell responses during sniffing of (G) female or (H) male intruders in aggressive (colored lines) vs. constitutively non-aggressive (gray lines) lactating females. Left, PETH of β cell activity aligned to onset of sniffing. Data from aggressive females is replicated from panels (D) and (F) to facilitate comparisons. Right, quantification of PETH peak and area under the curve (AUC). (I) Representative normalized GCaMP6m trace from α cells during aggressive interaction with female intruder. (J-M) PETH of α cell activity aligned to onset of (J) attack and (K) sniffing of female intruder, or (L) attack and (M) sniffing of male intruder. *p<0.05; **p<0.01; ns, not significant. Mean ± SEM.
Figure 7.
Figure 7.
Neural response of VMHvl ß cells to social cues is lactation state dependent. (A) Schematic illustrating fiber photometry recording in VMHvl β cells. (B) Timeline of longitudinal behavioral tests and recordings in the same individuals across their lactation cycle. Each female was tested 3 times in the virgin, lactating (Lac) and post-lactating (Post) phases. Parturition date was counted as p0. (C, E) Representative examples of normalized GCaMP6m traces from the same individual female resident across her lactation cycle, during free interactions with (C) male or (E) female intruders. (D, F) Left, PETHs from three phases of lactation cycle aligned to onset of sniffing of (D) male or (F) female. Right, quantification of PETH peak and AUC. No change of statistical significances after removing the highest data points in each group (see Supplemental Table 1). (G, J) Representative of normalized GCaMP6m traces from the same individual female resident across lactation cycle during no-contact interaction with (G) male or (J) female intruder protected by an inverted pencil cup (schematic). (H, K) AUC of neural activity recorded from three phases of lactation cycle during the first 60 seconds relative to introduction of pencil cup-protected (H) male or (K) female. (I, L) Averaged AUC or peak of neural activity during each 10-second time bin relative to introduction of pencil cup-protected (I) male or (L) female, from the three phases of the lactation cycle. (M) Left, Model 3 II, related to Figure 1B. Right, schematic illustrating the information flow during social interaction in virgin and lactating females: from sensory inputs to brain circuits to emotional states to behavioral output. Line thickness represents information strength. Blue: male intruder; Pink: female intruder. **p<0.01, ***p<0.001; Mean ± SEM.

Comment in

References

    1. Bosch OJ (2013) ‘Maternal aggression in rodents: Brain oxytocin and vasopressin mediate pup defence’, Philosophical Transactions of the Royal Society B: Biological Sciences. doi: 10.1098/rstb.2013.0085. - DOI - PMC - PubMed
    1. Chang RB et al. (2015) ‘Vagal sensory neuron subtypes that differentially control breathing’, Cell. doi: 10.1016/j.cell.2015.03.022. - DOI - PMC - PubMed
    1. Deutsch D et al. (2020) ‘The neural basis for a persistent internal state in drosophila females’, eLife, 9, pp. 1–74. doi: 10.7554/eLife.59502. - DOI - PMC - PubMed
    1. Falkner AL et al. (2014) ‘Decoding Ventromedial Hypothalamic Neural Activity during Male Mouse Aggression’, Journal of Neuroscience, 34(17), pp. 5971–5984. doi: 10.1523/jneurosci.5109-13.2014. - DOI - PMC - PubMed
    1. Fenno LE et al. (2014) ‘Targeting cells with single vectors using multiple-feature Boolean logic’, Nature Methods, 11(7), pp. 763–772. doi: 10.1038/nmeth.2996. - DOI - PMC - PubMed

Publication types