. 2022 Jan 11;55(1):159-173.e9.
doi: 10.1016/j.immuni.2021.12.001. Epub 2022 Jan 3.

Disruption of the IL-33-ST2-AKT signaling axis impairs neurodevelopment by inhibiting microglial metabolic adaptation and phagocytic function

Affiliations

Disruption of the IL-33-ST2-AKT signaling axis impairs neurodevelopment by inhibiting microglial metabolic adaptation and phagocytic function

Danyang He et al. Immunity. .

Abstract

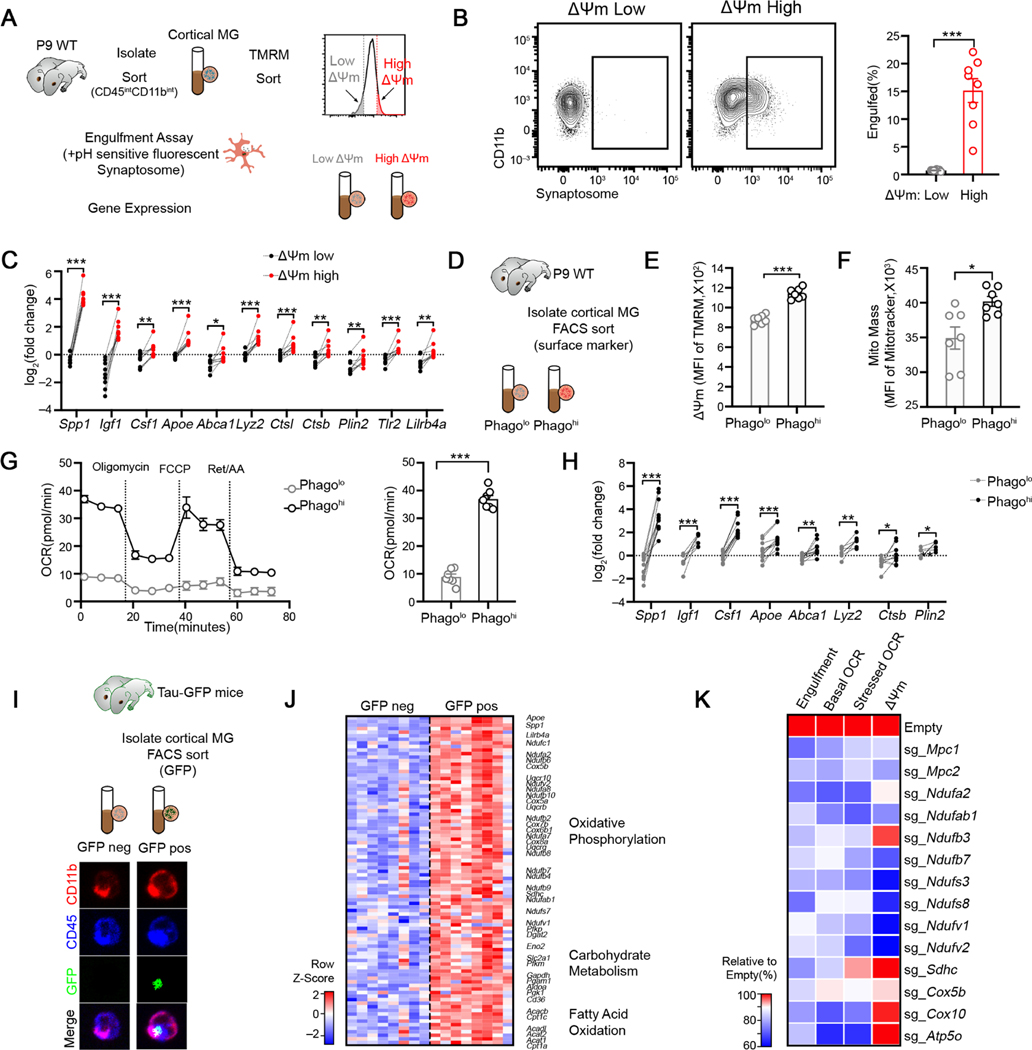
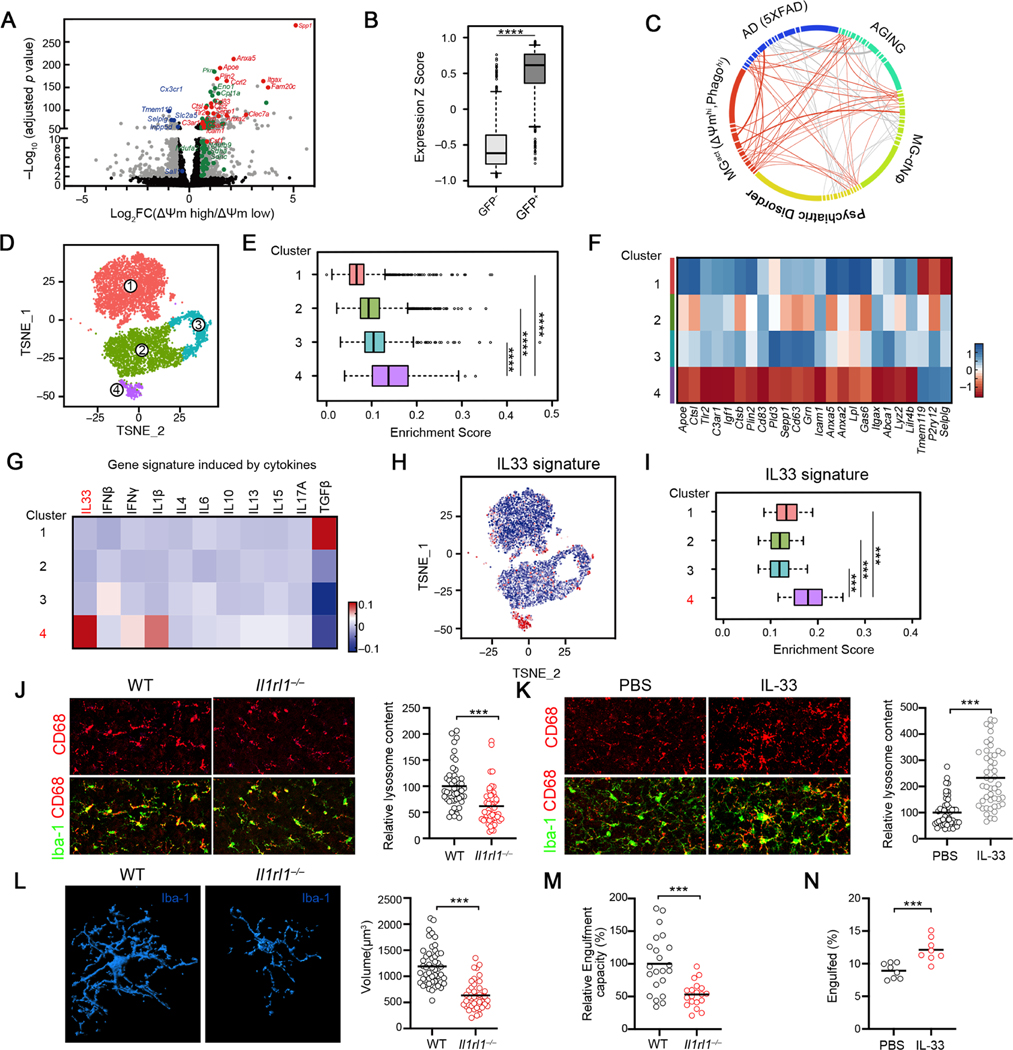
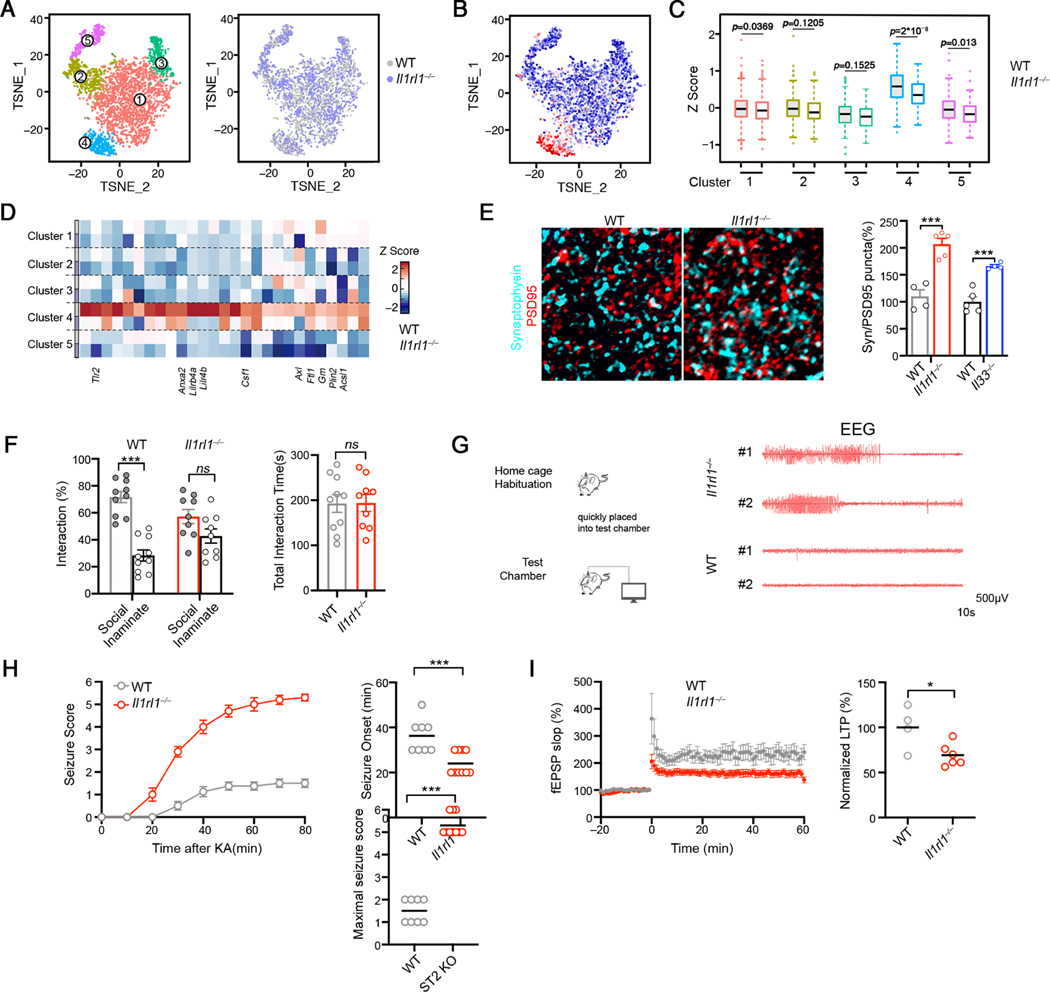
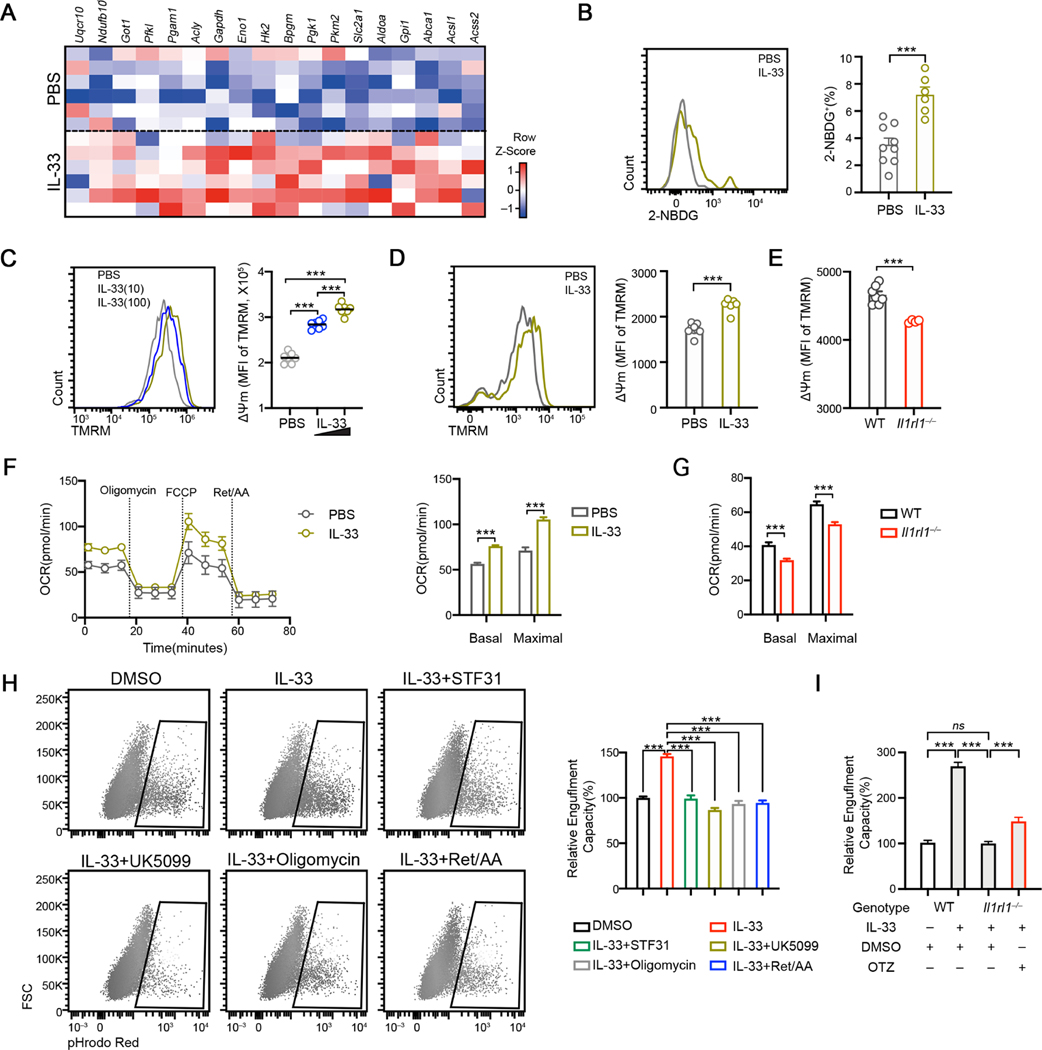
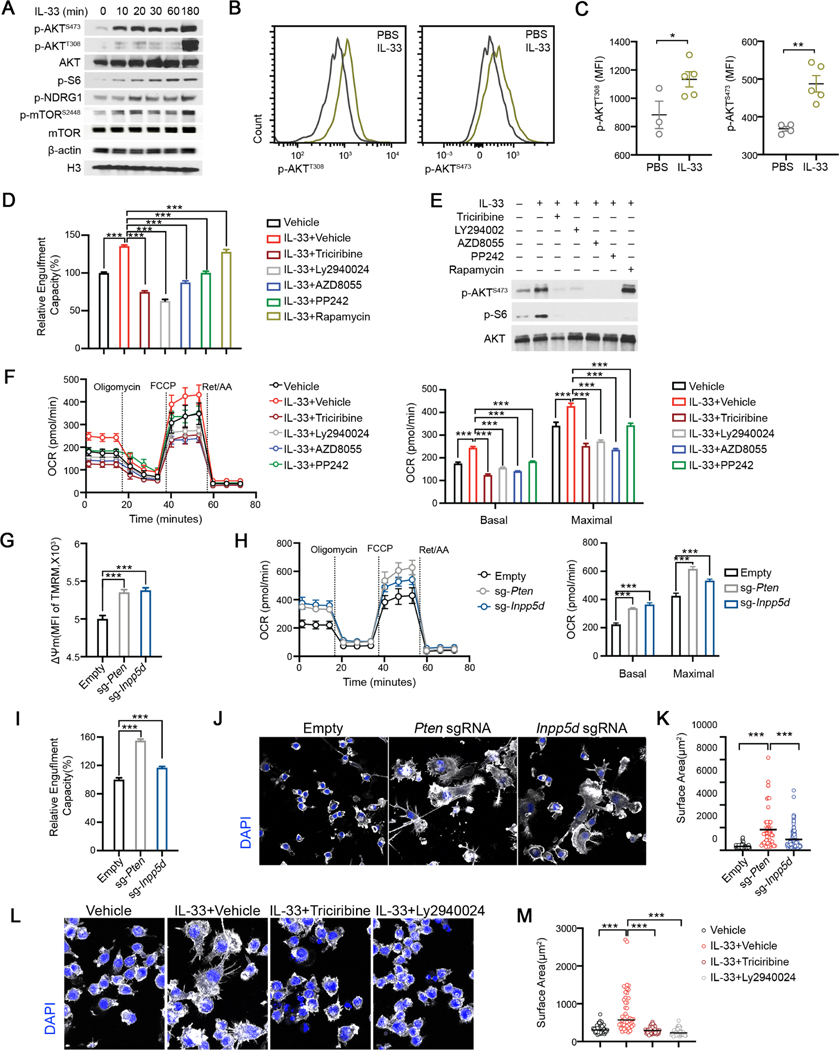
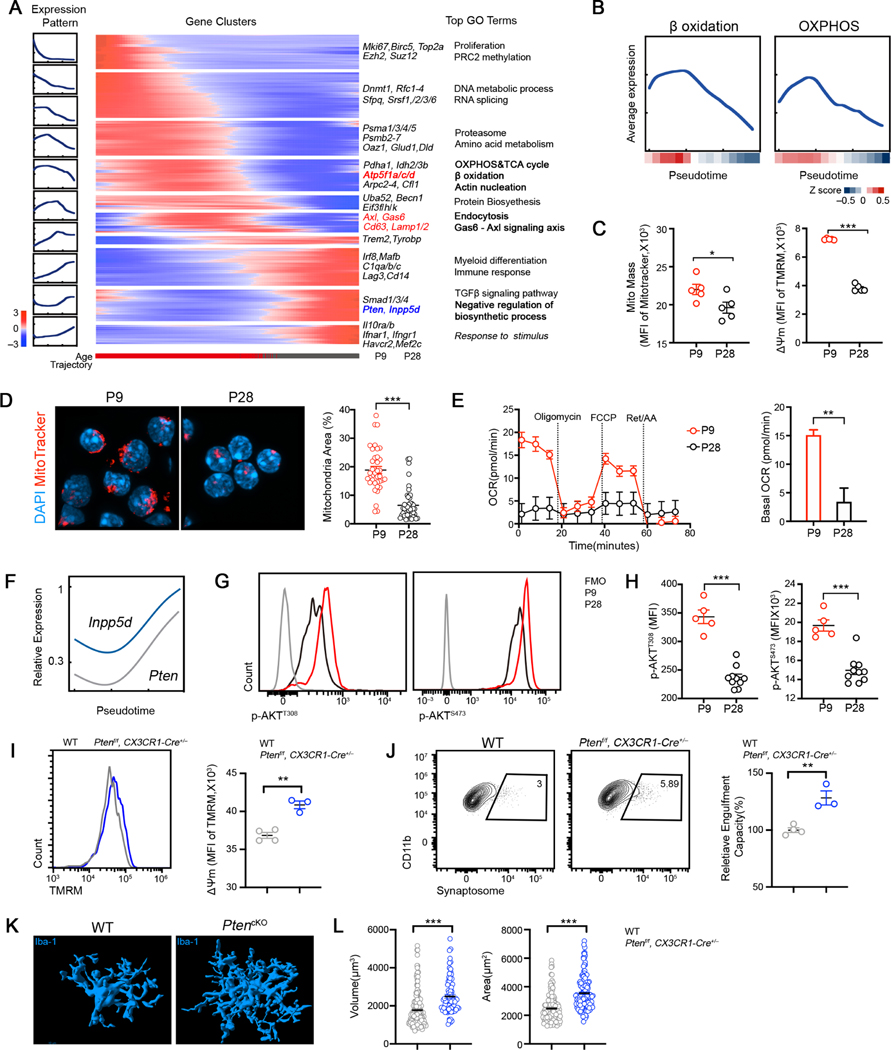
To accommodate the changing needs of the developing brain, microglia must undergo substantial morphological, phenotypic, and functional reprogramming. Here, we examined whether cellular metabolism regulates microglial function during neurodevelopment. Microglial mitochondria bioenergetics correlated with and were functionally coupled to phagocytic activity in the developing brain. Transcriptional profiling of microglia with diverse metabolic profiles revealed an activation signature wherein the interleukin (IL)-33 signaling axis is associated with phagocytic activity. Genetic perturbation of IL-33 or its receptor ST2 led to microglial dystrophy, impaired synaptic function, and behavioral abnormalities. Conditional deletion of Il33 from astrocytes or Il1rl1, encoding ST2, in microglia increased susceptibility to seizures. Mechanistically, IL-33 promoted mitochondrial activity and phagocytosis in an AKT-dependent manner. Mitochondrial metabolism and AKT activity were temporally regulated in vivo. Thus, a microglia-astrocyte circuit mediated by the IL-33-ST2-AKT signaling axis supports microglial metabolic adaptation and phagocytic function during early development, with implications for neurodevelopmental and neuropsychiatric disorders.

Keywords: IL-33; bioenergenetics; microglia; neurodevelopment; phagocytosis; seizure; synapse.


Conflict of interest statement

Declaration of interests V.K.K. has an ownership interest and is a member of the SAB of Celsius Therapeutics and Tizona Therapeutics. V.K.K.’s interests were reviewed and managed by the Brigham and Women’s Hospital and Partners Healthcare in accordance with their conflict-of-interest policies. A.R. is a co-founder and equity holder of Celsius Therapeutics, equity holder of Immunitas, and, until August 2020, a SAB member of Thermo Fisher Scientific, Syros Pharmaceuticals, Neogene Therapeutics, and Asimov. A.R. is an employee of Genentech. O.R.-R. is an employee of Genentech. O.R.-R. is a co-inventor on patent applications filed by the Broad related to single cell genomics. All other authors declare that they have no competing interests.

Figures

Figure 1.
Figure 1.. Mitochondrial bioenergetics and phagocytic activity are functionally coupled in cortical microglia during neurodevelopment
(A) Schematic strategy to sort low-ΔΨm and high-ΔΨm microglia subsets for analyses. (B) Representative FACS plot and quantification of cell fraction that has engulfed synaptosome in indicated ΔΨm microglia subsets (n = 8). (C) qPCR analyses of selected genes in indicated ΔΨm microglia subsets isolated from P9 cortices (n = 9 mice). (D) Schematic strategy to enrich Phagolo and Phagohi microglia subsets. (E-F) Quantification TMRM (E) and MitoTracker Green (F) staining in indicated microglia subsets (n = 7). (G) Oxygen consumption rate of indicated microglia subsets analyzed by Mito Stress test assay (n = 7, representative of 2 experiments). (H) qPCR analyses of selected genes in indicated microglia subsets isolated from P10 cortices (n = 6–12). (I) Schematic strategy to enrich microglia that are more potent to engulf neuronal debris in vivo. Bottom: representative images of sorted GFP+ and GFP microglia isolated from P10 mice carrying Tau-GFP (Scale bar = 10μm). GFP signals were observed inside microglia. (J) Heatmap depicting the relative expression of genes involved in bioenergetic metabolism from Tau-GFP+ and Tau-GFP microglia. All genes listed are differentially expressed between two genotypes with FDR < 0.05. (K) Relative engulfment capacity, basal and stressed OCR and ΔΨm of BV2 cells transduced with Cas9-GFP only or Cas9-GFP-sgRNAs targeting metabolic enzymes and transporters. All values are normalized to the mean value of Cas9-GFP-Empty group. Data is pooled from at least 2 experiments and all changes are significant with p < 0.05. Statistics: mean ± SEM (B, E and F), mean ± SD (G); unpaired student’s t test (B, E, F and G), paired student’s t test (C and H), one-way ANOVA test (K); *p<0.05, **p<0.01, ***p<0.001.
Figure 2.
Figure 2.. Identification of an IL33-dependent gene program that is associated with microglial function and activity in the developing brain
(A) Volcano plot depicting transcriptional profiles of ΔΨmhi vs ΔΨmlo microglia subsets. Grey: all differentially expressed genes (fold change ≥ 1, adjusted p < 0.05); red: activation markers; green: homeostatic markers. (B) Distribution of the relative expression of ΔΨmhi gene signature in Tau-GFP+ and Tau-GFP- microglia. (****p <10−12). (C) Graphical representation of similarities between the microglia activation signature (MGact) and transcriptomic signatures from mouse AD model, aging and human psychiatric disorder module. Each line represents an overlap, and the thickness of lines is coded by the number of genes overlapped. Genes/connectivity associated with MGact signature is depicted in orange. (D) t-SNE plot showing 4 microglial clusters from P9 and P28 cortices identified by scRNA-seq. (E) Distribution of MGact expression among the 4 single cell clusters. (F) Heatmap depicting the relative average expression of selective microglial activation genes that were enriched in Cluster 4, in comparison to other clusters. (G) Heatmap depicting relative expression of gene sets induced by indicated cytokines. IL33 gene signature was significantly enriched in Cluster 4 (p < 3.1 × 10⁻¹²). (H) t SNE visualization of the single microglia, colored by IL33 induced gene signature derived from primary mouse microglia in vitro. (I) Distribution of the relative expression of IL33 gene signature in the 4 single cell clusters. IL-33 gene signature was defined as genes significantly induced by IL-33 in primary microglia. (J) Representative images and quantification of microglia engulfment capacity as measured by lysosomal content within each microglia (CD68 immunoreactivity per cell) in the somatosensory cortex of WT and Il1rl1−/− mice at P9 (Scale bar = 50μm). Data is normalized to WT (n = 49, 52; pooled from 3–5 mice/group). (K) Representative images and quantification of lysosome content of microglia in the somatosensory cortex of WT mice injected with IL-33 vs PBS (Scale bar = 50μm). Data is normalized to PBS group (n = 50,48; pooled from 6 mice/group). (L) Representative 3D reconstructions of Iba1-stained microglia residing in the somatosensory cortex of WT or Il1rl1−/− mice at P17 (Scale bar = 10μm). Cellular volume is quantified on the right side (n = 50, 41; pooled from 3–5 mice/group). (M) Quantification of microglia engulfment capacity measured by engulfment index (the ratio of engulfed synaptic debris volume to the total volume of microglia) of microglia in the somatosensory cortex of WT or Il1rl1−/− mice at P17. Data is normalized to WT (n = 49, 52; pooled from 3–5 mice/group). (N) The percentage of microglia engulfed synaptosome at indicated conditions (n = 8). Statistics: middle line: mean, box edges: 25th and 75th percentiles, whiskers: extend to 5th to 95th percentile (B, E and I); middle line: mean (J-N); student’s t test (B and J-N), one-way ANOVA test (E, G and I); ***p<0.001, ****p <10−12.
Figure 3.
Figure 3.. The IL-33-ST2 axis fine-tunes microglial function and regulates synaptic connectivity in vivo
(A) tSNE visualization of microglia isolated from WT and Il1rl1−/− cortex at P9. Single cells are colored by the partitioning into 5 clusters or genotype. (B) tSNE visualization of the single microglia, colored by IL-33 induced gene signature. (C) Distribution of IL-33 induced gene signature expression in the 5 clusters from WT and Il1rl1−/− microglia. (D) Heatmap depicting the relative average expression of selected IL-33 induced genes in the 5 single cell clusters identified in (A). (E) Representative images showing staining for Synaptophysin (cyan) and PSD-95 (red) in the somatosensory cortex of WT and Il1rl1−/− mice at P17 (Scale bar =10μm). Quantification of colocalized pre-and postsynaptic puncta is shown on the right. (F) Three-chamber test evaluating sociability of WT and Il1rl1−/− mice. Left: social preference index; right: the total object investigating time. (G) Representative EEG recordings in Il1rl1−/− and WT mice. (H) Seizure severity score following kainic acid injection to WT and Il1rl1−/− mice at P28-P35. Onset of seizure is quantified on the right (n = 7, 10). (I) LTP induction in the CA1 area as measured using field recordings in the brain slices from WT and Il1rl1−/− mice. Summary of normalized LTP between 50 and 60 min of the recording is plotted on the right (pooled from 4–6 brain slices from 3 experiments). Statistics: middle line: mean, box edges: 25th and 75th percentiles, whiskers: extend to 5th to 95th percentile (C); mean ± SEM (E, F and H); middle line: mean (H-I); student’s t test (E, F, H and I), one-way ANOVA test (C), two-way ANOVA test (F); ns: not significant, *p<0.05, ***p<0.001.
Figure 4.
Figure 4.. IL33-dependent mitochondrial bioenergetics promotes microglia engulfment
(A) Heatmap depicting the relative expression of selective metabolic genes induced by IL-33 in primary microglia. (B) 2-NBDG uptake by cortical microglia isolated from PBS and IL-33 administered mice at P9 (n = 6, 9). (C) Quantification of TMRM MFI in primary rat microglia stimulated with 10ng/mL and 100ng/mL IL-33 for 12hrs (n = 7). (D) TMRM staining on cortical microglia isolated from P9 mice injected with PBS and IL33 (n = 6). (E) TMRM staining in cortical microglia isolated from WT and Il1rl1−/− mice at P9 (n = 7, 4). (F) OCR of microglia under indicated conditions analyzed by Mito Stress test assay (n =12, representative of 2 experiments). (G) Basal and stressed OCR of cortical microglia isolated from WT and Il1rl1−/− brains at P9 (n =12). (H) Representative FACS plots and quantifications of engulfed synaptosome percentage in BV2 cells under indicated conditions (n = 11–30, pooled from 4 experiments). (I) Engulfment capacity of WT and Il1rl1−/− BMDM as measured by engulfed synaptosome percentage at indicated conditions (n = 6, 6, 17, 16; pooled from 2 experiments). Statistics: mean ± SEM (B, D, E, H and I); middle line: mean (C); mean ± SD (F and G); student’s t test (B, D, E, F and G), one-way ANOVA test (C, H and I); ***p<0.001.
Figure 5.
Figure 5.. AKT mediates IL-33-enhanced bioenergetics and morphological remodeling to promote synaptosome engulfment activity
(A) Immunoblots of p-AKT, pS6, pNDRG1 and p-mTOR in BV2 from indicated time points. (B-C) Representative FACS plots (B) and geometric mean fluorescence intensities (C) of p-AKT (T308) and p-AKT (S473) in cortical microglia isolated from P9 mice injected with PBS and IL-33 (n = 3–5). (D) Relative phagocytic activity of BV2 cells under indicated conditions. Data is normalized to the vehicle group (n = 47, 61, 9, 10, 20, 45, 9; pooled from 4 experiments). (E) Immunoblots of p-AKT, total AKT and p-S6 under indicated conditions. (F) OCR of BV2 cells under indicated conditions analyzed by Mito Stress test assay (n = 10, representative of 2 experiments). (G) MFI of TMRM staining in BV2 cells transduced with sgRNAs targeting Inpp5d and Pten (n = 8, 11, 11; representative of 3 experiments). (H) OCR of BV2 cells transduced with sgRNAs targeting Inpp5d and Pten analyzed by Mito Stress test assay (n = 24, 15, 8; representative of 2 experiments). (I) Relative fraction of cells engulfed synaptosomes in BV2 transduced with sgRNAs targeting Inpp5d and Pten. Data is normalized to the empty vector group (n = 22, 11, 20; representative of 5 experiments). (J-K) Phalloidin (white) and DAPI (blue) staining on BV2 cells transduced with sgRNAs targeting Inpp5d and Pten (Scale bar = 20μm). Surface area of Phalloidin staining is enumerated in (K) (n = 105, 56, 127; representative of 2 experiments). (L-M) Phalloidin (white) and DAPI (blue) on BV2 cells under indicated conditions (Scale bar= 20μm). Surface area of Phalloidin staining is quantified in (M) (n = 65, 46, 57, 58; representative of 2 experiments). Statistics: mean ± SEM (C, D, G and I); middle line: mean (K and M); mean ± SD (F and H); student’s t test (C), one-way ANOVA test (D, F, G, H, I, K and M); * p<0.05, **p<0.01, ***p<0.001.
Figure 6.
Figure 6.. Mitochondrial bioenergetics and AKT activity of microglia is temporally regulated during neurodevelopment in vivo
(A) Gene expression dynamics along the inferred pseudo-temporal trajectory defined by Monocle (Methods). Averaged gene expression profiles of gene groups along the trajectory (left). Heatmap of relative average expression of genes within each group along the trajectory (middle). Representative genes and top terms from gene-set enrichment analysis for each group (right). Bar graph at the bottom represents the age of single cells. (B) Average expression of genes involved in mitochondria function related GO terms along the pseudo-temporal trajectory. Curve reflects a LOESS fit of single cell expression; color bar indicates relative expression along pseudo-time; β Oxidation: GO: GO:0006635; OXPHOS: GO:0006119. (C) Quantification TMRM and MitoTracker Green in cortical microglia at indicated ages. (D) MitoTracker Red CMXRos (red) and DAPI (blue) staining in cortical microglia at indicated ages. Quantification of mitochondria content (relative covering area normalized to nuclear area) is plotted on the right (n = 37, 50; representative of 2 experiments). (E) OCR of P9 and P28 microglia analyzed by Mito Stress test assay (n = 10, 15). (F) Inferring expression dynamics of Pten and Inpp5d along the pseudotime trajectory. (G) Representative FACS profiles showing intracellular staining of p-AKT (T308) and p-AKT (S473) in P9 and P28 microglia. (H) MFI of p-AKTT308 and p-AKTS473 staining in P9 and P28 microglia (n = 9, 10; representative of 2 experiments). (I) TMRM staining in cortical microglia isolated from WT and Ptenf/f::CX3CR1-Cre+/− mice at P28 (n = 4, 3). (J) Representative FACS profiles and quantification of relative engulfment capacity of cortical microglia isolated from WT and Ptenf/f::CX3CR1-Cre+/− mice at P28 (n = 4, 3). (K) Representative 3D reconstructions of Iba1-stained microglia residing in somatosensory cortex of WT and Ptenf/f::CX3CR1-Cre+/− animals at P28 (Scale bar = 10μm). (L) Quantification of cellular volume and surface area of cortical microglia from WT and Ptenf/f::CX3CR1-Cre+/− mice at P28 (n = 157, 80, pooled from 3 mice/group). Statistics: mean ± SEM (C, H and J); middle line: mean (D and L); mean ± SD (E); student’s t test; * p<0.05, **p<0.01, ***p<0.001.

References

    1. Baik SH, Kang S, Lee W, Choi H, Chung S, Kim JI, and Mook-Jung I. (2019). A Breakdown in Metabolic Reprogramming Causes Microglia Dysfunction in Alzheimer’s Disease. Cell Metab 30, 493–507 e496. 10.1016/j.cmet.2019.06.005. - DOI - PubMed
    1. Bohlen CJ, Bennett FC, Tucker AF, Collins HY, Mulinyawe SB, and Barres BA (2017). Diverse Requirements for Microglial Survival, Specification, and Function Revealed by Defined-Medium Cultures. Neuron 94, 759–773 e758. 10.1016/j.neuron.2017.04.043. - DOI - PMC - PubMed
    1. Borst K, Schwabenland M, and Prinz M. (2019). Microglia metabolism in health and disease. Neurochem Int 130, 104331. 10.1016/j.neuint.2018.11.006. - DOI - PubMed
    1. Bouffi C, Rochman M, Zust CB, Stucke EM, Kartashov A, Fulkerson PC, Barski A, and Rothenberg ME (2013). IL-33 markedly activates murine eosinophils by an NF-kappaB-dependent mechanism differentially dependent upon an IL-4-driven autoinflammatory loop. J Immunol 191, 4317–4325. 10.4049/jimmunol.1301465. - DOI - PMC - PubMed
    1. Butovsky O, Jedrychowski MP, Moore CS, Cialic R, Lanser AJ, Gabriely G, Koeglsperger T, Dake B, Wu PM, Doykan CE, et al. (2014). Identification of a unique TGF-beta-dependent molecular and functional signature in microglia. Nat Neurosci 17, 131–143. 10.1038/nn.3599. - DOI - PMC - PubMed

Publication types

MeSH terms