. 2022 Mar 4;38(6):1700-1707.
doi: 10.1093/bioinformatics/btab877.

Quantifying and correcting slide-to-slide variation in multiplexed immunofluorescence images

Affiliations

Quantifying and correcting slide-to-slide variation in multiplexed immunofluorescence images

Coleman R Harris et al. Bioinformatics. .

Abstract

Motivation: Multiplexed imaging is a nascent single-cell assay with a complex data structure susceptible to technical variability that disrupts inference. These in situ methods are valuable in understanding cell-cell interactions, but few standardized processing steps or normalization techniques of multiplexed imaging data are available.

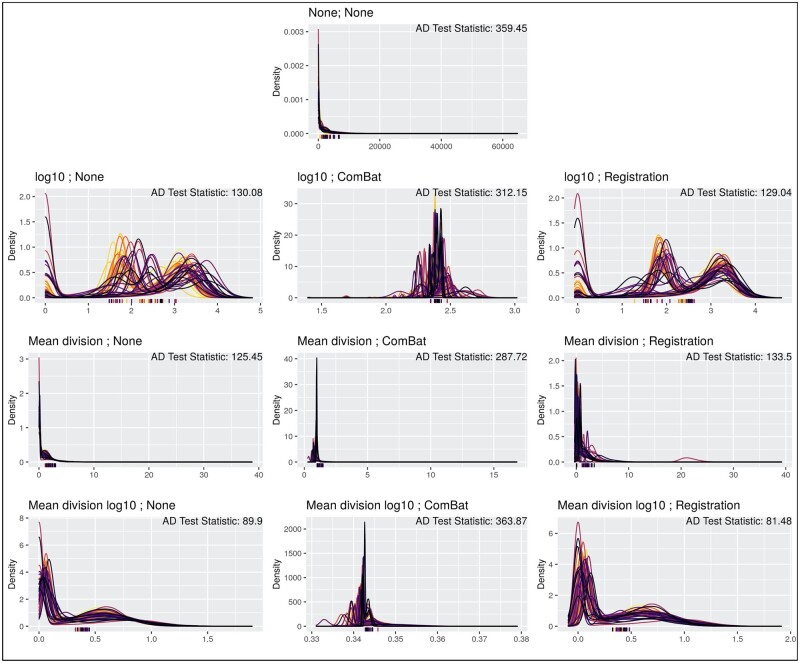
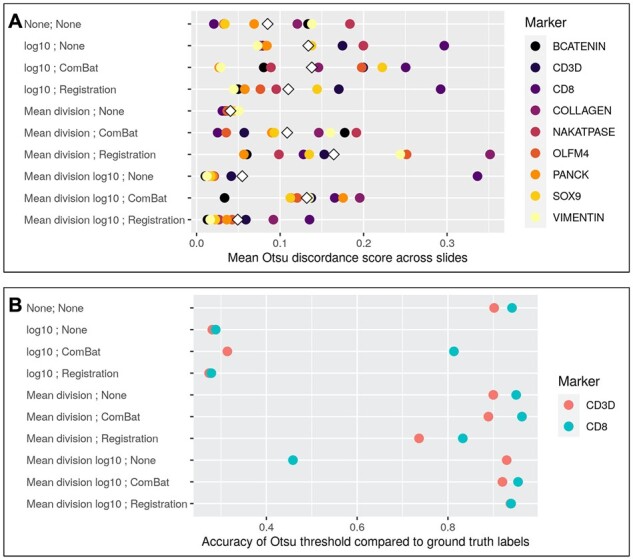
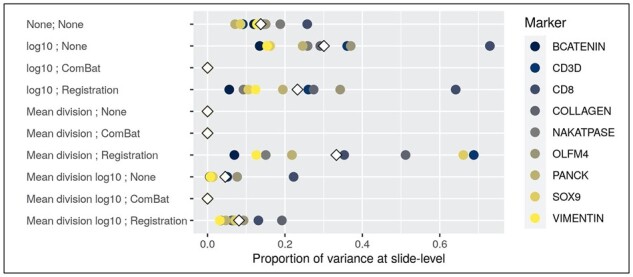
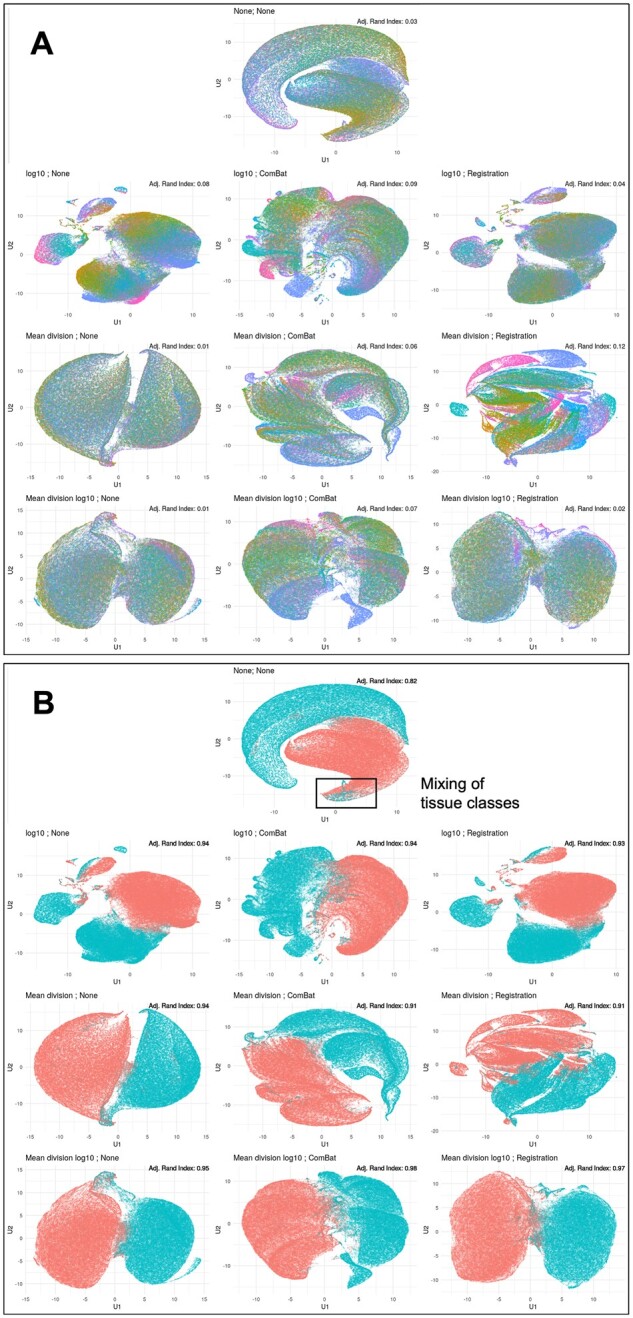
Results: We implement and compare data transformations and normalization algorithms in multiplexed imaging data. Our methods adapt the ComBat and functional data registration methods to remove slide effects in this domain, and we present an evaluation framework to compare the proposed approaches. We present clear slide-to-slide variation in the raw, unadjusted data and show that many of the proposed normalization methods reduce this variation while preserving and improving the biological signal. Furthermore, we find that dividing multiplexed imaging data by its slide mean, and the functional data registration methods, perform the best under our proposed evaluation framework. In summary, this approach provides a foundation for better data quality and evaluation criteria in multiplexed imaging.

Availability and implementation: Source code is provided at: https://github.com/statimagcoll/MultiplexedNormalization and an R package to implement these methods is available here: https://github.com/ColemanRHarris/mxnorm.

Supplementary information: Supplementary data are available at Bioinformatics online.


Figures

Fig. 1.
Fig. 1.
Visual comparison of vimentin marker densities for each transformation method. Density plots for the median cell intensity of the marker vimentin, where each color represents a different slide in the dataset. Each row is aligned with the scale transformations present in Table 1, where each column also matches with the normalization algorithms in Table 1. The ticks on the x-axis represent the Otsu thresholds for each slide for that transformed data, where the color again corresponds to the slide (such that the colors are one-to-one between threshold and density plot). Anderson–Darling test statistics for the marker vimentin are presented for each method in the top right corner
Fig. 2.
Fig. 2.
Threshold discordance and accuracy. (A) Otsu thresholds were calculated at the slide-level for each marker and compared to a global Otsu threshold for each marker to calculate a discordance score to compare transformation methods. The mean difference of the slide-level Otsu thresholds and the global Otsu threshold is then calculated for each marker, and presented as a point for each of the nine markers, with the white diamond representing the mean discordance score across all markers for a given method. Given that this is a discordance score, lower values indicate better agreement across slides. (B) Otsu thresholds were calculated across slides for each marker to determine marker positive cells, which were then compared to the manual labels for the markers CD3 and CD8 to determine the accuracy of defining a cell as marker positive. This is presented as the accuracy rate of recapitulating the ground truth labels—given that this is a measurement of accuracy, higher values indicate better agreement between the normalized data and labels. Note also that for each of these plots, the top row indicates the results from the raw, unadjusted data
Fig. 3.
Fig. 3.
Proportion of variance present at slide-level in random effects model. Scatter plots that denote the proportion of variance at the slide-level for each normalization method for each of the marker channels in this dataset. Variance proportions were calculated using a random effects model with a random intercept for slide—methods that perform well should reduce the slide level variance. Note also that the top row indicates the results from the raw, unadjusted data
Fig. 4.
Fig. 4.
UMAP embedding of data for each transformation method. UMAP embedding of the transformed data with points colored by slide identifier (A) and tissue type (B). The rectangle in (B) denotes the mixing of tissue classes present in the raw, unadjusted data UMAP embedding. Adjusted Rand index values for each embedding are presented in the top right corner

References

    1. Bates D. et al. (2015) Fitting linear mixed-effects models using lme4. J. Stat. Softw., 67, 1–48.
    1. Becht E. et al. (2019) Dimensionality reduction for visualizing single-cell data using UMAP. Nat. Biotechnol., 37, 38–44. - PubMed
    1. Berry S. et al. (2021) Analysis of multispectral imaging with the AstroPath platform informs efficacy of PD-1 blockade. Science, 372, eaba2609. - PMC - PubMed
    1. Blom S. et al. (2017) Systems pathology by multiplexed immunohistochemistry and whole-slide digital image analysis. Sci. Rep., 7, 1–13. - PMC - PubMed
    1. Bradford J.A. et al. (2004) Fluorescence-intensity multiplexing: simultaneous seven-marker, two-color immunophenotyping using flow cytometry. Cytometry A, 61, 142–152. - PubMed

Publication types