. 2022 Oct 2;10(4):2017225.
doi: 10.1080/21688370.2021.2017225. Epub 2022 Jan 5.

Desmosomes undergo dynamic architectural changes during assembly and maturation

Affiliations

Desmosomes undergo dynamic architectural changes during assembly and maturation

Reena R Beggs et al. Tissue Barriers. .

Abstract

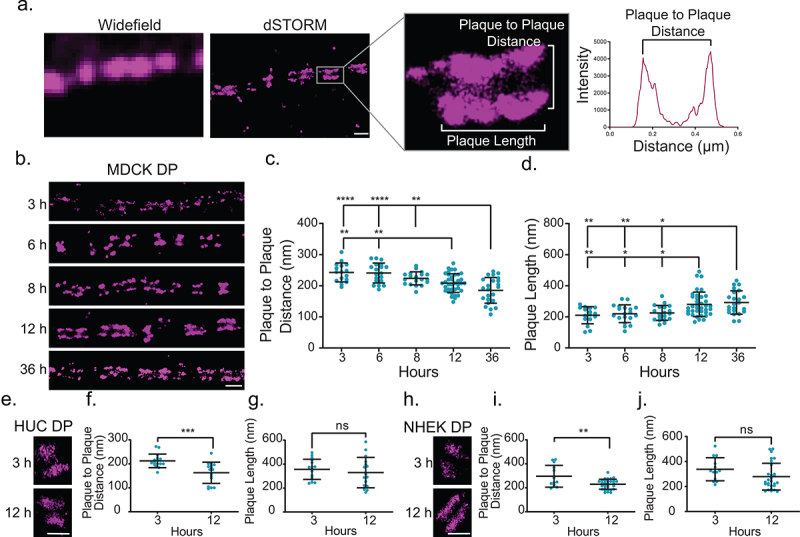
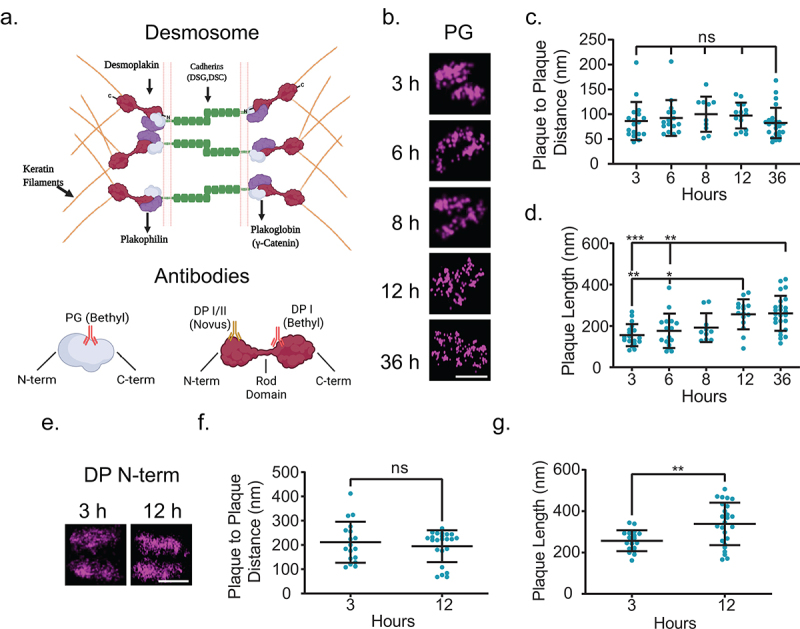
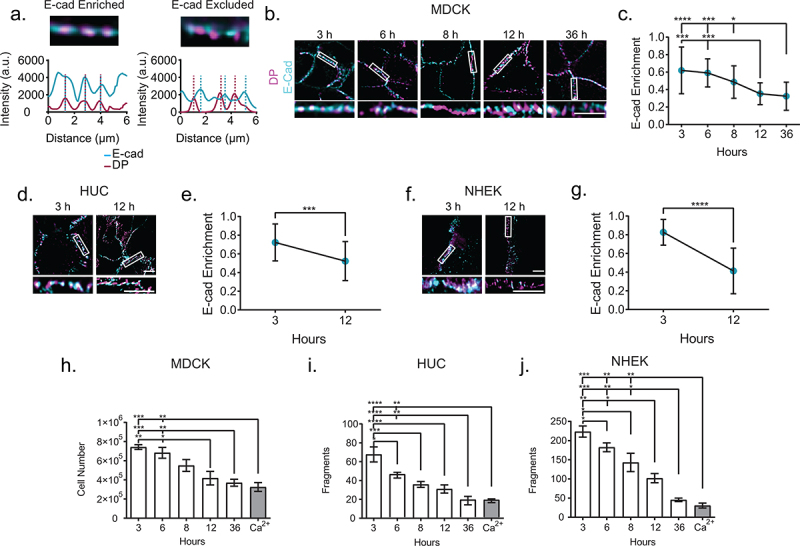
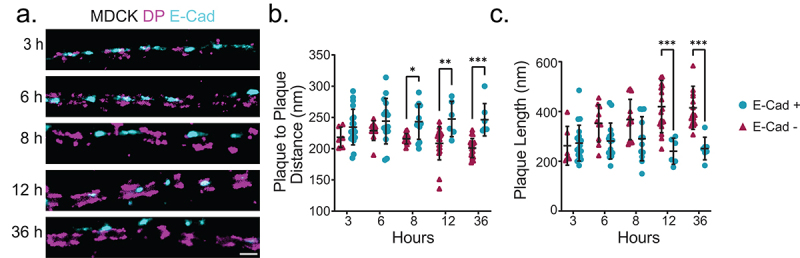
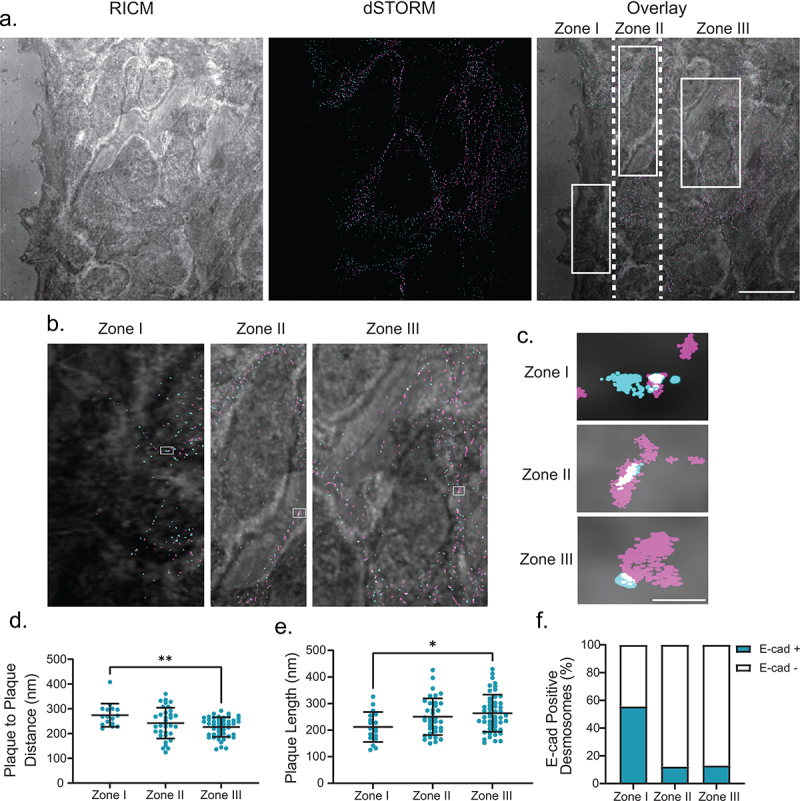
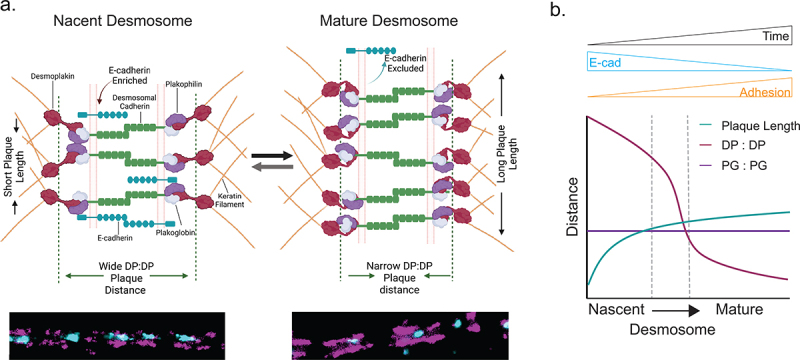
Desmosomes are macromolecular cell-cell junctions critical for maintaining adhesion and resisting mechanical stress in epithelial tissue. Desmosome assembly and the relationship between maturity and molecular architecture are not well understood. To address this, we employed a calcium switch assay to synchronize assembly followed by quantification of desmosome nanoscale organization using direct Stochastic Optical Reconstruction Microscopy (dSTORM). We found that the organization of the desmoplakin rod/C-terminal junction changed over the course of maturation, as indicated by a decrease in the plaque-to-plaque distance, while the plaque length increased. In contrast, the desmoplakin N-terminal domain and plakoglobin organization (plaque-to-plaque distance) were constant throughout maturation. This structural rearrangement of desmoplakin was concurrent with desmosome maturation measured by E-cadherin exclusion and increased adhesive strength. Using two-color dSTORM, we showed that while the number of individual E-cadherin containing junctions went down with the increasing time in high Ca2+, they maintained a wider desmoplakin rod/C-terminal plaque-to-plaque distance. This indicates that the maturation state of individual desmosomes can be identified by their architectural organization. We confirmed these architectural changes in another model of desmosome assembly, cell migration. Desmosomes in migrating cells, closest to the scratch where they are assembling, were shorter, E-cadherin enriched, and had wider desmoplakin rod/C-terminal plaque-to-plaque distances compared to desmosomes away from the wound edge. Key results were demonstrated in three cell lines representing simple, transitional, and stratified epithelia. Together, these data suggest that there is a set of architectural programs for desmosome maturation, and we hypothesize that desmoplakin architecture may be a contributing mechanism to regulating adhesive strength.

Keywords: dSTORM; desmoplakin; desmosome; epithelia; junction; microscopy; super-resolution.


Conflict of interest statement

No potential conflict of interest was reported by the author(s).

Figures

Figure 1.
Figure 1.
Desmoplakin architecture changes as desmosome mature. (a) Images of desmosomes (MDCK cells labeled for desmoplakin rod/C-terminal domain) illustrating the improved resolution of direct stochastic optical reconstruction microscopy (dSTORM) compared to widefield microscopy. The region of interest shows a single desmosome and illustrates the measurements obtained from dSTORM images. The plaque-to-plaque distance is quantified as illustrated in the plot of fluorescence intensity as a function of distance for a line scan through the desmosome. Scale bar = 0.5 μm. (b-d) MDCK cells were stained for the desmoplakin rod/C-term junction following Ca2+ switch for 3, 6, 8, 12, and 36 h as indicated. (b) Representative dSTORM images of cell-cell borders at each timepoint. (c) Plaque-to-plaque distance and (d) plaque length at each timepoint (mean ± SD; datapoints are individual desmosomes). (e) HUC dSTORM images at 3 and 12 h, (f) plaque-to-plaque distance, and (g) plaque length at each timepoint (mean ± SD). (e) NHEK dSTORM images at 3 and 12 h, (f) plaque-to-plaque distance, and (g) plaque length at each timepoint (mean ± SD). (b, e and h) Scale bars = 1 μm. (ns, not significant, * P ≤ .05, ** P ≤ .01, *** P ≤ .001, and **** P ≤ .0001 by (c, d) ANOVA with post hoc Tukey’s test or f, g, i and j) Student’s t-test. (c and d) (MDCK 3 h n = 16, 6 h n = 19, 8 h n = 19, 12 h n = 37, and 36 h n = 23) and (f and g) (HUC 3 h n = 16 and 12 h n = 16); and (i and j) (NHEK 3 h n = 13 and 6 h n = 31). Experiments were performed in triplicate.
Figure 2.
Figure 2.
Desmoplakin architecture changes are due to rearrangement of the rod domain. (a) Schematic of protein arrangement in desmosomes and where the antibodies utilized in this study bind. (b-d) MDCK cells were stained for plakoglobin (PG) following Ca2+ switch 3, 6, 8, 12, or 36 h as indicated. (b) Representative dSTORM images, (c) plaque-to-plaque distance, and (d) plaque length. (e-g) MDCK cells were stained for desmoplakin N-terminal domain (DP N-term) 3 or 12 h following Ca2+ switch. (e) Representative dSTORM images, (f) plaque-to-plaque distance, and (g) plaque length. Scale bars = 0.25 μm. (mean ± SD ns not significant, * P ≤ .05, ** P ≤ .01, and *** P ≤ .001 by (c and d) ANOVA with post hoc Tukey’s test or (f and g) Student’s t-test). (b-d)(PG 3 h n = 18, 6 h n = 16, 8 h n = 10, 12 h n = 15, and 36 h n = 25) (e-g) (DP N-term 3 h n = 15 and 12 h n = 38) Experiments were performed in triplicate.
Figure 3.
Figure 3.
E-cadherin is excluded from the mature junction and adhesive function is increased. (a) Example of E-cadherin enrichment analysis. Line scans through at least three desmosomes (indicated by desmoplakin) are performed. If an E-cadherin intensity peak overlaps a desmoplakin intensity peak, as in the first panel, it is considered enrichment, while if a desmoplakin intensity peak does not overlap with a corresponding E-cadherin intensity peak, as in the second panel, it is considered excluded. (b) Representitive images of MDCK cells labeled for desmoplakin (magenta) and E-cadherin (cyan). (c) Quantification of E-cadherin enrichment (3 h n = 21, 6 h n = 21, 8 h n = 21, 12 h n = 21, and 36 h n = 21). (d) Representative images of HUCs and (e) quantification of E-cadherin enrichment (3 h n = 30 and 12 h n = 30). (f) Representative images of NHEKs (g) and quantification of E-cadherin enrichment (3 h n = 15 and 12 h n = 38) (b-g, experiments performed in triplicate.) (h-j) Quantification of dispase fragmentation assay at different time points after Ca2+ switch (mean ± sem) in (h) MDCK, (i) HUC, or (j) NHEK cells. (h) Single MDCK cells were counted using a hemocytometer and (i and j) HUC and NHEK fragments were counted manually under a dissecting microscope. n = 5 wells/timepoint, experiment performed in triplicate. Scale bar = 5 μm. * P ≤ .05, ** P ≤ .01, *** P ≤ .001, and **** P ≤.0001 by ANOVA with post hoc Tukey’s test.
Figure 4.
Figure 4.
Desmosome architectural changes correspond to E-cadherin exclusion in individual junctions. (a) Representative two-color dSTORM images of desmosomes in MDCK cells over time (magenta: desmoplakin rod/C-terminal junction and cyan: E-cadherin). Quantification of the desmoplakin plaque-to-plaque distance (b) and plaque length (c) according to whether E-cadherin was present (cyan) or not (magenta). (3 h n = 25, 6 h n = 25, 8 h n = 25, 12 h n = 25, and 36 h n = 25) Scale bar = 0.5 μm. * P ≤ .05, ** P ≤ .01, and *** P ≤ .001 by ANOVA with post hoc Tukey’s test.
Figure 5.
Figure 5.
Changing architecture is consistent in migrating cells. (a) The left panel shows a representative RICM image of the scratch, the middle panel shows a two-color dSTORM image of desmosomes at the scratch (magenta: desmoplakin, cyan: E-cadherin), and the right panel shows the overlay of the RICM and dSTORM images. Desmosomes at the first half of the cells at the leading edge of the scratch are defined as Zone 1, the back half of the same cells are defined as Zone 2, and cells behind the leading edge are defined as Zone 3. (b) depicts a representative zoomed in the area of each Zone. (c) depicts a representative single desmosome from each corresponding zone. Quantification of plaque-to-plaque distance (d), plaque length (e), and percent E-cad-positive desmosomes (f) for each zone. (Zone I n = 16, Zone II n = 34, and Zone III n = 47). Scale bar = 5 μm (A) 0.25 μm (b,c). * P ≤ .05, ** P ≤ .01 by ANOVA with post hoc Tukey’s test.
Figure 6.
Figure 6.
(a) Model illustrating architectural changes that take place during desmosome assembly and maturation. In nascent desmosomes, E-cadherin is enriched, desmosomes are shorter, and the desmoplakin rod/C-term plaque-to-plaque distance is wider compared to that in mature desmosomes where E-cadherin is excluded, the desmoplakin rod/C-terminal junction plaque-to-plaque distance is narrow, and the plaque length is extended. These structural changes may play important roles in the increased adhesion of mature desmosomes. (b) Schematic of the trends of the plaque length (green), desmoplakin plaque-to-plaque distance (magenta), and plakoglobin plaque-to-plaque distance (purple) as desmosomes mature.

References

    1. Garcia MA, Nelson WJ, Chavez N.. Cell-cell junctions organize structural and signaling networks. Cold Spring Harb Perspect Biol. 2018;10(4):1. - PMC - PubMed
    1. Broussard JA, Getsios S, Green KJ. Desmosome regulation and signaling in disease. Cell Tissue Res. 2015;360:501–14. - PMC - PubMed
    1. Stahley SN, Kowalczyk AP. Desmosomes in acquired disease. Cell Tissue Res. 2015;360:439–456. - PMC - PubMed
    1. Saito M, Tucker DK, Kohlhorst D, Niessen CM, Kowalczyk AP. Classical and desmosomal cadherins at a glance. J Cell Sci. 2012;125:2547–2552. - PMC - PubMed
    1. Harrison OJ, Brasch J, Lasso G, Katsamba PS, Ahlsen G, Honig B, Shapiro L. Structural basis of adhesive binding by desmocollins and desmogleins. Proc Natl Acad Sci U S A. 2016;113:7160–7165. - PMC - PubMed

Publication types

LinkOut - more resources