. 2022 Jan 5;23(1):5.
doi: 10.1186/s12864-021-08218-5.

Expression of immune response genes in human corneal epithelial cells interacting with Aspergillus flavus conidia

Affiliations

Expression of immune response genes in human corneal epithelial cells interacting with Aspergillus flavus conidia

Divya Arunachalam et al. BMC Genomics. .

Abstract

Background: Aspergillus flavus, one of the causative agents of human fungal keratitis, can be phagocytosed by human corneal epithelial (HCE) cells and the conidia containing phagosomes mature into phagolysosomes. But the immunological responses of human corneal epithelial cells interacting with A. flavus are not clear. In this study, we report the expression of immune response related genes of HCE cells exposed to A. flavus spores using targeted transcriptomics.

Methods: Human corneal epithelial cell line and primary cultures were grown in a six-well plate and used for coculture experiments. Internalization of the conidia was confirmed by immunofluorescence microscopy of the colocalized endosomal markers CD71 and LAMP1. Total RNA was isolated, and the quantity and quality of the isolated RNA were assessed using Qubit and Bioanalyzer. NanoString nCounter platform was used for the analysis of mRNA abundance using the Human Immunology panel. R-package and nSolver software were used for data analysis. KEGG and FunRich 3.1.3 tools were used to analyze the differentially expressed genes.

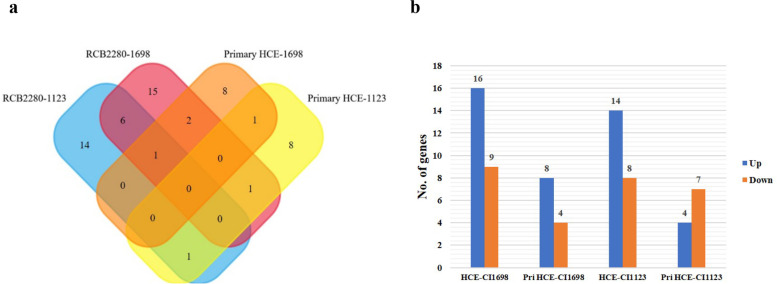
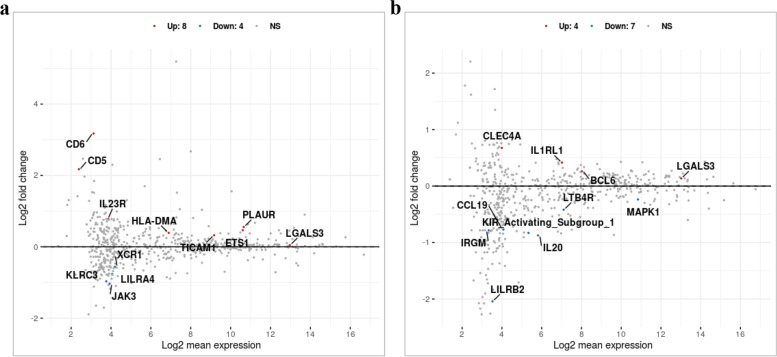
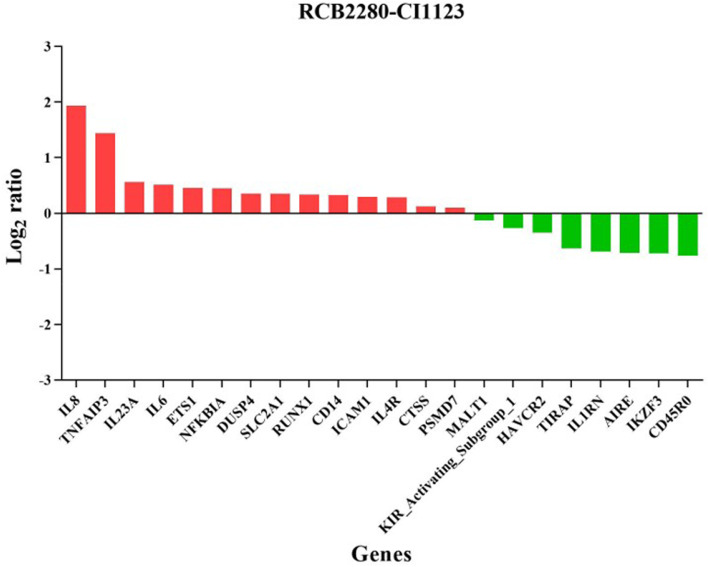
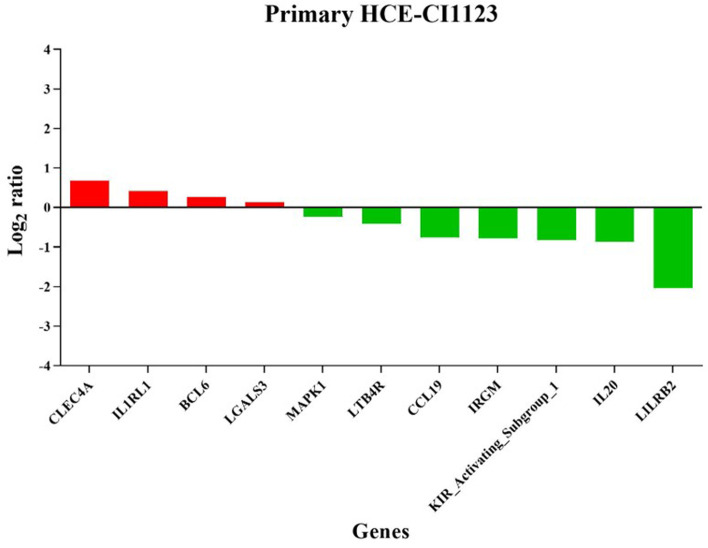
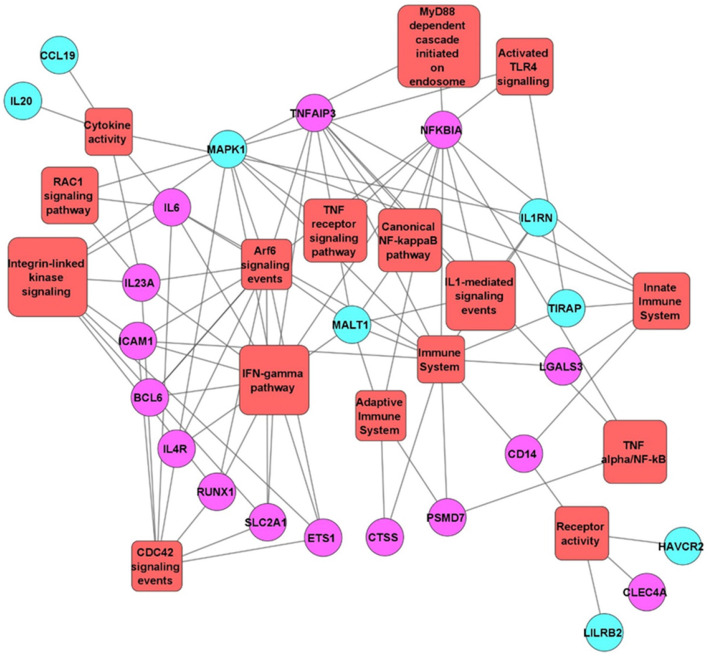
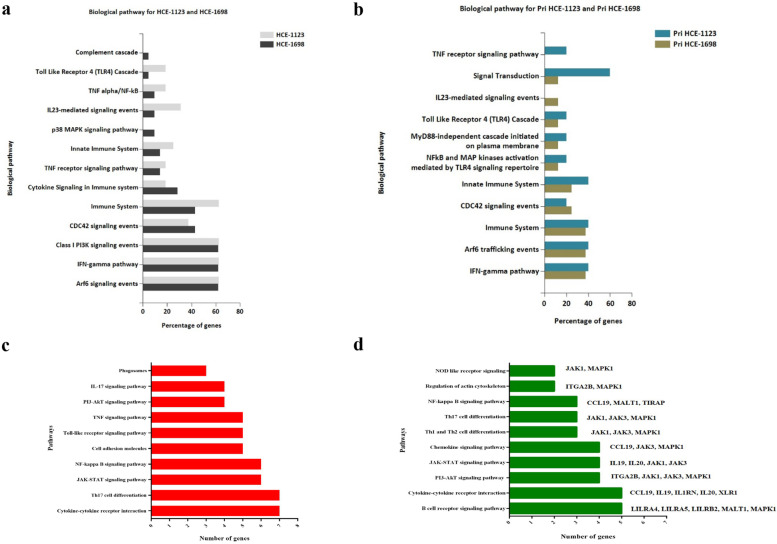
Results: Different morphotypes of conidia were observed after 6 h of coculture with human corneal epithelial cells and found to be internalized by epithelial cells. NanoString profiling showed more than 20 differentially expressed genes in immortalized human corneal epithelial cell line and more than ten differentially expressed genes in primary corneal epithelial cells. Distinct set of genes were altered in their expression in cell line and primary corneal epithelial cells. KEGG pathway analysis revealed that genes associated with TNF signaling, NF-KB signaling, and Th17 signaling were up-regulated, and genes associated with chemokine signaling and B cell receptor signaling were down regulated. FunRich pathway analysis showed that pathways such as CDC42 signaling, PI3K signaling, and Arf6 trafficking events were activated by the clinical isolates CI1123 and CI1698 in both type of cells.

Conclusions: Combining the transcript analysis data from cell lines and primary cultures, we showed the up regulation of immune defense genes in A. flavus infected cells. At the same time, chemokine signaling and B cell signaling pathways are downregulated. The variability in the expression levels in the immortalized cell line and the primary cultures is likely due to the variable epigenetic reprogramming in the immortalized cells and primary cultures in the absence of any changes in the genome. It highlights the importance of using both cell types in host-pathogen interaction studies.

Keywords: Aspergillus flavus; Corneal epithelial cells; Fungal keratitis; Immune response; NanoString analysis; Targeted transcriptomics.


Conflict of interest statement

Authors declare that they have no competing interests.

Figures

Fig. 1
Fig. 1
Morphology of uninfected and A. flavus infected HCE cells. Microscopic images of primary HCE cells grown on 6-well culture plates were infected with (A) no infection (B) A. flavus CI1698 (C) A. flavus CI1123 and HCE cell line (RCB2280) infected with (D) no infection (E) A. flavus CI1698 (F) A. flavus CI1123 at 200X magnification. The arrow shows the A. flavus conidia
Fig. 2
Fig. 2
Colocalization of early and late endosomal markers with the A. flavus conidia. RCB2280 cells were infected with A. flavus (CI1698) swollen spores for 4 h and stained for endosomal markers. (A) A. flavus in early endosomes (CD71) (B) A. flavus in late endosomes (LAMP1). The endosomal markers (Red) were detected using dylight 550 conjugated goat anti-mouse secondary antibody. From left to right, panels show bright field, fluorescence image of the blue channel (DAPI), fluorescence image of red channel (endosomes), merged overlay of all fluorescent channels, White arrow shows the germinated conidia inside the early and late endosomes
Fig. 3
Fig. 3
Differential regulation of immune response genes in HCE cells in response to A. flavus. (a) Venn diagram shows the comparison of differentially expressed genes between RCB2280 cells and primary HCE cells infected with CI1698 and CI1123. (b) Bar graph for the up and down-regulated genes in RCB2280 cells and primary HCE cells infected with A. flavus
Fig. 4
Fig. 4
Scatter plot for the differentially expressed genes of HCE cells cocultured with CI1698. MA plot showing the mRNA abundance in (a) RCB2280 cells (b) primary HCE cells after infection with CI1698 for 6 h. Red dots - Up-regulation; Blue dots – Down-regulation; Grey dots- no change
Fig. 5
Fig. 5
Differentially expressed immune genes of RCB2280 cells exposed with CI1698. Bar graph representing up-regulated (red) and down-regulated (green) genes with corresponding fold change in RCB2280 cells infected with CI1698 for 6 h
Fig. 6
Fig. 6
Differentially expressed immune genes of primary HCE cells cocultured with CI1698. Bar graph representing up-regulated (red) and down-regulated (green) genes with corresponding fold change in primary HCE cells infected with CI1698 for 6 h
Fig. 7
Fig. 7
KEGG pathway analysis of up and down-regulated genes of HCE cells infected with CI1698. (a) RCB2280 cells infected with CI1698 for 6 h. (b) Primary HCE cells infected with CI1698 for 6 h. Red bar - pathways associated with up-regulated genes; Green bar - pathways associated with down-regulated genes
Fig. 8
Fig. 8
The functionally grouped network of Gene Ontology enrichment analysis. Differentially expressed mRNA transcripts of RCB2280 cells and primary HCE cells infected with CI1698 using FunRich 3.1.3 and Cytoscape 3.8.1 tool. Green circle - RCB2280 cells infected with CI1698; Blue circle - primary HCE cells infected with CI1698; Red rectangle - Biological pathways
Fig. 9
Fig. 9
Scatter plot for the differentially expressed genes of HCE cells cocultured with CI1123. MA plot showing the mRNA abundance in (a) RCB2280 cells (b) primary HCE cells after infection with CI1123 for 6 h. Red dots - Up-regulation; Blue dots – Down-regulation; Grey dots - no change
Fig. 10
Fig. 10
Differentially expressed immune genes of RCB2280 cells exposed with CI1123. Bar graph representing up-regulated (red) and down-regulated (green) genes with corresponding fold change in RCB2280 cells infected with CI1123 for 6 h
Fig. 11
Fig. 11
Differentially expressed immune genes of primary HCE cells cocultured with CI1123. Bar graph showing up-regulated (red) and down-regulated (green) genes with corresponding fold change in primary HCE cells infected with CI1123 for 6 h
Fig. 12
Fig. 12
KEGG pathway analysis of up and down-regulated genes of HCE cells infected with CI1123 for 6 h. (a) RCB2280 cells infected with CI1123. (b) Primary HCE cells infected with CI1123. Red bar - pathways associated with up-regulated genes; Green bar - pathways associated with down-regulated genes
Fig. 13
Fig. 13
The functionally grouped network of Gene Ontology enrichment analysis. Differentially expressed mRNA transcripts of RCB2280 cells and primary HCE cells infected with CI1123 using FunRich 3.1.3 and Cytoscape 3.8.1 tool. Purple circle - RCB2280 cells infected with CI1698; Blue circle - primary HCE cells infected with CI1123; Red rectangle -Biological pathways
Fig. 14
Fig. 14
Pathway analysis of HCE cells in response to A. flavus clinical isolates. (a) Biological pathways of RCB2280 cells infected with CI1698 and CI1123 for 6 h. Grey bar - RCB2280 cells infected with CI1123; Black bar - RCB2280 cells infected with CI1698. (b) Biological pathways of primary HCE cells infected with CI1698 and CI1123. Dark green bar - Primary HCE cells infected with CI1123; Light green bar - Primary HCE cells infected with CI1698. (c) Up-regulated immune genes associated pathways in HCE cells infected with A. flavus clinical isolates. (d) Down-regulated immune genes associated pathways in HCE cells infected with A. flavus clinical isolates
Fig. 15
Fig. 15
Expression of IL-8 in RCB2280 cells infected with CI1123. RCB2280 cells were cultured in 12-well plate till confluency and infected with CI1123 for 12 h, 16 h, 20h and 24 h. Bar graph representing the concentration of IL-8 at different time point. Black bar -Control; Grey bar - RCB2280 cells infected with CI1123. The data were analyzed using two-way ANOVA with Bonferroni multiple comparison test (ns-no significance; **** p<0.0001)

Similar articles

Cited by

References

    1. Amaike S, Keller NP. Aspergillus flavus. Annu Rev Phytopathol. 2011;49:107–33. doi: 10.1146/annurev-phyto-072910-095221. - DOI - PubMed
    1. Krishnan S, Manavathu EK, Chandrasekar PH. Aspergillus flavus: an emerging non-fumigatus Aspergillus species of significance. Mycoses. 2009;52:206–22. doi: 10.1111/j.1439-0507.2008.01642.x. - DOI - PubMed
    1. Horn BW, Gell RM, Singh R, Sorensen RB, Carbone I. Sexual reproduction in Aspergillus flavus sclerotia: Acquisition of novel alleles from soil populations and uniparental mitochondrial inheritance. PLoS One. 2016;11:e0146169. doi: 10.1371/journal.pone.0146169. - DOI - PMC - PubMed
    1. Chang PK, Scharfenstein LL, Mack B, Ehrlich KC. Deletion of the Aspergillus flavus orthologue of A. nidulans fluG reduces conidiation and promotes production of sclerotia but does not abolish aflatoxin biosynthesis. Appl Environ Microbiol. 2012;78:7557–63. doi: 10.1128/AEM.01241-12. - DOI - PMC - PubMed
    1. Hedayati MT, Pasqualotto AC, Warn PA, Bowyer P, Denning DW. Aspergillus flavus: human pathogen, allergen and mycotoxin producer. Microbiology. 2007;153:1677–92. doi: 10.1099/mic.0.2007/007641-0. - DOI - PubMed